DSpace at VNU: Comparison of enzyme-assisted and ultrasound-assisted extraction of vitamin C and phenolic compounds from acerola (Malpighia emarginataDC.) fruit
Bạn đang xem bản rút gọn của tài liệu. Xem và tải ngay bản đầy đủ của tài liệu tại đây (822.29 KB, 9 trang )
International Journal of Food Science and Technology 2012
1
Original article
Comparison of enzyme-assisted and ultrasound-assisted extraction
of vitamin C and phenolic compounds from acerola (Malpighia
emarginata DC.) fruit
Hong Van Le & Van Viet Man Le*
Department of Food Technology, Ho Chi Minh City University of Technology, 268 Ly Thuong Kiet Street, District 10, Ho Chi Minh City,
Vietnam
(Received 7 September 2011; Accepted in revised form 7 January 2012)
Summary
This article describes a comparative study of enzyme and ultrasound techniques for the simultaneous
extraction of vitamin C and phenolic compounds from acerola fruit. Ultrasound-assisted extraction (UAE)
took only 6 min to achieve the highest level of vitamin C and phenolic compounds as well as antioxidant
activity of acerola juice, while enzyme-assisted extraction (EAE) took up to 120 min to obtain the maximal
values. On the basis of kinetic model of second-order extraction, the extraction rate constant of vitamin C
and phenolics in UAE increased approximately 3.1 and 2.7 times, respectively, in comparison with that in
EAE. In addition, the maximal level of vitamin C, phenolics and the antioxidant activity evaluated by 1,1diphenyl-2-picrylhydrazyl (DPPH), and 2,2¢-azinobis-(3-ethylbenzothiazoline-6-sulphonic acid) (ABTS)
methods in UAE was 4.6%, 3.5%, 4.6% and 3.3%, respectively, higher than those in EAE. Obviously,
UAE is a useful method for the extraction of antioxidants from plant materials.
Keywords
Acerola fruit, antioxidant activity, enzyme-assisted extraction, kinetic, phenolic compounds, ultrasound-assisted extraction,
vitamin C.
Introduction
Acerola (Malpighia glabra L. or Malpighia emarginata
DC.) is a fruit found from Central America to northern
South America. It has recently been introduced in
subtropical areas throughout the world, including
Southeast Asia. The pulp is very juicy, especially
possesses fruity and sweet flavour (Boulanger & Crouzet, 2001). This fruit is well known to be one of the best
natural sources of ascorbic acid (vitamin C), and has
become extremely popular in daily life (Hanamura
et al., 2006). This fruit also contains phenolic compounds. Both vitamin C and phenolic compounds are
powerful antioxidants, and their biological functions
prevent common degenerative processes (Hanamura
et al., 2008). Acerola juice with high vitamin C and
phenolic contents has, therefore, attracted much more
interest in human diet (Matta et al., 2004).
The classical techniques for juice extraction are
pressing (Chemat et al., 2008) and enzymatic maceration (Kashyap et al., 2001; Matta et al., 2004; Lieu &
Le, 2010). Nevertheless, these methods are often
*Correspondent: E-mail:
time- and energy-consuming as well as their extraction
efficiency is usually low.
Nowadays, a number of novel methods for target
component extraction from plant materials have been
applied, for example, supercritical fluid extraction (Pinelo et al., 2007), accelerated solvent extraction (Hossain
et al., 2011), microwave-assisted extraction (Bai et al.,
2010) and ultrasound-assisted extraction (UAE) (Vilkhu
et al., 2008; Khan et al., 2010). Among these methods,
the technology of UAE has shown high extraction
efficiency, low-energy and solvent consumptions (Pan
et al., 2011).
In recent years, there have been several researches on
the application of UAE of various bioactive compounds,
for instance, UAE of phenolic compounds from strawberries (Herrera & Luque de Castro, 2005), coconut shell
powder (Rodrigues & Pinto, 2007), citrus peel (Ma et al.,
2009; Khan et al., 2010) and olive fruit (Jerman et al.,
2010). However, so far, there has not been report on
UAE of antioxidant-rich acerola juice yet, which has
both high vitamin C and phenolic contents.
The objectives of this study were to (i) investigate the
effects of enzyme-assisted extraction (EAE) and UAE
variables on extraction yield of vitamin C and phenolic
compounds from acerola fruit, (ii) determine the kinetic
doi:10.1111/j.1365-2621.2012.02960.x
Ó 2012 The Authors. International Journal of Food Science and Technology Ó 2012 Institute of Food Science and Technology
2
Comparison of enzyme-assisted and ultrasound-assisted extraction H. V. Le and V. V. M. Le
parameters of vitamin C and phenolic extraction process, and (iii) compare the acerola juice quality obtained
from both methods.
Materials and methods
Materials
Enzyme source
Commercial enzyme preparation ‘Celluclast 1.5L’ produced by Trichoderma reesei was obtained from SigmaAldrich (Singapore). The enzyme activity is 1500 Novo
Cellulase Unit per gram (NCU g)1). One NCU is the
amount of enzyme which, under standard conditions,
degrades carboxymethylcellulose to reducing carbohydrates with a reduction power corresponding to 1 lmol
glucose per minute (Arapoglou et al., 2010). The optimal
temperature and pH of this enzyme preparation are
50–60 °C and 4.5–6.0, respectively (Sørensen et al., 2003).
Plant material
Acerola (Malpighia emarginata DC.) used in this study
was purchased from a farm in Go Cong, Vietnam. The
fruits were harvested during the period from July to
December in 2010. The bright orange fruits without
disease symptoms were selected.
Chemicals
6-Hydroxy-2,5,7,8-tetramethylchroman-2-carboxylic
acid (Trolox), 1,1-diphenyl-2-picrylhydrazyl (DPPH),
and 2,2¢-azinobis-(3-ethylbenzothiazoline-6-sulphonic
acid) (ABTS) were purchased from Sigma-Aldrich
(Singapore). Folin–Ciocalteu reagent, l-ascorbic acid,
methanol, ethanol, gallic acid, potassium persulphate
(K2S2O8), 85% phosphoric acid (H3PO4) solution,
potassium dihydrogen phosphate (KH2PO4) and anhydrous sodium carbonate (Na2CO3) were obtained from
Merck (Darmstadt, Germany). All reagents were
of analytical grade. Double-distilled water was used
throughout experiments.
Extraction methods
Acerola was destemmed, washed and crushed in a
blender (Panasonic, MJ 70M, Selangor, Malaysia).
In this study, water was used as the extraction solvent
for both methods. Water was considered to be an efficient
extraction solvent for antioxidant production from some
plant materials (Mezadri et al., 2008; Pan et al., 2011).
Moreover, water is an environmentally friendly extraction solvent, and using water, we could obtain antioxidant-rich acerola juice, but not only antioxidant
compounds (vitamin C and phenolics) in acerola fruit.
After crushing, acerola mash was mixed with water at
the weight ratio of water to acerola mash of 2:1 and
subsequently used for juice extraction.
International Journal of Food Science and Technology 2012
Enzyme-assisted extraction
For each assay, samples of 30 g diluted acerola mash
were taken and placed into 250-mL beakers, which were
covered with aluminium-foil papers to prevent the
oxidative change from light.
First series: Different amounts of Celluclast 1.5L were
added into beakers of samples. Enzyme concentrations
were 0.15%, 0.3%, 0.45%, 0.6%, 0.75%, and 0.9%
(v ⁄ w). These values were equivalent to 0, 2.7, 5.4, 8.1,
10.8, 13.5, and 16.2 NCU g)1 of diluted acerola mash
(NCU g)1), respectively. The samples were then incubated in the period of 30 min.
Second series: An amount of Celluclast 1.5L
(8.1 NCU g)1) was added into beakers of samples.
The extraction times were varied from 30 to 150 min.
In both series, the control samples were untreated
with enzyme preparation. Extraction temperature was
adjusted to 50 °C using a thermostatic water bath
(Memmert, Jakarta, Indonesia). After the period of
incubation, the mash was filtered through a cheese cloth.
The obtained suspension was separated by a refrigerated
centrifuge (Sartorius, Sigma 3K30, Geneva, Switzerland) at 1370 g for 10 min at 10 °C, and the supernatant
was collected for further analysis.
Ultrasound-assisted extraction
The UAE was performed with a horn-type ultrasonic
probe with frequency of 20 kHz (Sonics and Materials.
Inc, VC750, Newtown, MA, USA). For each assay,
samples of 30 g of diluted acerola mash were taken and
placed into 100-mL beakers which were covered with
aluminium-foil papers to prevent oxidative change from
light.
First series: Ultrasonic power levels were adjusted to
150, 300, 450 and 600 W, respectively. Because each
sample contained 30 g diluted acerola mash, the ultrasonic
power per gram of the material would be 5, 10, 15 and
20 W g)1, respectively. The ultrasonic time was 2 min.
Second series: The ultrasonic power of 15 W g)1 was
applied. The ultrasonic times were ranged from 2 to
10 min.
In both series, the control samples were untreated
with ultrasound. Because the temperature of the samples
was gradually increased during the UAE, a water bath
with cooled water (5–8 °C) was used to maintain the
sample temperature not to exceed 50 °C. At the end of
the process, the mash was also filtered and separated in
the same way as shown in the EAE.
Determination of kinetic parameters of vitamin C and
phenolic extraction from the second-order kinetic model
To determine the extraction rate constant of vitamin
C, the second-order rate law was applied (Pan et al.,
2011). The general second-order model can be written
as:
Ó 2012 The Authors
International Journal of Food Science and Technology Ó 2012 Institute of Food Science and Technology
Comparison of enzyme-assisted and ultrasound-assisted extraction H. V. Le and V. V. M. Le
dCt
¼ k ðCe À Ct Þ2
dt
ð1Þ
where, k is the second-order extraction rate constant
(L g)1 min)1), Ce is the extraction capacity (the equilibrium concentration of vitamin C in acerola juice)
(g L)1), and Ct is the concentration of vitamin C in
acerola juice at a given extraction time (g L)1).
The integrated rate law for a second-order extraction,
under the boundary conditions t = 0 to t and Ct = 0 to
Ct, can be written as an equation (2) or a linearised
equation (3):
C2e kt
1 þ Ce kt
ð2Þ
t
1
t
¼
þ
Ct kC2e Ce
ð3Þ
Ct ¼
The initial extraction rate, h (g L)1 min)1), as Ct ⁄ t
when t approaches 0, can be defined as equation (4):
h ¼ k C2e
ð4Þ
The initial extraction rate, h, the extraction capacity,
Ce, and the second-order extraction rate constant, k, can
be determined experimentally from the slope and the
intercept by plotting t ⁄ Ct vs. t.
The kinetic parameters of phenolic extraction were
also calculated in the same way of those of vitamin C
extraction.
Comparison of acerola juice quality obtained from enzymeassisted extraction (EAE) and ultrasound-assisted
extraction (UAE)
Enzyme-assisted extraction and UAE were carried out
in the appropriate conditions obtained from the above
experiments of each method. The two methods were
compared on the increased percentage of vitamin C,
phenolic compounds and the antioxidant activity of
acerola juice using control sample as the base. The
control sample was untreated with both enzyme preparation and ultrasound.
Analytical methods
LC-10AS, Kyoto, Japan), a UV detector (Shimadzu,
SPD-6AV, Kyoto, Japan) and a C18 column
(250 · 4.6 mm I.D., 5 lm) (Shimadzu, Gemini 5u C18
110A, Kyoto, Japan). The procedure was carried out
according to the method of Abushita et al. (1997) with
slight modifications. The mobile phase was a mixture of
two solvents: A (potassium dihydrogen phosphate in
water adjusted to pH 2.8) and B (methanol) with the ratio
of 9:1 (v ⁄ v). The constant flow rate was 1.5 mL min)1.
The column was maintained at room temperature, and
the injection volume was 20 lL. Ascorbic acid elution
was monitored at 245 nm.
The content of ascorbic acid in acerola juice was
expressed as grams per litre (g L)1) and was calculated
using an external calibration curve prepared with the
standard ascorbic acid. According to Mezadri et al.
(2008), ascorbic acid is the predominant form of vitamin
C in acerola; hence, the content of ascorbic acid was
used to present the content of vitamin C in acerola juice
in our study.
Antioxidant activity
The procedure for antioxidant activity evaluation
followed the method of Thaipong et al. (2006) with
slight modifications.
For DPPH assay, briefly, the stock 0.1 mm DPPH
violet solution was diluted with methanol to obtain an
absorbance of 1.1 ± 0.02 units at 515 nm. The reaction
medium contained 5 mL of diluted DPPH• solution and
265 lL diluted acerola juice for the sample or methanol
solution of Trolox (25–700 lm) for the standard, or water
for the blank. The reaction mixture was kept at room
temperature in the dark for 20 min, and the absorbance
was measured at 515 nm. Antioxidant activity of acerola
juice was expressed as millimolar Trolox equivalent
antioxidant capacity per litre (mm TEAC).
For ABTS assay, once the radical was formed, the
ABTS·+ solution was diluted with ethanol to obtain an
absorbance of 0.7 ± 0.02 units at 734 nm. The reaction
then started by adding 400 lL diluted acerola juice to
5 mL of diluted ABTS•+ radical cation solution, and
the absorbance was measured after 1 min at 734 nm.
Standard Trolox solutions (25–500 lm) were also evaluated against the radical. Antioxidant activity of acerola
juice was expressed as mmol Trolox equivalent antioxidant capacity per litre (mm TEAC).
Phenolic compounds
Total phenolic content in acerola juice was determined
as previously described by Luque-Rodrı´ guez et al.
(2007), using Folin–Ciocalteu reagent. The results were
expressed as the equivalent to grams of gallic acid per
litre of acerola juice (g GAE L)1).
Vitamin C
In this study, vitamin C was quantified by HPLC. The
HPLC system used included a pump (Shimadzu,
Statistical analysis
All experiments were performed in triplicate. The
experimental results obtained were expressed as
means ± SD (standard deviation). Mean values were
considered significantly different when P < 0.05. Analysis of variance was performed using the software
Statgraphics plus, version 7.0 (Manugistics, Inc., Rockville, MD, USA).
Ó 2012 The Authors
International Journal of Food Science and Technology Ó 2012 Institute of Food Science and Technology
International Journal of Food Science and Technology 2012
3
Comparison of enzyme-assisted and ultrasound-assisted extraction H. V. Le and V. V. M. Le
21.2
18.2
20.2
19.2
Phenolics
17.7
Vitamin C
17.2
0
2.7
5.4
8.1
10.8
13.5
16.2
Phenolics (g GAE L–1)
(a) 19.2
18.2
27.2
25.2
18.7
23.2
18.2
21.2
17.7
Phenolics
19.2
Vitamin C
17.2
17.2
18.9
0
30
60
90
120
150
180
17.2
Time of enzymatic treatment (min)
Enzyme concentration (NCU g–1)
(b) 140
Antioxidant activity (mM TEAC)
(b) 130
120
110
100
DPPH
ABTS
90
Vitamin C (g L–1)
22.2
18.7
Vitamin C (g L–1)
Phenolics (g GAE L–1)
(a)
Antioxidant activity (mM TEAC)
4
0
2.7
5.4
8.1
10.8
13.5
16.2
18.9
130
120
110
90
Enzyme concentration (NCU g–1)
DPPH
100
ABTS
0
30
60
90
120
150
180
Time of enzymatic treatment (min)
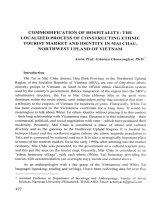
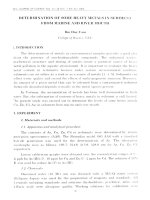
Figure 1 Effect of enzyme concentration on (a) the level of vitamin C,
phenolics, and (b) antioxidant activity of acerola juice.
Results and discussion
Enzyme-assisted extraction
Figure 1 shows the changes in the antioxidant content
and antioxidant activity of acerola juice with respect to
enzyme concentration. The level of the target components significantly improved with the increase in enzyme
concentration and approached the highest value at
enzyme concentration of 8.1 NCU g)1. Higher enzyme
concentration did not result in higher vitamin C and
phenolic contents. According to Mosier et al. (1999),
cellulase preparation from T. reesei contained many
enzymes such as endoglucanase, cellobiohydrolase and
b-glucosidase. These enzymes would be expected to
degrade structural cellulose that makes up 27% in the
primary cell wall of the acerola pulp (Lima et al., 1996).
That enhanced the efficiency of the extraction process.
International Journal of Food Science and Technology 2012
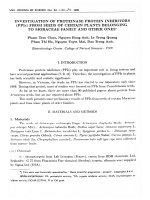
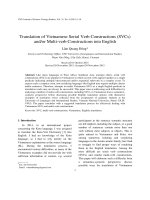
Figure 2 Effect of enzymatic extraction time on (a) the level of vitamin
C, phenolics, and (b) antioxidant activity of acerola juice.
Owing to the increase in vitamin C and phenolic
contents, the antioxidant activity of acerola juice also
raised with the increase in enzyme concentration.
However, the antioxidant activities determined by
DPPH method were always lower than those measured
by ABTS method. It could be explained that anthocyanin, which is one of the main polyphenol components
in acerola fruit, absorbs maximally at 520 nm (Zanatta
et al., 2005); therefore, its colour would interference
with the DPPH chromogen, which has maximum
absorbance at 515 nm. This would lead to the results
in the relatively lower activity measured by DPPH
method (Awika et al., 2003).
The influence of enzymatic extraction time on the
antioxidant content and activity of acerola juice is listed
in Fig. 2. A positive effect on vitamin C and phenolic
level was observed when the time of EAE was not longer
Ó 2012 The Authors
International Journal of Food Science and Technology Ó 2012 Institute of Food Science and Technology
Comparison of enzyme-assisted and ultrasound-assisted extraction H. V. Le and V. V. M. Le
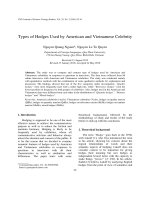
Ultrasound-assisted extraction
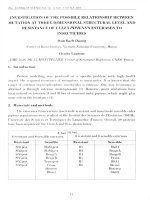
Figure 3 illustrates the effect of ultrasonic power on the
level of vitamin C, phenolic compounds and antioxidant
activity of acerola juice. The antioxidant concentrations
increased when the ultrasonic power augmented from 5
to 15 W g)1 (P < 0.05); however, these values did not
change significantly at higher ultrasonic power
(P > 0.05).
The mechanism of UAE is ascribed to the acoustic
cavitation, which includes the formation, growth and
implosive collapse of bubbles in a liquid (Chowdhury &
Viraraghavan, 2009). The implosion of cavitation bubbles generates severe turbulence, high-velocity interparticle collisions and perturbation in microporous
particles of the materials, which accelerates the eddy
diffusion and internal diffusion. Moreover, cavitation
within the proximity of solid surface causes surface
erosion and particle breakdown. This effect provides
23.2
(a) 19.2
18.7
21.2
20.2
18.2
17.2
19.2
Phenolics
17.7
Vitamin C
0
5
10
15
20
Vitamin C (g L–1)
Phenolics (g GAE L–1)
22.2
18.2
25
17.2
Ultrasonic power (W g–1)
(b) 130
Antioxidant activity (mM TEAC)
than 120 min. A further increase in the extraction time
resulted in significantly (P < 0.05) lower concentrations
of vitamin C and phenolic compounds. Hence, the
antioxidant activity of acerola juice also declined when
the biocatalytic time was prolonged.
To clearly understand the effect of the extraction time
on the performance of vitamin C, an additional experiment was conducted with the standard solution of
ascorbic acid under the same temperature and enzyme
concentration. The results (unpublished data) showed
that the ascorbic acid level was stable during the first
30 min and then slightly decreased about 3.2% after
120-min incubation as compared to the initial level.
Finally, a remarkable reduction of 10.9% in the ascorbic
acid level was observed in the 150-min treated sample
compared to that in the 120-min treated sample. This
was attributed to the thermo-oxidative degradation
caused by high temperature and overlong extraction
time. It is interesting to note that the percentage
reduction in vitamin C in the 150-min treated acerola
juice compared to the 120 min treated acerola juice was
10.8% (Fig. 2). This similarity suggested that the
extraction of vitamin C could not continue when the
enzymatic extraction time was longer than 120 min.
In summary, the results indicated that the efficient
extraction period with enzyme concentration of
8.1 NCU g)1 was 120 min. Under these appropriate
conditions, the level of vitamin C, phenolics and
antioxidant activity of acerola juice based on DPPH
and ABTS methods rose approximately 35.7%, 9.0%,
23.9% and 22.6%, respectively, in comparison with
those of the control sample. Although pectinase has
been widely used in juice extraction (Kashyap et al.,
2001; Lieu & Le, 2010), our results revealed that
cellulolytic enzyme is also a potential biocatalyst to
obtain antioxidant-rich fruit juice.
120
110
100
DPPH
ABTS
90
0
5
10
15
20
25
Ultrasonic power (W g–1)
Figure 3 Effect of ultrasonic power on (a) the level of vitamin C,
phenolics, and (b) antioxidant activity of acerola juice.
exposure of new surfaces further increasing mass transfer (Vilkhu et al., 2008). Our results are consistent with
previous findings (Ma et al., 2009; Pan et al., 2011). Ma
et al. (2009) and Pan et al. (2011) reported that the
yields of phenolic compounds from citrus and pomegranate peel depended significantly on the ultrasonic
power level. In our study, nevertheless, the content of
vitamin C and phenolics kept unchanged when the
ultrasonic power was higher than 15 W g)1. This may be
attributed to the fact that the cavitation bubbles may
grow too big to collapse or collapse weakly which could
cause the reduction in the cavitation effect. Also, many
bubbles may hamper the propagation of the ultrasound
wave (Sun et al., 2011).
A positive correlation between the content of antioxidants and the antioxidant activity of acerola juice was
observed (Fig. 3a, b). The increase in biologically active
compounds may lead to enhance the antioxidant activity
Ó 2012 The Authors
International Journal of Food Science and Technology Ó 2012 Institute of Food Science and Technology
International Journal of Food Science and Technology 2012
5
Comparison of enzyme-assisted and ultrasound-assisted extraction H. V. Le and V. V. M. Le
Phenolics (g GAE L–1)
19.7
27.2
20.0
25.2
18.0
19.2
23.2
18.7
21.2
18.2
Phenolics
17.2
19.2
Vitamin C
17.7
0
2
4
6
8
10
12
Concentration of ascorbic acid
standard solution (g L–1)
20.2
Vitamin C (g L–1)
(a)
16.0
14.0
Uncontrolled temperature
12.0
Controlled temperature
17.2
10.0
Ultrasonic time (min)
0
2
4
6
8
10
12
Ultrasonic time (min)
(b) 140
Antioxidant activity (mM TEAC)
6
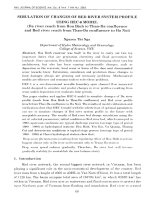
Figure 5 Effect of ultrasonic time on the stability of vitamin C. The
ascorbic acid standard solution was sonicated at the ultrasonic power
of 15 W g)1 under both uncontrolled and controlled temperature
conditions.
130
120
110
DPPH
100
90
ABTS
0
2
4
6
8
10
12
Ultrasonic time (min)
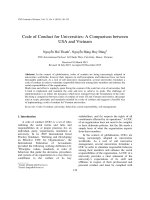
Figure 4 Effect of ultrasonic time on (a) the level of vitamin C,
phenolics, and (b) antioxidant activity of acerola juice.
of the extract. Besides, ultrasound could separate sugar
moiety from acerola glycosides to create aglycones. It
was reported that aglycones are more potent antioxidants than their corresponding glycosides (London˜oLondon˜o et al., 2010). Furthermore, the moderate
sonochemical hydroxylation of phenolic compounds,
which was caused by hydroxyl radicals produced during
the sonolysis of water, could improve their antioxidant
properties (Ashokkumar et al., 2008).
The results in Fig. 4 have shown that prolongation of
the ultrasonic time augmented the level of vitamin C,
phenolics and antioxidant activity of acerola juice;
maximum of these values achieved after 6-min sonication. The vitamin C content rose approximately 40.3%
compared to that in the control sample, while the
increase in phenolic content was much lower with just
roughly 12.5% (Fig. 4a). The antioxidant activities of
International Journal of Food Science and Technology 2012
acerola juice measured by DPPH and ABTS methods
under this condition also increased 28.5% and 25.9%,
respectively, as compared to those in the control sample
(Fig. 4b).
To evaluate the stability of the antioxidants under
sonication, the standard solution of ascorbic acid was
exposed to ultrasound with the same conditions of
UAE. Because of polyphenol-protective ability of ascorbic acid (Altunkaya & Gokmen, 2009), we chose this
component to investigate the stability of the antioxidants in acerola juice. As seen from Fig. 5, when the
temperature was controlled to be inferior to 50 °C (the
ultrasonic conditions in our study), the concentration of
ascorbic acid in the standard solution did not change,
whilst this value dramatically reduced up to 29.2% in
the period of 10-min ultrasonic treatment without
temperature control. The reduction in ascorbic acid
concentration under the uncontrolled temperature condition may be due to (i) the interaction of this
compound with hydroxyl radicals, and ⁄ or (ii) the
adverse effect of temperature on the structure of
ascorbic acid. Nonetheless, according to Entezari et al.
(2003) and Khan et al. (2010), sonication at frequency of
20 kHz during short duration produced low concentration of hydroxyl radicals. It was therefore concluded
that the loss of ascorbic acid may be related to the
decomposition of analyte caused by thermal degradation. Thus, temperature was an important variable for
ultrasonic extraction of vitamin C. We suggested that
the temperature of UAE for antioxidants in acerola fruit
should not exceed 50 °C.
Ó 2012 The Authors
International Journal of Food Science and Technology Ó 2012 Institute of Food Science and Technology
Comparison of enzyme-assisted and ultrasound-assisted extraction H. V. Le and V. V. M. Le
(a)
9.0
Extraction rate reciprocal
(min L g–1)
8.0
7.0
Phenolics
6.0
Vitamin C
5.0
4.0
3.0
2.0
1.0
0.0
0
30
60
90
120
150
180
Time (min)
(b)
0.6
Extraction rate reciprocal
(min L g–1)
0.5
Phenolics
0.4
Vitamin C
UAE were also observed to augment 9.5% and 4.5% for
vitamin C and phenolic compounds, respectively, in
comparison with those in EAE. These results concluded
that UAE efficiently enhances the extraction rate of
antioxidants from acerola fruit. Similar kinetic effects
were evidenced by Chemat et al. (2004) and Khan et al.
(2010) for UAE of polyphenols from orange peel and
essential oils from caraway seeds, respectively. Likewise,
ultrasound could improve the second-order kinetic
parameters of polyphenol extraction from pomegranate
peel (Pan et al., 2011). However, the values and the
increase in the kinetic parameters estimated by these
authors were much lower than those in our study. It is
possible that (i) the level of phenolic content in acerola
fruit was higher than that in pomegranate peel, and (ii)
phenolic compounds could be extracted from fruit easier
than from peel.
As seen from Table 1, all kinetic parameters for
vitamin C were always remarkably higher than those for
phenolic compounds. Thus, vitamin C could be
extracted more efficiently than phenolics regardless of
extraction methods. The second-order model fitted well
the experimental results owing to the obtained high
coefficient of determination (Table 1). This confirmed
that there are two main stages during the antioxidant
extraction from acerola fruit.
0.3
Comparison of acerola juice quality obtained from enzymeassisted extraction (EAE) and ultrasound-assisted
extraction (UAE)
0.2
0.1
0.0
0
2
4
6
8
10
12
Time (min)
Figure 6 Extraction rate reciprocal (t ⁄ Ct) of antioxidants at different
extraction times (t) in (a) enzyme-assisted extraction (EAE) and (b)
ultrasound-assisted extraction (UAE).
Extraction kinetics of enzyme-assisted extraction (EAE)
and ultrasound-assisted extraction (UAE)
Figure 6 illustrates the linearised forms of the secondorder model for the two extraction methods. The
extraction capacity, Ce, the initial extraction rate, h,
the extraction rate constant, k, and the coefficient of
determination, R2, given for the two methods in Table 1,
are in accordance with the graphs in Fig. 6. The results
indicated that Ce, h and k were higher in UAE than
those in EAE. The values of the rate constant, k, were
found approximately 3.1 times for vitamin C and 2.7
times for phenolics as fast in UAE as in EAE; in the
same ways, the values of the extraction capacity, Ce, in
In comparison with EAE, UAE improved the level of
phenolic compounds and vitamin C as well as antioxidant activity of acerola juice (Table 2). Regarding
vitamin C, UAE increased its value 4.6% more than
EAE. Besides, phenolic level in UAE was also 3.5%
higher than that in EAE. Our results are in agreement
with many findings that UAE enhanced the yield of
bioactive constituents in comparison with the conventional techniques (Vilkhu et al., 2008; Khan et al.,
2010).
As seen in Table 2, both EAE and UAE enhanced
greater vitamin C content than phenolic content. The
possible reasons are that (i) vitamin C is more abundant
than phenolic compounds in acerola fruit (Mezadri
et al., 2008), and (ii) phenolic compounds can link with
various compounds of cell walls such as polysaccharides
or proteins (Lieu & Le, 2010), which may make phenolic
extraction more difficult than vitamin C extraction.
Owing to the increase in vitamin C and phenolic
contents, the increase in antioxidant activity of acerola
juice in UAE was also higher in comparison with that in
EAE (Table 2). It should be noted that ultrasound
improved not only the content of antioxidants but also
the total antioxidant activity of these compounds in our
study. Further experimental work on identifying the
Ó 2012 The Authors
International Journal of Food Science and Technology Ó 2012 Institute of Food Science and Technology
International Journal of Food Science and Technology 2012
7
8
Comparison of enzyme-assisted and ultrasound-assisted extraction H. V. Le and V. V. M. Le
Table 1 Comparison of the second-order kinetic parameters of antioxidant extraction in enzyme-assisted extraction (EAE) and ultrasound-assisted
extraction (UAE)
Component
Vitamin C
Phenolic compounds
Extraction
method
Extraction
capacity, Ce (g L)1)
Initial extraction
rate, h (g L)1 min)1)
Extraction rate
constant, k (L g)1 min)1)
R2
EAE
UAE
EAE
UAE
23.42
25.64
18.87
19.72
333.3
1250.0
114.9
333.3
0.61
1.90
0.32
0.86
0.992
0.998
1.000
1.000
Table 2 Comparison of acerola juice quality obtained from enzymeassisted extraction (EAE) and ultrasound-assisted extraction (UAE)
Increased level of components* (%)
Antioxidant
activity
Extraction
method
Vitamin C
Phenolics
DPPH
ABTS
EAE
UAE
35.7a
40.3b
9.0a
12.5b
23.9a
28.5b
22.6a
25.9b
EAE: 1:2 (w ⁄ w) acerola mash ⁄ water ratio, enzyme concentration of
8.1 NCU g)1, and extraction time of 120 min at 50 °C; UAE: 1:2 (w ⁄ w)
acerola mash ⁄ water ratio, ultrasonic power of 15 W g)1 and ultrasonic
time of 6 min at 50 °C.
Different small letters in the same column mean significant difference at
P < 0.05.
*Compared to the control sample.
types of phenolic compounds has to be carried out for
profound understanding.
Conclusions
Ultrasound-assisted extraction has been shown to be an
efficient method for the extraction of vitamin C and
phenolic compounds from acerola fruit compared to
EAE. The results indicated that not only higher levels of
vitamin C and phenolics were achieved but also higher
antioxidant activity of acerola juice was observed in
UAE as compared to those in EAE. Furthermore, the
extraction time of UAE was significantly shorter than
that of EAE. A considerable reduction in the extraction
time seems to be suitable for the extraction of thermally
labile compounds.
References
Abushita, A.A., Hebshi, E.A., Daood, H.G. & Biacs, P.A. (1997).
Determination of antioxidant vitamins in tomatoes. Food Chemistry,
60, 207–212.
Altunkaya, A. & Gokmen, V. (2009). Effect of various anti-browning
agents on phenolic compounds profile of fresh lettuce (L. sativa).
Food Chemistry, 117, 122–126.
International Journal of Food Science and Technology 2012
Arapoglou, D., Varzakas, Th., Vlyssides, A. & Israilides, C. (2010).
Ethanol production from potato peel waste (PPW). Waste Management, 30, 1898–1902.
Ashokkumar, M., Sunartio, D., Kentish, S. et al. (2008). Modification
of food ingredients by ultrasound to improve functionality: a
preliminary study on a model system. Innovative Food Science &
Emerging Technologies, 9, 155–160.
Awika, J.M., Rooney, L.W., Wu, X., Prior, R.L. & Cisneros-Zevallos,
L. (2003). Screening methods to measure antioxidant activity of
sorghum (Sorghum bicolor) and sorghum products. Journal of
Agricultural and Food Chemistry, 51, 6657–6662.
Bai, X.L., Yue, T.L., Yuan, Y.H. & Zhang, H.W. (2010). Optimization
of microwave-assisted extraction of polyphenols from apple pomace
using response surface methodology and HPLC analysis. Journal of
Separation Science, 33, 3751–3758.
Boulanger, R. & Crouzet, J. (2001). Identification of the aroma
components of acerola (Malphigia glabra L.): free and bound flavor
compounds. Food Chemistry, 74, 209–216.
Chemat, S., Lagha, A., AitAmar, H., Bartels, P.V. & Chemat, F.
(2004). Comparison of conventional and ultrasound-assisted extraction of carvone and limonene from caraway seeds. Flavour and
Fragrance Journal, 19, 188–195.
Chemat, F., Tomao, V. & Virot, M. (2008). Ultrasound-assisted
extraction in food analysis. In: Handbook of Food Analysis Instruments (edited by S. O¨tles). Pp. 85–103. Boca Raton, Florida, USA:
CRC Press.
Chowdhury, P. & Viraraghavan, T. (2009). Sonochemical degradation
of chlorinated organic compounds, phenolic compounds and
organic dyes – A review. Science of the Total Environment, 407,
2474–2492.
Entezari, M.H., Pe´trier, C. & Devidal, P. (2003). Sonochemical
degradation of phenol in water: a comparison of classical equipment
with a new cylindrical reactor. Ultrasonics Sonochemistry, 10, 103–
108.
Hanamura, T., Mayama, C., Aoki, H., Hirayama, Y. & Shimizu, M.
(2006). Antihyperglycemic effect of polyphenols from acerola
(Malpighia emarginata DC.) fruit. Bioscience, Biotechnology, and
Biochemistry, 70, 1813–1820.
Hanamura, T., Uchida, E. & Aoki, H. (2008). Changes of the
composition in acerola (Malpighia emarginata DC.) fruit in relation
to cultivar, growing region and maturity. Journal of the Science of
Food and Agriculture, 88, 1813–1820.
Herrera, M.C. & Luque de Castro, M.D. (2005). Ultrasound-assisted
extraction of phenolic compounds from strawberries prior to liquid
chromatographic separation and photodiode array ultraviolet
detection. Journal of Chromatography A, 1100, 1–7.
Hossain, M.B., Barry-Ryan, C., Martin-Diana, A.B. & Brunton, N.P.
(2011). Optimisation of accelerated solvent extraction of antioxidant
compounds from rosemary (Rosmarinus officinalis L.), marjoram
(Origanum majorana L.) and oregano (Origanum vulgare L.) using
response surface methodology. Food Chemistry, 126, 339–346.
Jerman, T., Trebsˇ e, P. & Vodopivec, B.M. (2010). Ultrasound-assisted
solid liquid extraction (USLE) of olive fruit (Olea europaea)
phenolic compounds. Food Chemistry, 123, 175–182.
Ó 2012 The Authors
International Journal of Food Science and Technology Ó 2012 Institute of Food Science and Technology
Comparison of enzyme-assisted and ultrasound-assisted extraction H. V. Le and V. V. M. Le
Kashyap, D.R., Vohra, P.K., Chopra, S. & Tewari, R. (2001).
Applications of pectinases in the commercial sector: a review.
Bioresource Technology, 77, 215–227.
Khan, M.K., Abert-Vian, M., Fabiano-Tixier, A.S., Dangles, O. &
Chemat, F. (2010). Ultrasound-assisted extraction of polyphenols
(flavanone glycosides) from orange (Citrus sinensis L.) peel. Food
Chemistry, 119, 851–858.
Lieu, L.N. & Le, V.V.M. (2010). Application of ultrasound in grape
mash treatment in juice processing. Ultrasonics Sonochemistry, 17,
273–279.
Lima, L.C.O., Chitarra, A.B. & Chitarra, M.I.F. (1996). Cellulose and
cell wall neutral sugar composition during acerola fruit maturation.
Proceedings of InterAmerican Society for Tropical Horticulture, 40,
69–74.
London˜o-London˜o, J., Rodrigues de Lima, V., Lara, O. et al. (2010).
Clean recovery of antioxidant flavonoids from citrus peel: optimizing an aqueous ultrasound-assisted extraction method. Food Chemistry, 119, 81–87.
Luque-Rodrı´ guez, J.M., Luque de Castro, M.D. & Pe´rez-Juan, P.
(2007). Dynamic superheated liquid extraction of anthocyanins and
other phenolics from red grape skins of winemaking residues.
Bioresource Technology, 98, 2705–2713.
Ma, Y.Q., Chen, J.C., Liu, D.H. & Ye, X.Q. (2009). Simultaneous
extraction of phenolic compounds of citrus peel extracts: effect of
ultrasound. Ultrasonics Sonochemistry, 16, 57–62.
Matta, V.M., Moretti, V.M. & Cabral, L.M.C. (2004). Microfiltration
and reverse osmosis for clarification and concentration of acerola
juice. Journal of Food Engineering, 61, 477–482.
Mezadri, T., Villan˜o, D., Ferna´ndez-Pacho´n, M.S., Garcı´ a-Parrilla,
M.C. & Troncoso, A.M. (2008). Antioxidant compounds and
antioxidant activity in acerola (Malpighia emarginata DC.) fruits
and derivatives. Journal of Food Composition and Analysis, 21, 282–
290.
Mosier, N.S., Hall, P., Ladisch, C.M. & Ladisch, M.R. (1999).
Reaction kinetics, molecular action, and mechanisms of cellulolytic
proteins. Advances in Biochemical Engineering ⁄ Biotechnology, 65,
23–40.
Pan, Z., Qu, W., Ma, H., Atungulu, G.G. & McHugh, T.H. (2011).
Continuous and pulsed ultrasound-assisted extractions of antioxidants from pomegranate peel. Ultrasonics Sonochemistry, 18, 1249–
1257.
Pinelo, M., Ruiz-Rodrı´ guez, A., Sineiro, J., Sen˜ora´ns, F.J., Reglero,
G. & Nu´n˜ez, M.J. (2007). Supercritical fluid and solid-liquid
extraction of phenolic antioxidants from grape pomace: a comparative study. European Food Research and Technology, 226, 199–205.
Rodrigues, S. & Pinto, G.A.S. (2007). Ultrasound extraction of
phenolic compounds from coconut (Cocos nucifera) shell powder.
Journal of Food Engineering, 80, 869–872.
Sørensen, H.R., Meyer, A.S. & Pedersen, S. (2003). Enzymatic
hydrolysis of water-soluble wheat arabinoxylan. 1. Synergy between
a-L-arabinofuranosidases, endo-1,4-b-xylanases, and b-xylosidase
activities. Biotechnology and Bioengineering, 81, 726–731.
Sun, Y., Liu, D., Chen, J., Ye, X. & Yu, D. (2011). Effects of different
factors of ultrasound treatment on the extraction yield of the alltrans-b-carotene from citrus peels. Ultrasonics Sonochemistry, 18,
243–249.
Thaipong, K., Boonprakob, U., Crosby, K., Cisneros-Zevallos, L. &
Byrne, D.H. (2006). Comparison of ABTS, DPPH, FRAP, and
ORAC assays for estimating antioxidant activity from guava fruit
extracts. Journal of Food Composition and Analysis, 19, 669–675.
Vilkhu, K., Mawson, R., Simons, L. & Bates, D. (2008). Applications
and opportunities for ultrasound assisted extraction in the food
industry – A review. Innovative Food Science & Emerging Technologies, 9, 161–169.
Zanatta, C.F., Cuevas, E., Bobbio, F.O., Winterhalter, P. & Mercadante, A.Z. (2005). Determination of anthocyanins from camucamu (Myrciaria dubia) by HPLC-PDA, HPLC-MS, and NMR.
Journal of Agricultural and Food Chemistry, 53, 9531–9535.
Ó 2012 The Authors
International Journal of Food Science and Technology Ó 2012 Institute of Food Science and Technology
International Journal of Food Science and Technology 2012
9