Maximum willingness to pay and minimum compensation demand for natural forest protection in dinh hoa district, northern
Bạn đang xem bản rút gọn của tài liệu. Xem và tải ngay bản đầy đủ của tài liệu tại đây (7.1 MB, 185 trang )
MaximumWillingnesstoPayandMinimum
CompensationDemandforNaturalForest
ProtectioninDinhHoaDistrict,NorthernVietnam
Dissertation
withtheaimofachieving
adoctoraldegree
attheFacultyofMathematics,InformaticsandNaturalSciences
DepartmentofBiology
ofUniversitätHamburg
submittedby
ThiThanhHaNguyen
Hamburg,2015
Day of oral defense: 06.4.2016
The following evaluators recommended the admission of the dissertation:
Supervisor: Prof. Dr. Michael Köhl
Co-supervisor: Prof. Dr. Udo Mantau
Declaration
I hereby declare, on oath, that I have written the present dissertation by my own and have
not used other than the acknowledged resources and aids.
Hamburg, 03 December 2015
Thi Thanh Ha Nguyen
English review testimonial
I certify that the English of the dissertation
Maximum Willingness to Pay and Minimum Compensation Demand for Natural
Forest Protection in Dinh Hoa District, Northern Vietnam
written by Thi Thanh Ha Nguyen was reviewed and is correct.
The dissertation was reviewed by Susan J. Ortloff (US citizen), freelance translator and
editor.
Susan J. Ortloff
November 16, 2015
Acknowledgement
I would like to take this opportunity to express my deep gratitude to my supervisor, Prof.
Dr. Michael Köhl, for his valuable guidance, comments, encouragement, and hours of
discussion. My sincere gratitude goes to my co-supervisor, Prof. Dr. Udo Mantau, for his
support, guidance, and motivation. Without their incredible support and encouragement,
this work would never have been possible.
I am indebted to Dr. Joachim Krug for making my participation in this project possible and I
would like to thank for his kindly support for the field trip to Vietnam. I also thank Dr. JobstMichael Schröder and Dr. Benhard Kenter for supporting me in my academic courses, Dr.
Georg Becher for his statistic support, and Jutta Lax and Dr. Prem Neupane for their helpful
discussion and comments on my dissertation. Special thanks go to Mrs. Doris Wöbb and
Mrs. Sybille Wöbb for their unlimited help in administrative issues and their caring
assistance during my stay in Germany.
I would like to thank Assoc. Prof. Dr. Mau Dung Nguyen, Dr. Dang Thuy Truong, and Assoc.
Prof. Dr. Anh Tai Do for their discussion and technical support. I want to thank the leaders
of the communes and wards, the leaders of the villages, and the foresters who supported
me in conducting the study surveys in Vietnam. My thanks go to the interviewer team from
Thai Nguyen University of Agriculture and Forestry and Thai Nguyen University for
Economics and Business. I am very grateful for all my colleagues at the University of
Hamburg, Institute for World Forestry and the Industrial Economics Faculty at Thai Nguyen
University of Technology for their support. I want to thank Vietnam Ministry of Education
and Training (MOET), the German Academic Exchange Service (DAAD), and the Institute for
World Forestry, University of Hamburg for financial support.
Special thanks go to Susan J. Ortloff for the final English review.
Last but not least, my loving thanks go to my husband Van Tu Phan and my daughter Ha My
Phan for their patience, understanding, encouragement, and support during my study
abroad. My respect goes to my parents and parents-in-law for their support to my small
family in Vietnam.
Summary
Forests, like many other natural resources, provide a variety of ecosystem services such as
watershed, habitats for plants and animals, carbon sequestration, landscape beauty, which
are considered public goods. There is no cost to the public for these valuable ecosystem
services. Ecosystem services users are free to enjoy their benefits and ecosystem services
providers have no incentive to protect and maintain the continuous provision of ecosystem
services. The market fails to value natural resources properly, and thus affects the
sustainability of natural resources, particularly scarce resources. Contingent valuation
method uses willingness to pay and willingness to accept as economic tools to address the
market failures by providing financial incentives to sustain the provision of ecosystem
services.
Direct payments to households and individuals, which are contracted natural forests for
protection, have been implemented in Vietnam since 1998. However, the payment of VND
100,000 (US$ 4.8) per hectare per year is insufficient to fully compensate opportunity costs
of forest protection and management, and thus does not motivate the participation of the
local households. On the other hand, the Vietnamese government is limited in its payments
for natural forest protection by other competing priorities. Now is the time to involve the
voice and options of not only the individuals who depend on the forest for their livelihoods,
but also the general public in the forest management. A clear understanding of public
awareness and perception regarding natural forest protection and the diversification of
financial resources to support these protection programs are necessary to ensure the
sustainability of natural forest resources.
This study uses the contingent valuation method to evaluate the cost of natural forest
protection, assess livelihoods of forest dependent households, and identify public
perception regarding sustainable forest management in Vietnam. The study aims to
determine the level of willingness to accept compensation by the local rural households
that are contracted natural forests for protection, the willingness of local residents to pay
for the protected forests, and the factors that influence the willingness to protect forests in
a case study in Dinh Hoa district, Thai Nguyen province, northern Vietnam.
I
The results showed that rural households in Dinh Hoa district are poor and mainly rely on
agricultural activities for self-consumption, i.e., most agricultural and forest products are
used for subsistence purposes. Forest products such as fuelwood, timber, bamboo, and
palm tree products are important to local household; their contribution to the total
household income (21%) is significant. The acceptance of compensation level varies
between the households contracted different types of forest. On average, willingness to
accept is estimated to be VND 398,000 (US$ 19) per hectare per year, yielding a five-year
natural forest protection in Dinh Hoa project costs of VND 18.7 billion (US$ 891,162). The
estimated amount of compensation is nearly four times higher than the current payment
level of the government for forest protection. The area of forest land that households hold,
demographic characteristics (ethnic group), distance from homestead to the forest
boundary, and types of forest products collected are the major influencing factors to
willingness to accept.
The local residents are well aware of the importance of forests to their communities and
perceive that the protection of natural forests is an efficient way to improve the quality of
the environment. They are willing to pay VND 43,000 (US$ 2.1) per household as a onetime payment, which would raise a total fund of about VND 12.5 billion (US$ 593,810) for
natural forests protection at a district scale. The willingness to pay is influenced by the level
of payment, the public awareness of benefits provided by forests to communities, previous
visits to the forest, and household income.
The study proved that willingness to pay and willingness to accept can be used as a proxy
to identify economic incentives for local farmers to restore forest land and understand the
underlying factors that influence the willingness to protect forest. The payment level
estimated by this study is an empirical suggestion to amend the current payment policy to
meet the local households’ expectations and to encourage the involvement of the locals in
the forest management in the local context in the tropics. The findings of this study support
an increase in payment level for the provincial Forest Protection and Development Fund,
Payments for Forest Environmental Services, and the United Nations Program on Reducing
Emissions from Deforestation and Forest Degradation pilot projects which are currently
being conducted in Vietnam.
II
Table of contents
Summary.......................................................................................................................... I
Table of contents ........................................................................................................... III
List of tables .................................................................................................................. VII
List of figures.................................................................................................................. IX
List of appendices ........................................................................................................... X
List of abbreviations ....................................................................................................... XI
CHAPTER 1: INTRODUCTION .............................................................................................. 1
1.1. Statement of problem .............................................................................................. 1
1.2. Objectives ................................................................................................................ 4
1.3. Method .................................................................................................................... 5
1.4. Dissertation structure ............................................................................................... 5
CHAPTER 2: FOREST AND FOREST MANAGEMENT IN VIETNAM ......................................... 7
2.1. Country profile ......................................................................................................... 7
2.2. Forest resources ....................................................................................................... 8
2.2.1. Forest cover........................................................................................................... 8
2.2.2. Forest ecosystem................................................................................................. 10
2.2.3. Forest biodiversity ............................................................................................... 10
2.2.4. Timber and NTFPs harvesting, processing, and trade ........................................... 11
2.3. Forest management ............................................................................................... 12
2.3.1. State management of forest resources ................................................................ 12
2.3.2. Forest policy reform ............................................................................................ 13
2.3.2.1. Rehabilitation programs ................................................................................... 14
2.3.2.2. Sustainable management ................................................................................. 16
2.3.2.3. Forest land allocation ....................................................................................... 17
2.3.2.4. Benefit sharing policy ....................................................................................... 19
CHAPTER 3: LITERATURE REVIEW ..................................................................................... 21
3.1. Payments for ecosystem services ........................................................................... 21
3.1.1. The logic of payments for ecosystem services ...................................................... 21
III
3.1.2. PES definition ...................................................................................................... 22
3.1.3. PES in the tropics ................................................................................................. 23
3.1.4. PES in Vietnam .................................................................................................... 24
3.2. Economic valuation of forest ecosystem ................................................................. 29
3.2.1. Reasons for valuation .......................................................................................... 29
3.2.2. The nature of economic valuation ....................................................................... 29
3.3. Total economic value.............................................................................................. 30
3.4. Economic valuation techniques .............................................................................. 32
3.4.1. Market valuation ................................................................................................. 33
3.4.1.1. Market price method ........................................................................................ 33
3.4.1.2. Production function method ............................................................................. 34
3.4.2. Non-market valuation.......................................................................................... 34
3.4.2.1. Revealed preference method............................................................................ 34
3.4.2.2. Stated preference method ................................................................................ 36
3.5. Contingent valuation method ................................................................................. 38
3.5.1. Introduction ........................................................................................................ 38
3.5.2. Definition of contingent valuation method .......................................................... 39
3.5.3. Theoretical background of the contingent valuation method ............................... 39
3.5.3.1. Demand curve and willingness to pay ............................................................... 39
3.5.3.2. Hicksian welfare measures................................................................................ 41
3.5.3.3. Willingness to pay or willingness to accept ....................................................... 44
3.5.4. Contingent valuation surveys in developing countries.......................................... 45
CHAPTER 4: DATA AND METHODS................................................................................... 48
4.1. Study site ............................................................................................................... 48
4.1.1. Thai Nguyen province .......................................................................................... 48
4.1.2. Dinh Hoa district .................................................................................................. 49
4.2. Sample size............................................................................................................. 51
4.2.1. WTP survey ......................................................................................................... 52
4.2.2. WTA survey ......................................................................................................... 54
4.3. Data collection ....................................................................................................... 55
4.3.1. Survey methods................................................................................................... 55
4.3.2. Secondary data collection .................................................................................... 57
4.3.3. Focus group discussion ........................................................................................ 57
IV
4.3.3.1. WTP survey....................................................................................................... 57
4.3.3.2. WTA survey ...................................................................................................... 58
4.3.4. Pre-test ............................................................................................................... 59
4.4. Questionnaire design.............................................................................................. 60
4.4.1. Double-bounded dichotomous choice approach .................................................. 60
4.4.2. Questionnaire structure....................................................................................... 64
4.4.2.1. WTP survey....................................................................................................... 64
4.4.2.2. WTA survey ...................................................................................................... 66
4.5. Method .................................................................................................................. 67
4.5.1. WTP model .......................................................................................................... 67
4.5.1.1. Double-bounded logit model ............................................................................ 67
4.5.1.2. Model specification .......................................................................................... 69
4.5.1.3. Variables definition........................................................................................... 69
4.5.1.4. Mean and median WTP .................................................................................... 72
4.5.1.5. WTP aggregation .............................................................................................. 73
4.5.2. WTA model.......................................................................................................... 73
4.5.2.1. Double-bounded logit model ............................................................................ 73
4.5.2.2. Model specification .......................................................................................... 75
4.5.2.3. Variables definition........................................................................................... 75
4.5.2.4. Mean and median WTA .................................................................................... 78
4.5.2.5. WTA aggregation .............................................................................................. 79
4.5.3. Goodness of fit .................................................................................................... 79
CHAPTER 5: RESULTS ........................................................................................................ 81
5.1. WTP survey ............................................................................................................ 81
5.1.1. Response rate, protest and zero responses .......................................................... 81
5.1.2. Socio-economic characteristics of respondents .................................................... 82
5.1.3. Attitudes and preferences towards forest protection........................................... 86
5.1.4. Certainty of responses ......................................................................................... 91
5.1.5. Results of regression analysis............................................................................... 92
5.1.6. WTP curves.......................................................................................................... 96
5.1.7. Mean and median WTP ....................................................................................... 97
5.1.8. Total WTP for natural forest protection in Dinh Hoa ............................................ 98
5.2. WTA survey ............................................................................................................ 99
V
5.2.1. Response rate and protest responses .................................................................. 99
5.2.2. Demographic and socio-economic characteristics ................................................ 99
5.2.3. Forest situation and households´ perception towards forest protection ............ 104
5.2.4. Certainty of responses ....................................................................................... 107
5.2.5. Results of regression analysis............................................................................. 107
5.2.6. WTA curves ....................................................................................................... 112
5.2.7. Mean and median WTA ..................................................................................... 114
5.2.8. Costs of natural forest protection in Dinh Hoa ................................................... 115
CHAPTER 6: DISCUSSION ................................................................................................ 116
6.1. Perception and attitudes of local residents towards natural forest protection ...... 116
6.2. WTP and factors influence WTP ............................................................................ 117
6.3. Livelihoods of forest dependent households......................................................... 118
6.4. WTA and factors influence WTA ........................................................................... 119
6.5. Costs of natural forest protection ......................................................................... 120
6.6. Payment for forest protection and PFES ............................................................... 121
6.7. Payment for forest protection and REDD+ ............................................................ 122
6.8. Payment for forest protection and poverty alleviation .......................................... 123
6.9. Payment for forest protection and equity ............................................................. 124
6.10. Payment for forest protection and local involvement in decision making ............ 124
6.11. Conditional payment for forest protection .......................................................... 125
6.12. Payment for forest protection and capacity building and technical support ........ 126
CHAPTER 7: CONCLUSION .............................................................................................. 127
References .................................................................................................................. 130
Appendix..................................................................................................................... 141
Publication .................................................................................................................. 167
VI
List of tables
Table 1: Major national forest policies related to forest policy reform since 1991 ............. 14
Table 2: Forest land allocation, from VFPD (2012) ............................................................. 19
Table 3: Payment level for PFES, from Pham et al. (2013) and Vietnam Government (2010)
......................................................................................................................................... 26
Table 4: Welfare measures for an environmental gain and loss ......................................... 43
Table 5: Forest area in Dinh Hoa district, from FIPI (2010) ................................................. 51
Table 6: Distribution of sample in WTP survey................................................................... 53
Table 7: Distribution of sample in WTA survey .................................................................. 55
Table 8: Bid design – WTP survey ...................................................................................... 63
Table 9: Bid design – WTA survey ...................................................................................... 64
Table 10: Definition of the variables influencing WTP........................................................ 70
Table 11: Definition of the variables influencing WTA ....................................................... 76
Table 12: Reasons for zero responses ................................................................................ 82
Table 13: Demographic and socio-economic characteristics of respondents ...................... 83
Table 14: Average household income and expenditure ..................................................... 85
Table 15: Awareness of respondents towards Dinh Hoa forest situation ........................... 90
Table 16: Respondents´ perspective on Dinh Hoa forest protection (%)............................. 91
Table 17: Reasons for accepting to bids offered – WTP survey .......................................... 92
Table 18: Parameter estimate – Phu Binh and Dinh Hoa districts (Model 1)....................... 93
Table 19: Parameter estimate – Thai Nguyen city (Model 2).............................................. 94
Table 20: Parameter estimate – Total sample (Model 3) ................................................... 95
Table 21: Proportion of acceptance to the first and the second bid offered (WTP) ............ 96
Table 22: Mean and median WTP...................................................................................... 98
Table 23: Demographic and socio-economic characteristics of forest contracted households
....................................................................................................................................... 100
Table 24: Forest products collected................................................................................. 101
Table 25: Main cultivated crops ...................................................................................... 102
Table 26: Number of domestic livestock .......................................................................... 102
Table 27: Household incomes, separated by forest types ................................................ 103
Table 28: Appraisal of changes of forest related issues (%) .............................................. 106
Table 29: Forest contracted households´perspective on Dinh Hoa forest protection (%) . 107
VII
Table 30: Reasons for accepting the bids offered – WTA survey ...................................... 107
Table 31: Parameter estimates – Special-use forest (Model 4) ........................................ 108
Table 32: Parameter estimates – Protection forest (Model 5).......................................... 109
Table 33: Parameter estimates – Production forest (Model 6) ......................................... 110
Table 34: Parameter estimates – Total sample WTA (Model 7) ........................................ 111
Table 35: Proportion of acceptance to the first and second bid offered (WTA) ................ 112
Table 36: Mean and median WTA ................................................................................... 114
VIII
List of figures
Figure 1: Map of Vietnam, adapted from FAO (2010) .......................................................... 7
Figure 2: Forest cover, adapted from FAO (2010) ................................................................ 9
Figure 3: Land cover map, from Qeiroz et al. (2013) .......................................................... 10
Figure 4: The logic of PES; adapted from Engel et al. (2008) and Pagiola and Platais (2007) 22
Figure 5: Total Economic Value framework, adapted from Mourato (2014) and Pagiola et al.
(2004) ............................................................................................................................... 31
Figure 6: Economic valuation methods, adapted from Atkinson et al. (2012) and Garrod and
Willis (1999) ...................................................................................................................... 33
Figure 7: Demand and willingness to pay, adapted from Bateman (2004) .......................... 40
Figure 8: Indifference curves and the budget constraint, from Sloman (2009) ................... 41
Figure 9: Measure of change in human welfare, adapted from Bateman et al. (2002)........ 42
Figure 10: Map of forest types in Dinh Hoa district, adapted from FIPI (2010) ................... 50
Figure 11: Sample site of WTP survey ................................................................................ 53
Figure 12: Sample site of WTA survey................................................................................ 54
Figure 13: Double-bounded dichotomous format - WTP .................................................... 62
Figure 14: Double-bounded dichotomous format - WTA ................................................... 63
Figure 15: Distribution of household income and expenditure by selected income class.... 84
Figure 16: Ranking of general issues .................................................................................. 87
Figure 17: Ranking of important environmental issues ...................................................... 88
Figure 18: Ranking of forest functions ............................................................................... 89
Figure 19: Probability of WTP the bids offered .................................................................. 97
Figure 20: Distribution of household incomes ................................................................. 103
Figure 21: Three most important roles of forests to the communities in Dinh Hoa .......... 105
Figure 22: Probability of WTA the bids offered ................................................................ 113
Figure 23: Total value WTA and WTP ............................................................................... 121
IX
List of appendices
Appendix 1: Important products and economic value of several priority species, from
Luoma-aho (2004) ........................................................................................................... 141
Appendix 2: Dinh Hoa forest allocation, from ATKFMB (2013) ......................................... 142
Appendix 3: Structure of WTP focus group discussion ..................................................... 143
Appendix 4: Structure of WTA focus group discussion ..................................................... 144
Appendix 5: Questionnaire – WTP survey ........................................................................ 145
Appendix 6: Questionnaire – WTA survey........................................................................ 153
Appendix 7: Percentage of saying “Yes/Yes”, “Yes/No”, “No/Yes”, “No/No” - WTP survey
....................................................................................................................................... 166
Appendix 8: Percentage of saying “Yes/Yes”, “Yes/No”, “No/Yes”, “No/No” - WTA survey
....................................................................................................................................... 166
X
List of abbreviations
5MHRP
5 Million Hectares Reforestation Program
AB
Averting Behavior
ASEAN
Association of Southeast Asian Nations
ATKFMB
ATK Dinh Hoa Forest Management Board
CAC
Command-and-Control
CBA
Cost-Benefit Analysis
CBFM
Community Based Forest Management
CEPF
Critical Ecosystem Partnership Fund
CF
Community Forestry
CIA
Central Intelligence Agency
CIFOR
Center for International Forestry Research
CM
Choice Modeling
CONAFOR
National Forestry Commission
CV
Compensation Variation
CVM
Contingent Valuation Method
DBDC
Double-Bounded Dichotomous Choice
DC
Dichotomous Choice
EEPSEA
Economy and Environment Program for Southeast Asia
ES
Ecosystem Services
EV
Equivalent Variation
FAO
Food and Agriculture Organization of the United Nations
FCPF
Forest Carbon Partnership Facility
FIPI
Forest Inventory and Planning Institute
FLA
Forest Land Allocation
FMB
Forest Management Board
FONAFIFO
National Forest Financing Fund
FPDF
Provincial Forest Protection and Development Fund
GDP
Gross Domestic Product
GIZ
German Agency for International Cooperation
GSO
General Statistics Office of Vietnam
ha
Hectare
XI
HP
Hedonic Pricing
ICO
International Coffee Organization
IPC
International Pepper Community
ITC
International Trade Center
IUCN
International Union for Conservation of Nature
kg
Kilogram
km
Kilometer
MARD
Ministry of Agriculture and Rural Development
MA
Millennium Ecosystem Assessment
MOF
Ministry of Finance
MONRE
Ministry of Natural Resources and Environment
MP
Market Price
NGO
Non-Governmental Organization
NOAA
National Oceanic and Atmospheric Administration (US)
NTFPs
Non-Timber Forest Products
PES
Payments for Ecosystem Services
PF
Production Function
PFES
Payments for Forest Environmental Services
PPP
Purchasing Power Parity
Ramsar
The Ramsar Convention on Wetlands
REDD
Reducing Emissions from Deforestation and Forest Degradation
REDD+
Reducing Emissions from Deforestation and Forest Degradation and the role
of conservation, sustainable management of forests and enhancement of
forest carbon stocks in developing countries
RP
Revealed Preference
R-PIN
Readiness Plan Idea Note
SBDC
Single-Bounded Dichotomous Choice
SFEs
State Forest Enterprises
SP
Stated Preference
TC
Travel Cost
TEV
Total Economic Value
TSO
Thai Nguyen Statistics Office
UN
United Nations
XII
UNEP
United Nations Environmental Program
UNESCO
United Nations Educational, Scientific and Cultural Organization
UNFCCC
United Nations Framework Convention on Climate Change
UNFPA
United Nations Population Fund
UN-REDD
United Nations Program on Reducing Emissions from Deforestation and
Forest Degradation
US$
United States Dollar
VFPD
Vietnam Forest Protection Department
VND
Vietnam Dong
VNFF
Vietnam Forest Protection and Development Fund
WB
World Bank
WTA
Willingness To Accept
WTP
Willingness To Pay
XIII
1Introduction
CHAPTER 1: INTRODUCTION
1.1. Statement of problem
Forests, like many other natural resources, provide a variety of ecosystem services (ES) such
as watershed, habitats for plants and animals, carbon sequestration, landscape beauty,
which are considered public goods. There is no cost to the public for these valuable ES. ES
users are free to enjoy their benefits and ES providers have no incentive to protect and
maintain the continuous provision of ES. The market fails to value natural resources
properly, and thus affects the sustainability of natural resources, particularly scarce
resources.
Although the rate of deforestation slightly decreased in the 2000s compared to the 1990s,
it is still alarming in many countries, especially in tropical regions where the loss of forest is
the highest (Barbier, 2007; FAO, 2010). Urbanization, agricultural activities, logging, mining,
and fires are judged the direct causes of deforestation (UNCCC, 2007). Subsistence and
commercial agriculture are estimated to be the proximate drivers for approximately 80% of
deforestation worldwide (Kissinger et al., 2012). Effects of tropical deforestation on climate
change, biodiversity conservation, and environment have been a serious global concern
since the early 1990s. It is widely accepted that decreasing tropical deforestation is the key
and most cost effective way to fight against global warming.
Setting up protected areas such as national parks and reserves has been widely practiced in
order to combat tropical deforestation and biodiversity loss since the 1990s. The area of
forest where biodiversity conservation is designated as its primary function has increased
by more than 95 million hectares (ha) since 1990 to 2010 (FAO, 2010). The increasing trend
of the expansion of protected areas and ever growing demands for scarce land for
subsistence agriculture to meet the requirements of food commodities and forest products
for escalating populations and for commercial agriculture resulted in major conflicts in
several parts of the world. In many areas, the livelihoods of the local and indigenous
communities in the vicinity of the protected areas have been seriously affected (MA, 2005).
1
1Introduction
In order to balance individual well-being and habitat preservation and encourage the
involvement of local people in protecting natural resources, Ferraro (2001) suggested direct
payment as an effective way to compensate the cost of resource maintenance. The
protection of natural forests will be effective if the compensated amount exceeds the costs
of the natural forest protection incurred by the individuals or individual households (Engel
et al., 2008; Pagiola et al., 2003). In other words, the payment, at minimum, should equal
the opportunity costs of natural forest management. Payments for ecosystem services (also
known as payments for environmental services or PES) are emerging as economic tools to
provide income for landowners or farmers for management, conservation, protection, and
restoration of natural resources (UNEP, 2008). These schemes provide incentives to
improve environmental management and the livelihoods of landowners by rewarding
people´s efforts of remaining and providing ES.
The dependency of the local and indigenous communities on forest resources for their
livelihoods in developing countries has motivated policy makers to decentralize forest
management to participating local communities (Pokharel et al., 2015). Community Based
Forest Management (CBFM) systems are becoming popular in developing countries
(Maraseni et al., 2014), however, the modalities of the CBFM differ from country to
country. At least 22% of the total forest area is legally managed by the communities
throughout the world (Nurse and Malla, 2005) and ownership and management of forests
by communities, individuals, and private companies is on the rise (FAO, 2010). Community
Forestry (CF), Forest Land Allocation (FLA) for reforestation purpose, and (natural) forest
contracting to individuals and households for protection purpose are the major modalities
of the CBFM widely practiced in Vietnam. In recent decades, the forest and forest land
management schemes have been considerably successful and have been efficient in
ensuring active involvement of forest user groups, individuals, and individual households
from decision making to implementation of the schemes.
Located in Southeastern Asia, in 1943 Vietnam had a forest area of over 14 million ha, with
a forest cover of 43% (Collins et al., 1991). Due to the excessive reliance on slash-and-burn
agriculture, agriculture land expansion, logging whether legal or illegal, and non-timber
forest products (NTFPs) collection for subsistence needs, forest area declined from 55% in
the 1960s to 17% in the late 1980s. The massive deforestation in Vietnam was even judged
to be the most rapid among Southeast Asian countries (Collins et al., 1991; Koninck, 1999).
In an attempt to restore forest cover, reforestation programs such as “Program 327” and
2
1Introduction
“Five Million Hectares Reforestation Program” (5MHRP, also known as Program 661) were
launched in the 1990s to improve environmental services, promote the role of the forest
sector in overall economic growth, and secure the livelihoods of the most vulnerable
groups (Sikor, 1998). In Vietnam, forest land belongs to the state. Since the 1990s, the right
to use barren land and planted forests was transferred to rural households and individuals
to manage and protect, while the natural forest was under the management of State Forest
Enterprises (SFEs) and Forest Management Boards (FMBs). The surrounding villages and
households were also allocated natural forests for protection in terms of contract and
regularly paid by the government (Sikor, 1998). The use-rights and obligations of
households vary depending which forest type they are contracted1.
During the period from 1998 to 2006, the payment for natural forest protection was VND
50,000/ha/year (US$ 2.4)2. Although since 2007 the amount of payment increased to VND
100,000/ha/year (US$ 4.8), it is too low in terms of labor cost, and did not adequately
compensate forgone alternative uses. The payment is equal to 1-2% of rural household
incomes (Wunder, 2005a) and not attractive enough for the people to participate in the
protection program in the long term.
The weak management system and the non-corporation of the local stakeholders are the
main causes of deforestation and forest depletion in Vietnam. There is little evidence of
administrative penalties or ownership withdraws for non-compliance with the forest
protection contract (Wunder, 2005a). The lack of adequate and justifiable payment and
unclear use rights might discourage the individuals and individual households to follow the
contract for the long term. Meanwhile, conversion of the natural forests into monoculture
plantations and to agricultural crop cultivation has been noticed in several places of
northern Vietnam.
On the other hand, the Vietnamese government is limited in its payments for natural forest
protection by other competing priorities. A clear understanding of public awareness and
perception regarding natural forest protection and the diversification of financial resources
1
Law on forest protection and development 2004 classified forest into three types: production,
protection, and special-use (Vietnam National Assembly, 2004)
2
US$ 1 ≈ VND 21,000
3
1Introduction
to support these protection programs are necessary to ensure the sustainability of natural
forest resources.
The major questions are: how much the government should pay for forest protection to
meet the local households’ expectations; are individuals who benefit from the forest aware
of the important role of forest´s ES and are they willing to pay for forest protection? Now is
the time to involve the voice and options of not only the individuals who depend on the
forest for their livelihoods, but also the general public in the forest management.
1.2. Objectives
The dissertation aims to evaluate the cost of natural forest protection in a case study
carried out in Dinh Hoa district, northern Vietnam to provide possible suggestions for
developing appropriate payment policy to encourage people to protect the natural forest in
a local context.
The dissertation has the following objectives:
1) To assess the awareness and perception of residents in Thai Nguyen province
towards natural forest protection;
2) To estimate the maximum willingness to pay (WTP) of residents in Thai Nguyen
province for natural forest protection in Dinh Hoa district;
3) To identify the differences of payment levels between urban and rural residents;
4) To assess the livelihoods of rural households which are contracted and allocated
natural forests for protection;
5) To estimate the minimum willingness to accept (WTA) compensation of rural
households which are contracted and allocated natural forests for protection;
6)
To identify the differences of payment levels expected by the households which
are contracted and allocated different types of forests (special-use, protection and
production forests);
7) To determine the factors that influence of the WTA and WTP for forest protection;
and
8) To evaluate the cost needed for protecting Dinh Hoa forest.
4
1Introduction
1.3. Method
The contingent valuation method (CVM) has become the main tool used in cost-benefit
appraisals and environmental impact assessments in environmental economics (Bateman et
al., 2002; Mitchell and Carson, 1989; Pearce et al., 2006) in both developed (Pearce et al.,
2006) and developing countries (Pearce et al., 2002). Established as a preference technique,
contingent valuation is a survey or questionnaire–based approach to obtain the monetary
valuation assignment on non-market goods and services under hypothetical markets
described in the survey scenario. In developing countries, CVM is commonly applied in
areas such as water supply and sanitation, recreation, tourism, national park management,
and biodiversity conservation (Whittington, 1998). Whittington (2010) reports hundreds of
stated preference studies successfully conducted in developing countries over the past two
decades.
In this study, we performed two contingent valuation surveys: WTP and WTA survey, using
a double-bounded dichotomous format, to debrief the local WTP and WTA the
compensation for natural forest protection. A logit model was used to estimate the
parameters of explanatory variables.
1.4. Dissertation structure
This dissertation consists of seven chapters.
Chapter 1 describes the statement of problem, the aims, and the structure of dissertation.
Chapter 2 introduces the local context of the study. The chapter summarizes the socioeconomic characteristics of Vietnam and describes forest resources and forest
management. In this chapter, the forest policy reform is mentioned, including the context
of policy reform, forest rehabilitation programs, sustainable forest management, process of
FLA, and the benefit sharing policy.
Chapter 3 provides the literature review of economic evaluation of forest ecosystem and
application of CVM in environmental economics. This chapter analyses the rationale of
payments for forest environmental services, explains the reasons for economic valuation,
and provides economic valuation techniques including market and non-market valuation.
The chapter then describes the CVM and its application in the environmental researches in
5
1Introduction
developing countries. The limitation of applying CVM in developing countries is carefully
discussed.
Chapter 4 expresses the study design, data collection, and the methods. First, the chapter
describes the characteristic and the rationale of choosing study sites. Second, the chapter
interprets the steps and methods of collecting data. The survey methods and questionnaire
design are thoroughly discussed. Third, the chapter explains the double-bounded logit
models and defines the explanatory variables. Finally, the chapter interprets the parameter
estimation of the mean and median values of WTP and WTA, and the method of
aggregation of WTP and WTA.
Chapter 5 reports the results of the study. This chapter is divided into two parts: part one
describes the results of WTP survey and part two reports on the WTA survey. Both parts
provide the socio-economic characteristics of respondents, the attitudes and preferences
towards forest protection, and the regression results. In the section covering regression
results, the impacts of explanatory variables and the fit of models are described. The
chapter presents the estimated mean and median values and the aggregation of WTP and
WTA.
Chapter 6 discusses the findings of the study. This chapter discusses perception and
attitudes of the local residents towards natural forest protection, the levels of WTP, and the
factors influencing their WTP. The livelihoods of rural households which are contracted the
allocated natural forest land for protection, their WTA compensation for natural forest
protection, and the factors influencing their WTA are explained. The chapter discusses the
findings in supporting the payment policy related to Payments for Forest Environmental
Services (PFES), Reducing Emissions from Deforestation and Forest Degradation (REDD),
poverty alleviation, equity, local involvement in decision-making, conditional payment,
capacity building, and technical support.
Chapter 7 concludes the empirical findings of the study and possible implication of
contingent valuation approach as an economic tool to provide incentives to the willingness
to protect forests.
6
2ForestandforestmanagementinVietnam
CHAPTER 2: FOREST AND FOREST MANAGEMENT IN
VIETNAM
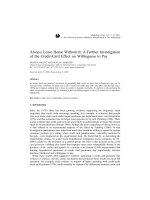
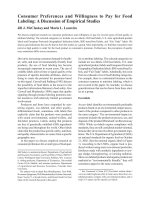
2.1. Country profile
Vietnam covers an area of approximately 33
million ha, including about 31 million ha of
land area and about 2 million ha of inland
water area (FAO, 2010). The S-shaped
country extends from 23030´N to 8030´N for
more than 1,650 kilometers (km). Vietnam
borders the Gulf of Thailand, Gulf of Tokin,
as well as China, Laos, and Cambodia, and
has a coastline of 3,444 km (MONRE, 2008).
Hilly and mountainous areas account for
three quarters of the country. The lowland
areas are influenced by two major river
deltas: the Red River in the north and the
Mekong River in the south.
The climate system combines tropical
Figure 1: Map of Vietnam, adapted from FAO
(2010)
conditions in the south and monsoon
seasons in the north (Collins et al., 1991;
MONRE, 2008). There are two monsoon seasons: the north-easterly monsoon with a warm,
dry season from October to March, and the south-westerly monsoons with a hot, rainy
season from May to September. Annual average rainfall ranges from 1,300 mm to 3,200
mm (MARD, MOF & MONRE, 2003).
Vietnam has 64 provinces belonging to 8 regions, of which the Red River Delta in the north
and the Mekong River Delta in the south are the most populous. 68% of the total
population of 89 million people are rural (GSO, 2012). “Kinh” is the largest Vietnamese 10
7