Volume 2 wind energy 2 20 – wind power industry and markets
Bạn đang xem bản rút gọn của tài liệu. Xem và tải ngay bản đầy đủ của tài liệu tại đây (385.83 KB, 13 trang )
2.20
Wind Power Industry and Markets
PE Morthorst, Technical University of Denmark, Roskilde, Denmark
© 2012 Elsevier Ltd.
2.20.1
2.20.2
2.20.3
2.20.4
2.20.4.1
2.20.4.2
2.20.4.3
2.20.5
2.20.5.1
2.20.6
2.20.6.1
2.20.7
2.20.8
References
Global Market Development
Trends in the Development of Wind Turbines
Main Drivers behind the Wind Power Development
Market Development in Europe
Germany
Spain
Rest of Europe
Development of Wind Power in North America
United States
Wind Power Development in Asia
China
Offshore Wind Power Development
Wind Turbine Manufacturers
657
659
660
662
662
663
664
665
665
666
666
666
667
669
2.20.1 Global Market Development
Within the last 15–20 years, wind power has on a global scale developed incredibly fast. In 1990, total installed capacity of wind
power in the world amounted to approximately 2 GW – by the end of 2009, this capacity has increased to 158 GW equaling an
annual growth rate of almost 25%. Although, on a global scale wind power accounts for only approximately 2% of total electricity
supply, this small fraction is increasing rapidly.
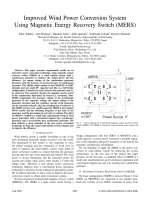
As shown in Figure 1, wind power has experienced a fairly steady but continued rapid capacity development (left part). The right
part of Figure 1 shows the capacity development in the early years, from 1983 to 1995, and already from the late 1980s a strong
development is taking place.
The growth in installed global wind power capacity is shown in Figure 2. Except for 1 year, 2004, the annual absolute growth has
increased for every year. For quite an impressive time period, the annual percentage growth rates have exceeded 30%. In 2008, the
growth equaled almost 29%, and in 2009, it was 31%, despite a financial crisis.
On a global scale, the three main regions regarding wind power development are Europe, North America, and Asia, comprising
approximately 97.2% of total installed capacity. The rest of the world only has smaller amounts of wind power installed, that is,
Latin America has 0.8% of world capacity, the Pacific has 1.4%, and finally, Africa and Middle East has 0.5%.
For a long period, Europe was dominating the wind power scene. At the beginning of the century, Germany and Spain
were unrivaled in wind power expansion, but in recent years countries outside Europe have moved fast. This applies
especially for the United States and China, where the latter in just a few years ranks third in terms of installed wind
power capacity.
This becomes clear from Figure 3, where wind power installed in Asia in 2009 amounted to 14.6 GW, significantly above North
America with 10.9 GW and Europe with 10.5 GW installed wind power capacity. Thus, the European share has decreased strongly
from 67% of total world installed capacity in 2003 to 28% in 2009. However, with regard to cumulative installed capacity, Europe is
still in the lead with a little more than 48% of total installed wind turbine capacity, while approximately 24% was installed in North
America and approximately 25% in Asia [1].
Figure 4 shows the top 10 countries’ distribution of the global installed wind power capacity by end 2009. Four countries, the
United States, Germany, China, and Spain, are dominant covering approximately two-thirds of the cumulative installed capacity
worldwide. Following these four, we find a large group of countries with smaller contributions, although some of them are
developing quite fast.
Observe that all top 10 countries are from the above-mentioned three major regions (the most important countries will
be treated in more detail in the following sections). The other regions of the world – Latin America, the Pacific, and Africa
and Middle East – have not yet entered the ‘take off’ stage. In Latin America, Brazil, Mexico, and Chile have done well within
the last couple of years, while other countries only contribute irregularly. In Africa, mainly the North African countries like
Egypt and Morocco are in a steady growth. Finally, in the Pacific region, both Australia and New Zealand have experienced
growth in 2009 (400 and 170 MW installed capacity, respectively); however, the development in recent years has not been
stable.
Comprehensive Renewable Energy, Volume 2
doi:10.1016/B978-0-08-087872-0.00223-7
657
658
Wind Power Industry and Markets
Cumulative capacity
The first years
6000
180
160
140
120
100
80
60
40
20
0
5000
MW
4000
1000
95
94
19
93
19
92
19
91
19
90
19
89
19
88
19
87
19
86
19
85
Year
19
84
19
83
19
19
8
19 7
89
19
91
19
93
19
9
19 5
97
19
99
20
01
20
03
20
05
20
07
20
09
19
85
0
19
19
3000
2000
83
GW
Cumulative capacity
Year
Figure 1 Development of the global wind power market. (Left) Cumulative installed capacity. (Right) Highlight of the cumulative capacity development
1983–95. Source: GWEC (2010) [1]; BTM consult ApS – A part of NAVIGANT (2010) World Market Update 2009, March [2].
Annual percentage growth
60
Annual growth
40
% annual increase
50
35
30
GW
25
20
15
10
40
30
20
10
5
99
20
01
20
03
20
05
20
07
20
09
97
19
95
19
93
19
91
19
89
19
87
19
85
19
19
83
19
19
9
19 2
9
19 3
9
19 4
9
19 5
9
19 6
9
19 7
9
19 8
9
20 9
0
20 0
0
20 1
0
20 2
0
20 3
0
20 4
0
20 5
0
20 6
0
20 7
0
20 8
09
0
0
Year
Year
Figure 2 Growth in global annual installed wind power capacity. (Left) Absolute annual growth. (Right) Percentage annual growth. Source: GWEC
(2010) [1].
16
GW per year
14
12
2003
10
2004
2005
8
2006
6
2007
4
2008
2
2009
0
Europe
North America
Asia
Figure 3 Annual installed wind power capacity in the three main regions: Europe, North America, and Asia. Source: GWEC (2010)
[1].
Wind Power Industry and Markets
Portugal
2%
Residual
14%
Denmark
2%
659
US
22%
UK
3%
France
3%
Italy
3%
Germany
16%
India
7%
China
16%
Spain
12%
Figure 4 Top 10 countries’ distribution of global installed capacity. Source: GWEC (2010) [1].
2.20.2 Trends in the Development of Wind Turbines
In general, three major trends have dominated the development of grid-connected wind turbines in recent years:
1. The turbines have grown larger and taller – thus the average size of turbines sold at the market place has increased substantially.
2. The efficiency of the turbines’ production has increased steadily.
3. In general, the investment costs per kilowatt have decreased, although recent years have shown a discrepancy from this trend.
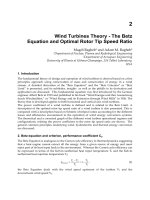
Figure 5 shows the development of the average size of wind turbines sold each year for a number of the most important wind power
countries. As illustrated in Figure 5, the annual average size has increased significantly within the last 10–15 years, from
approximately 200 kW in 1990 to more than 2 MW in the United Kingdom and Denmark in 2008, with Germany, Spain, and
the United States lagging only a little behind. But as shown, there is quite a difference between some of the countries. In India
and China, the average installed size in 2008 was approximately 1 MW, significantly below the level of the United Kingdom and
Denmark of 2256 and 2277 kW, respectively. The unstable picture for Denmark in recent years mainly reflects a fairly small number
of new turbines being installed and in some years being dominated by offshore installations.
In 2008, turbines of the megawatt-class (i.e., above 1 MW) had a market share of more than 95%, leaving less than 5% for the
smaller machines. Within the MW-segment turbines with capacities of 2.5 MW and up are getting increasingly important, even for
on-land sitings. These large turbines had a share of 6% of the market in 2008, compared to only 0.3% at the end of 2003.
The wind regime at the chosen site, the hub height of the turbines, and the efficiency of production mainly determine power
production from the turbines. Thus, increasing the height of the turbines has by itself yielded a higher power production. Similarly,
the methods for measuring and evaluating the wind speed at a given site have improved substantially in recent years and thus
improved the siting of new turbines. In spite of this, the fast development of wind power capacity in countries such as Germany and
Denmark implies that most of the good wind sites by now are taken and, therefore, new on-land turbine capacity has to be erected at
sites with a marginally lower average wind speed. To this though should be added that the replacement of older and smaller turbines
with new ones is getting increasingly important, especially in countries that have taken part in the wind power development for a
long time as is the case for Germany and Denmark.
2500
2000
Germany
Spain
kW
1500
UK
Denmark
1000
India
500
USA
China
08
20
06
04
20
02
20
00
20
98
20
96
19
94
19
19
92
19
19
90
0
Figure 5 Development of the average wind turbine size sold in different countries. Source: BTM consult ApS – A part of NAVIGANT (2009) World Market
Update 2008, March [3].
Wind Power Industry and Markets
1400
1200
700
150 kW
225 kW
300 kW
2000 kW 600
2000 kW
500 kW 1000 kW
600 kW 1000 kW
1000
500
400
/kW
800
600
300
400
200
200
100
per swept rotor area
660
Price of turbine per kW
Other costs per kW
Total cost per swept m2
0
06
09
20
01
97
95
04
20
20
20
19
91
93
19
19
19
19
89
0
Year of installation
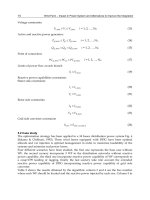
Figure 6 The development of investment costs exemplified by the case of Denmark for the time period from 1989 to 2009. Right axis: Investment costs
divided by swept rotor area (€ m−2 in constant 2009 €). Left axis: Wind turbine costs and other costs per kW rated power (€ kW−1 in constant 2009 €).
The development of electricity production efficiency owing to better equipment design measured as annual energy production
per swept rotor area (kWh m−2) at a specific reference site has correspondingly improved significantly over recent years. Taking into
account all the three mentioned issues of improved equipment efficiency, improved turbine siting, and higher hub height, the
overall efficiency has increased by more than 2% annually over the last 15 years.
Figure 6 shows how investment costs have developed over the years, exemplified by the case of Denmark for the time period
from 1987 to 2009. The data reflect turbines installed in the particular year shown (all costs are converted to 2009 prices) and all
costs at the right axis are calculated per swept rotor area, while those at the left axis are calculated per kilowatt of rated capacity.
The number of square meters the rotor of the turbine is covering – swept rotor area – is a good proxy for the turbines’ power
production and therefore this measure is a relevant index for the development in costs per kWh. As shown in the figure, there has
been a substantial decline in costs per unit swept rotor area in the considered period except from 2006 to 2009. Thus, from the late
1990s until 2004, the overall investments per unit swept rotor area have declined by more than 2% per annum during the period
analyzed, corresponding to a total reduction in cost of almost 30% over these 15 years. But this trend was broken in 2006 where
total investment costs rose by approximately 20% compared to 2004, mainly induced by a strong increase in demand for wind
turbines combined with severe supply constraints [4].
Looking at the cost per rated capacity (per kW), the same decline is found in the period 1989 to 2004 with the 1000 kW machine
in 2001 as the exception. The reason has to be found in the dimensioning of this specific turbine. With higher hub heights and larger
rotor diameters, the turbine is equipped with a relatively smaller generator although it produces more electricity. This is particularly
important to be aware of when analyzing turbines constructed to be used in low and medium wind areas, where the rotor diameter
is dimensioned to be considerably larger compared to the rated capacity. As shown in Figure 6, the cost per kW installed also rose by
20% in 2006 compared to 2004, while the cost almost remained constant from 2006 to 2009. At the beginning of 2010, it seems
that the cost has declined slightly compared to 2009; however, at present this cannot be documented by sampled data [5].
Also, the share of other costs as a percentage of total costs has in general decreased. In 1989, almost 29% of total investment costs
were related to costs other than the turbine itself. By 1997, this share had declined to approximately 20%. The trend toward lower
auxiliary costs continues for the last vintage of turbines shown (2000 kW), where other costs amount to approximately 18% of total
costs. But from 2004 to 2006, other costs rose almost in parallel with the cost of the turbine itself and have stayed at this level in 2009.
2.20.3 Main Drivers behind the Wind Power Development
The reasons for the global success of wind power are many fold. Seen from a governmental viewpoint, some of the benefits are as
follows [6]:
• Improved security of energy supply
• Enhanced competitive edge in the renewable energies technology industries
Wind Power Industry and Markets
661
Denmark
Lithuania
Latvia
Sweden
Finland
Estonia
United Kingdom
Spain
Slovenia
Slovak
Romania
Portugal
Poland
Netherlands
Malta
Luxembourg
Italy
Ireland
Hungary
Greece
Germany
France
Czech Republic
Cyprus
Bulgaria
Belgium
Austria
0%
10%
20%
30%
Share 2005
Target 2020
40%
50%
Figure 7 National renewable energy targets as % of final energy consumption.
• Mitigation of greenhouse gas emissions by power sector
• Mitigation of regional and local pollutant emissions
• Improved economic and social prospects especially for rural and isolated areas.
Thus, as part of their energy policy, a number of countries have established long-term targets for renewables, and thus implicitly for
wind power as part of the renewable portfolio. As an example, European Union (EU) has set the mandatory target for renewable
energy sources that by 2020 20% of final energy demand in EU has to be supplied by renewable technologies as hydro power, wind
power, solar, and biomass. This EU renewable target has to be implemented mainly by national initiatives (the European Trading
System for CO2 allowances will be part of the regulatory framework) and is distributed on member states as shown in Figure 7.
The mandates for the share of renewable sources by 2020 vary significantly for the individual member states from an increase of
13% to a total of 30% for Denmark to an increase of only 6.9% to a total of 13% for the Czech Republic.
However, only at sites with relatively high wind speeds, wind turbines are at present economically competitive to
conventional power production on purely economic grounds. Figure 8 shows the costs of wind power production in
80
70
/MWh
60
50
40
Regulation costs
30
CO2 - 15 /t
Basic
20
10
0
Coal
Natural
gas
Wind Power Wind Power
-coastal site -inland site
Figure 8 The production costs of wind power compared to conventional power plants.
662
Wind Power Industry and Markets
comparison with costs of conventional power plants based on coal or natural gas. The analysis is performed on fuel prices
from the international markets and a crude oil price of 59 $ bbl−1 in 2010 (constant terms) is assumed. The price of natural
gas is assumed to follow the crude oil price. The price of CO2 is assumed to be 15 € t−1 as observed by 2010 and basically
covers the cost of fuels, operation and maintenance, and leveling of investment costs. It is based on cost from IEA [7] and
assumptions from OECD/IEA [8]). As shown, the costs of power production based on coal or natural gas are significantly
lower than the costs of wind power production independent of site.
Thus, to attract investors wind power is dependent on economic support from national support schemes based on feed-in tariffs,
green certificates (alternative to the renewable portfolio standard (RPS) in the United States or ROCs in the United Kingdom) or
investment subsidies. Most countries apply support schemes especially designed for their own and specific purposes. In EU, feed-in
tariffs have been highly effective in the deployment of wind power in Germany, Spain, and Denmark. According to the EU
Commission [4], the most effective scheme in general is the feed-in tariff that has the lowest risk as perceived by investors. In the
United States, the production tax credit (PTC) and the Renewable Portfolio Standard (RPS) have proved to be efficient in
the deployment of wind power. Nevertheless, the effectiveness of the support system depends heavily on the specific design of
the scheme. Thus, other schemes might prove to be effective in particular cases, for example, tendering in the development of
offshore wind farms.
2.20.4 Market Development in Europe
Right from the start of the wind power revival, European countries have done well, and by the end of 2009, total installed
capacity amounted to 76 GW. During the 1990s there was a strong growth in Europe peaking with annual growth rates of
cumulative capacity of 40–50% at the late 1990s (see Figure 9). However, although the absolute growth persistently is kept
at a high level, the annual growth rates have declined severely, leveling off at a little more than 15% of annual growth in
cumulative capacity.
This development is mainly the consequence of European policies. Thus, at present the development is dominated by a few
countries, especially Germany and Spain; however, quite a number of new countries are entering the wind power scene. This applies
especially for Italy, France, and the United Kingdom, which all are experiencing rapid expansions.
Quite a number of different instruments are presently used in the Member States in supporting the development of renewable
energy sources. Quota obligations with tradable green certificates, feed-in tariffs, tender procedures, and tax measures are the most
discussed schemes, dominating the national support systems at the moment. At present, most support schemes are based on a
national entity and trade across the borders explicitly of green power is limited.
In the following the development of wind power in the most important European countries will be described.
2.20.4.1
Germany
By the end of 2009 wind power in Germany covered approximately 9% of the country’s power consumption and accounted for
approximately 34% of total installed wind power capacity in Europe making Germany the number one country in this area.
However, the dominance of Germany is weakening. The German share of new annual installed capacity in Europe has gradually
fallen from 48% in 1999 to 18% in 2009. The development of annual installed capacity in Germany is shown in Figure 10.
Together with Denmark, Germany was one of the first movers on the development of wind power in Europe. Already at the
end of the 1980s, a rapid development was initiated in Germany, especially in the Northern part of the country with good wind
conditions, driven by favorable feed-in tariffs for wind produced power. As shown in Figure 10, in the early 1990s Germany had
Annual growth rates
60
50
%
40
30
20
10
Year
9
8
20
0
7
20
0
6
20
0
5
20
0
4
20
0
3
20
0
2
20
0
1
20
0
0
20
0
9
20
0
8
19
9
19
9
9
8
20
0
7
20
0
6
20
0
5
20
0
4
20
0
3
20
0
2
20
0
1
20
0
0
20
0
9
20
0
19
9
19
9
19
9
8
0
7
GW
Cumulative capacity
90
80
70
60
50
40
30
20
10
0
Year
Figure 9 Development of wind power capacity in Europe. (Left) Total cumulative capacity. (Right) Annual growth rates of cumulative capacity. Source:
GWEC (2010) [1]; BTM consult ApS – A part of NAVIGANT (2010) World Market Update 2009, March [2].
Wind Power Industry and Markets
Annual installed
capacity
Growth in
cumulative capacity
Year
08
20
06
20
04
20
02
20
00
92
19
07
05
03
01
09
20
20
20
20
97
95
93
91
99
20
19
19
19
19
19
19
89
0
98
500
20
1000
19
1500
19
%
2000
96
2500
100
90
80
70
60
50
40
30
20
10
0
19
3000
94
3500
MW
663
Year
Figure 10 Development of wind power capacity in Germany. (Left) Annual installed capacity. (Right) Annual growth rates of cumulative capacity. Source:
GWEC (2010) [1]; BTM consult ApS – A part of NAVIGANT (2010) World Market Update 2009, March [2].
some years with very strong growth in cumulative capacity, 70–90% increase per year, followed by a stable time period with
cumulative capacity growth rates of approximately 40% per year.
For many years, Germany has very successfully continued a policy of favorable feed-in tariffs, gradually decreasing the tariffs as
wind power technology has economically matured. However, although tariffs are still at a high level in Germany, growth rates of
cumulative capacity have gradually declined. For the last 5–6 years, the annual installed capacity has stagnated at approximately
1500–1700 MW, resulting in a growth rate of cumulative capacity below 10% per year. A major reason for this is that new available
sites for on-land turbines are becoming scarcer. Thus, by now Germany is increasingly looking into the possibilities of offshore wind
power development (see Section 2.20.7).
2.20.4.2
Spain
In Spain, wind power covers approximately 15% of the country’s electricity consumption. Spain is the number two country in
Europe accounting for a share of approximately 26% of total cumulative wind power capacity by 2009. But as for Germany also, the
pace in the Spanish development is declining. In 1999, approximately 28% of the new capacity in Europe was installed in Spain; by
2009, this share has fallen to approximately 23%. However, Spain is still the country in Europe with the largest installation of new
capacity amounting to almost 2500 MW in 2009 (see Figure 11).
The main driver in Spain has been a favorable feed-in tariff combined with a multitude of good wind sites in a large part of the
country. Historically, problems of getting access to the electricity grid and slow administrative procedures have been a limitation to
development in Spain. However, in recent years this seems to have improved [2]. Some uncertainty around the future level of the
feed-in tariff has implied a more unstable development of wind power in Spain than seen in Germany and this uncertainty seems to
persist for the future.
Growth in
cumulative capacity
140
40000
35000
30000
25000
20000
15000
10000
5000
00
120
%
100
80
60
40
20
Year
1993
1994
1995
1996
1997
1998
1999
2000
2001
2002
2003
2004
2005
2006
2007
2008
2009
0
19
91
19
93
19
95
19
97
19
99
20
01
20
03
20
05
20
07
20
09
MW
Annual installed
capacity
Year
Figure 11 Development of wind power capacity in Spain. (Left) Annual installed capacity. (Right) Annual growth rates of cumulative capacity. Source:
GWEC (2010) [1]; BTM consult ApS – A part of NAVIGANT (2010) World Market Update 2009, March [2].
664
2.20.4.3
Wind Power Industry and Markets
Rest of Europe
There is quite a distance from the dominating two wind power countries in Europe, Germany, and Spain, to the next level of
countries. While Germany and Spain accounts for 34% and 25% of total installed capacity in Europe, respectively, the following
countries account for less than 6% each. However, a group of rapid moving countries consists of Italy, France, the United Kingdom,
and Portugal. The countries’ share of total installed wind power capacity in Europe by the end of 2009 is shown in Figure 12.
The growth in cumulative wind power capacity in selected European countries is shown in Figure 13. As shown, quite a
difference exists between fast growing countries and slow growing ones.
Italy is experiencing a strong growth for the time being, increasing cumulative capacity by 37% in 2008 and 30% in 2009.
The country now has installed 4.8 GW and ranges as number three country in Europe in terms of cumulative wind power capacity.
The development in Italy is driven by a well-working green certificate system, and especially in the Southern part of the country, a
large number of good windy sites exist. At the end of 2009, a little more than 2% of power consumption in Italy was covered by
wind power [2].
A strong development of wind power is also going on in France. In 2008, cumulative capacity increased by 39% and by
32% in 2009. The development in France is driven by the country’s commitment to the EU renewable targets where wind
power is expected to contribute significantly. A fairly high feed-in tariff is implemented in France, which of course is the
major reason for the success.
The United Kingdom has taken the lead in offshore development of wind power. Forty-three percent of total installed offshore
capacity was established in the UK waters by the end of 2009. However, on-land installations are still dominating in the UK and
Ireland
2%
Sweden
2%
Greece
1%
Austria
1%
Turkey
1%
Poland
1%
Belgium
1%
Rest of Europe
2%
Netherlands
3%
Denmark
5%
Europe
Portugal
5%
Germany
34%
UK
5%
France
6%
Italy
6%
Spain
25%
Figure 12 Share of total installed wind power capacity in Europe, 2009. Source: GWEC (2010) [1].
Cumulative capacity
growth
80
70
60
%
50
40
30
20
10
U
Po K
rtu
D ga
e
l
N nm
et
ar
he
k
rla
nd
Sw s
ed
e
Ire n
la
n
G d
re
ec
Au e
st
ria
Tu
rk
e
Po y
la
B nd
R
es elg
to
iu
fE m
ur
op
e
Ita
l
Fr y
an
ce
0
Figure 13 Growth in cumulative wind power capacity in Europe in 2009 (excluding Germany and Spain).
Wind Power Industry and Markets
665
more than 80% of total installed capacity is land turbines. Also in the United Kingdom, the growth of cumulative capacity is
strong amounting to 35% in 2008 and 36% in 2009. The EU target for renewables is driving the Government’s actions and
commits the UK to cover 15% of final energy consumption with renewable energy production by 2020; by now the contribution
is approx. 4%. A system of Renewable Obligation Certificates (ROCs) is being utilized in the UK to promote renewable energy
technologies [2].
In Portugal the EU renewable target is an important driver as well. The target for Portugal is a 32% coverage of final energy
consumption by 2020, starting with approx. 21% by 2005. The national target is 5 GW by 2010 and at present this target seems not
to be fulfilled. Growth rates are still high in Portugal reaching 33% in 2008 and 24% in 2009 in cumulative capacity.
Denmark back in the 1980s and 1990s was the frontrunner in the development of wind power. But the Danish development was
stalled after year 2000, mainly because the fixed feed-in tariff was replaced with a feed-in premium at a lower level. In recent years
the premium has been increased so on-land installations of wind turbines are slowly starting again. Denmark is worldwide number
two in establishing offshore, holding 31% of total offshore installations only by-passed by the United Kingdom.
Among other established countries Sweden is developing pretty fast. Newcomers such as Poland and Turkey have large potentials
for siting wind turbines and by now seem to be growing fast, although they still have small amounts of wind power installed.
2.20.5 Development of Wind Power in North America
The North American region consists of the United States and Canada, where the United States is clearly dominating covering
approximately 91% of total installed wind power capacity. By the end of 2009, approximately 3.3 GW was installed in Canada,
where the growth of cumulative capacity in 2008 was 28% and in 2009 an astonishing 40%. In the following, the United States will
be treated in more detail.
2.20.5.1
United States
A little more than 35 GW of wind power in total was installed in the United States by the end of 2009, which makes it the largest
wind power country in the world, followed by Germany and China. Approximately 22% of the world’s wind power capacity was
established in the United States by the end of 2009. A veritable boom has appeared in the United States in recent years; the growth in
cumulative wind power capacity was in 2008 at astonishing 50% followed by a growth in 2009 of 39%. The development of annual
installed capacity in the United States is shown in Figure 14.
As Denmark, the United States was one of the early movers within the development of new wind power. Already in the early
1980s, the United States had a strong development of wind power especially driven by a tax rebate scheme. But the tax scheme was
abandoned in the mid-1980s and thereby the installation of wind power was halted (see Figure 14).
In general, the US policy is a combination of federal and State initiatives. Federal energy policies are complemented by State
policies, where the State policies are often found to be designed in a variety of different ways. One of the important federal policies is
the PTC. The PTC has had a significant influence on the development of wind power. At the same time, it has been subject to a stop
and-go policy, the decisions on PTC delaying the deployment of wind power and creating a significant uncertainty for the industry.
The importance of the stop-and-go policy for wind power is clearly illustrated in Figure 14, most of the discontinuities caused by
delayed PTC decisons [9].
Texas is the leading state in terms of wind power capacity, followed by Indiana and Iowa. In 2009, these three states accounted
for 41% of new installed capacity in the United States [2]. At the state level, the use of a renewable portfolio standard (RPS) scheme
is one of the more popular policy instruments.
Annual growth in
cumulative capacity
Annual installed capacity
12000
70
10000
60
50
%
6000
40
30
20
2000
10
0
0
Year
19
86
19
88
19
90
19
92
19
94
19
96
19
98
20
00
20
02
20
04
20
06
20
08
4000
19
83
19
85
19
87
19
89
19
91
19
93
19
95
19
97
19
99
20
01
20
03
20
05
20
07
20
09
MW
8000
Year
Figure 14 Development of wind power capacity in the United States. (Left) Annual installed capacity. (Right) Annual growth rates of cumulative capacity.
Source: GWEC (2010) [1]; BTM consult ApS – A part of NAVIGANT (2010) World Market Update 2009, March [2].
666
Wind Power Industry and Markets
2.20.6 Wind Power Development in Asia
The Asian region is dominated by China and India, where China holds a share of Asian cumulative installed capacity of 65%, while
India has a share of 28%. Japan has at present a share of 5% and is developing slowly. Finally, countries like Taiwan and South Korea
have less than 1% of the Asian installed wind power capacity.
Today, India holds an installed capacity of 10.9 GW and is developing at a stable rate. In 2008, the growth rate of cumulative
capacity was 23%, and in 2009, it was 13%. In the following, the Chinese development will be described in more detail.
2.20.6.1
China
China is clearly a newcomer to the wind power field, but nevertheless a newcomer that moves incredibly fast. By the end of 2009,
China had in total installed 25.1 GW of wind power, making China the third ranking country in the world in terms of cumulative
installed capacity, very close to Germany with a total capacity of 25.8 GW but still a way to go to reach the US level of installed
capacity of 35.1 GW. The development of annual installed capacity in China is shown in Figure 15.
With regard to China, fast means really fast; both in 2008 and 2009, the total installed capacity was more than doubled
compared to the previous year. Thus, the Chinese share of world installed wind power capacity went from 2% in 2005 to almost
16% by the end of 2009. By 2009, 35% of the world’s new established capacity was located in China compared to only 5% in 2005.
Combining this with the recent development in the United States, this clearly indicates that the European dominance is broken, that
new trends are pointing to a fast development in Chinese and US markets.
The wind power development in China actually started back in the mid-1990s. For almost 10 years the development was fairly
slow, the installed capacity being below 100 MW per year. But in 2005, the Renewable Energy Law was approved and this signaled
the take-off for wind power in China. Thus, in 2005 the growth rate in cumulative capacity reached 65% and since then China has
more than doubled cumulative capacity each year. In 2009 approximately 13 GW of new capacity was installed, making China the
world’s number one in terms of annual wind power installations.
The Chinese development is regulated by long-term plans and targets. The Renewable Energy Law in 2005 was an important
achievement and since then a number of new laws was put in place, regarding feed-in tariffs and access to the grid. In 2008, the
Renewable Energy development plan for the 11th 5-year period was approved, stating targets for wind power development in
China. The target for 2010 of 10 GW was already fulfilled in 2008, and during 2009, the Chinese Government launched a new
long-term target of 100 GW by 2020. If the pace of wind turbine installation is kept at the present level in China, this target will be
fulfilled in due time before 2020 [2, 10].
2.20.7 Offshore Wind Power Development
In a number of countries, offshore turbines are playing an increasingly important role in the development of wind power,
particularly in the north-western part of Europe. Partly this can be explained by on-land sitings being limited in number and that
the utilization of these sites to a certain extent is exposed to opposition from the local population. This is seen in relation to an
unexpected high level of energy production from offshore turbines compared to on-land sitings (based on the experiences gained
until now) and has paved the way for huge interest in offshore development.
As for onshore turbines, the wind regime, where the offshore turbines are sited determining the production of power, is the
single most important factor for the cost per generated unit of power. In general, the wind regime offshore is characterized by high
Increase in
cumulative capacity
140
12000
120
10000
100
8000
80
%
14000
6000
60
40
2000
20
0
0
Year
19
98
19
99
20
00
20
01
20
02
20
03
20
04
20
05
20
06
20
07
20
08
20
09
4000
19
9
19 5
9
19 6
9
19 7
9
19 8
9
20 9
0
20 0
0
20 1
0
20 2
0
20 3
0
20 4
0
20 5
0
20 6
0
20 7
0
20 8
09
MW
Annual installed capacity
Year
Figure 15 Development of wind power capacity in China. (Left) Annual installed capacity. (Right) Annual growth rates of cumulative capacity. Source:
GWEC (2010) [1]; BTM consult ApS – A part of NAVIGANT (2010) World Market Update 2009, March [2].
Wind Power Industry and Markets
Belgium
Ireland Netherlands
1% Finland 1%
11%
China
1%
3%
New capacity in 2009
350
300
United Kingdom
42%
250
MW
Germany
3%
Sweden
8%
667
200
150
100
50
Denmark
30%
0
United Denmark
Kingdom
Sweden
Germany
China
Figure 16 Offshore development. (Left) Distribution of total installed capacity by the end of 2009. (Right) New installed capacity in 2009. Source: BTM
consult ApS – A part of NAVIGANT (2010) World Market Update 2009, March [2].
average wind speeds and more stability than onshore wind. At the Danish Horns Reef wind farm, a wind speed corresponding to a
utilization time of more than 4200 h yr−1 was measured (adjusted to a normal wind year), thus giving a capacity factor close to 50%,
which is comparable to many smaller conventional power plants. For most offshore wind farms, a utilization time of more than
3000 h yr−1 is to be expected, significantly higher than for onshore sited turbines and, therefore, to a certain extent compensating for
the additional costs of offshore plants.
At present, more than 30 offshore wind farms with a total installed capacity of a little more than 2 GW are in operation with a few
exceptions, all located in the northern part of Europe. The largest installation is in British waters where almost 900 MW are located
corresponding to 43% of total offshore capacity. In Denmark, a little more than 600 MW are installed corresponding to 31% of total
offshore capacity, followed by the Netherlands (12%) and Sweden (8%) [11]. The offshore development is shown in Figure 16.
Denmark was the first country to examine the possibilities in offshore wind power, and already at the beginning of the 1990s, the
wind farm Vindeby consisting of 11 machines of 450 kW was established. This was followed by several small offshore wind farms;
among these is Middelgrunden with a capacity of 40 MW located just outside Copenhagen. The large Horn Reef offshore wind farm
consisting of 80 machines of 2 MW was established in 2002. The Danish Government is by now pursuing a tendering procedure in
promoting offshore development. The Anholt wind farm with a capacity of 400 MW was approved in 2010 and is expected to be on
line by 2012. Then it will be the world largest offshore wind farm. In Denmark, it is expected that by 2020 wind power supplies will
be 50% of total electricity consumption.
The offshore development in the United Kingdom started back in 2000, where the Blyth cluster of two 2 MW machines was
erected. The first real offshore wind farm was the North Hoyle in 2003 consisting of 30 turbines of 2 MW. Since then, quite a large
number of wind farms of 60–100 MW have been established in British waters. The United Kingdom has a large potential for
offshore wind both at West and East shores. The utilization of this potential is regulated by the Crown Estate, and a number of
rounds for offshore exploitation have been launched. Renewable obligation certificates (ROCs) are being used to support the
development of renewables in the United Kingdom. Offshore wind power is receiving 1.5–2 ROCs per MWh produced compared to
the normal of 1 ROC for on-land wind. In the United Kingdom, 13 projects were awarded 32 GW at the beginning of 2010 in the
Crown Estates Round 3 [9].
Although Germany had a hesitating start of offshore wind power development, in 2009 the Alpha Ventus project consisting of 10
turbines of 6 MW was finalized. By 2009, the legislation for offshore wind farms was also improved significantly in Germany, an
improved feed-in tariff specifically for offshore came in place and grid companies were committed to establish and pay for the
offshore transmission cable connecting the wind farm to land, which accounts for 15–20% of the total costs. A huge number of
offshore wind farms reaching a capacity of up to 10 GW or more are by now approved by the German authorities. These wind farms
typically have a size of 400 MW each.
Thus, although offshore wind power at present do not account for more than 1.3% of total installed wind power capacity, a
strong development in offshore is expected. In a number of countries, offshore wind power projects are in the planning and
implementation phase, as mentioned especially in Germany, the United Kingdom, and Denmark.
2.20.8 Wind Turbine Manufacturers
Thus, the pattern of growth in wind power is changing. While the absolute annual installed capacity in the last couple of years has
remained almost at a constant level in Germany, Spain (Spain experienced a strong growth in 2007, but has since shown a somewhat
uneven growth), and India, the installed capacity in the United States and especially China has boomed. Of course, these changing
market perspectives are of utmost importance for the wind turbine manufacturers, the ‘old’ well-established European companies
establishing subsidiaries in Asia and the United States, facing a still stronger competition from low-cost Asian manufacturers.
668
Wind Power Industry and Markets
Made (ES)
Dewind (GE) 2%
2%
Mitsubishi
(JA)
1%
Suzlon (IN)
2%
Ecotechnia
(ES)
Enron (USA)
4%
6%
Desarrollos (ES)
Others
1%
4%
Vestas (DK)
18%
Gamesa (ES)
14%
Nordex (GE/DK)
8%
Bonus (DK)
11%
NEG Micon (DK)
13%
2000
Enercon (GE)
14%
Figure 17 Manufacturers share of total installed wind power capacity in year 2000. Source: BTM consult ApS – A part of NAVIGANT (2001) World
Market Update 2000, March.
Looking at manufacturers by the year 2000, Europe had a dominating share (Figure 17). Of the 13 largest manufacturers, 10
manufacturers were located in Europe, supplying approximately 87% of the installed capacity [12]. Observe that all European
manufacturers were located in the three countries where most wind turbines were erected as well, namely Germany, Spain, and
Denmark. Thus, there seems to be a close correlation between markets and local/national industrial development.
By 2009 the picture had changed significantly. Europe still has a strong position with a market share of 42%, but especially the
United States and China have gained and by now have market shares of 15% and 27%, respectively.
Vestas still is the largest supplier with a market share of 13% in 2009, followed by GE Wind with a marginally lower market share
of almost 13%. However, a number of company merges have taken place in the period from 2000 to 2009. Vestas and NEG-Micon
were merged in 2004 under the Vestas name (a total market share of 31%), and taking this into account, the company has lost
significant market shares. Bonus was bought by the German company Siemens, and continued under this name. Enron is now GE
Wind, Made was overtaken, Ecotechnia was acquired by Alstom in 1997 and now has the name Alstom Wind (Alstom Wind is too
small to enter the figure and accounted as others). However, the largest difference is to be found in the numerous new Chinese
manufacturers that have entered the market in recent years. Figure 18 shows only the largest Chinese manufacturers, but in 2009,
more than 20 Chinese companies were producing wind turbines to the domestic market [8].
The Danish company ‘Vestas’ started its production of wind turbines back in 1979, where the first 55 kW machine was erected; a
machine that actually got very popular not only in Denmark but also in the United States. As mentioned, Vestas is today the market
leader with a market share of 13% and a delivery of 4766 MW in 2009 – this is five times as much as in year 2000. Vestas produces a
broad range of turbines, ranging from 850 kW to 3 MW, all of a conventional three-bladed gear-box design. A new large turbine,
United
Power (PRC)
2%
Clipper Mingyang
(USA)
(PRC)
2%
2%
Others
Vestas (DK)
9%
13%
2009
Mitsubishi (JA)
2%
Repower (GE)
4%
Nordex (GE)
3%
Siemens (DK)
6%
Suzlon (IN)
7%
Dongfang (PRC)
7%
Gamesa (ES)
7%
GE Wind (USA)
13%
Sinovel (PRC)
9%
Enercon (GE)
9%
Goldwind
(PRC)
7%
Figure 18 Manufacturers share of total installed wind power capacity by year 2009. Source: BTM consult ApS – A part of NAVIGANT (2010) World
Market Update 2009, March [2].
Wind Power Industry and Markets
669
presumably of 6 MW size, has been announced by the company to be on the way. Vestas is a truly international company supplying
almost all countries of the world. Vestas has a headquarters in Denmark and subsidiaries in Spain, the United States, and China. By
2009, approximately 58% of the production was delivered in Europe, 27% in the United States, and 14% in Asia. The major part of
Vestas’ production is supplied for on-land projects; however, the 3 MW turbines are quite popular for offshore projects as well.
The US company ‘GE Wind’ is the second largest supplier with a 2009 market share of 13% and a delivery of 4741 MW. GE has a
very strong position in the US market where it has a market share of more than 45%, and therefore, the booming American market
has been a significant driver for GE. But also at the Canadian market, GE is one of the largest suppliers. GE is present at a number of
markets in Europe but has no dominating position outside North America. GE has a product line consisting of conventional
three-bladed gear-box machines ranging from 1.5 to 2.5 MW. Especially, the 1.5 model has been very popular and a large number of
these turbines have been erected.
The Chinese company ‘Sinovel’ became the third largest supplier in 2009 with a market share of 9% and a delivery of 3510 MW.
The company is a real newcomer, growing rapidly in recent years taking advantage of the booming wind power market in China.
Sinovel produces a 1.5 MW machine with different rotor diameters and a pitch-regulated 3 MW machine all of conventional design.
The company has a market share of 25% in China in 2009 and only a small export, mainly to India [2].
As Vestas the German company ‘Enercon’ is one of the pioneers within wind power and in 1992 their first gear-less turbine was
erected. Thus, Enercon is the manufacturer of direct-drive gear-less turbines and by the end of 2009 the company held fourth
position with a market share of 9% and an installation of 3221 MW this year. Enercon has a market share of more than 62% in
Germany, but has also high market shares in other European countries such as Portugal, Italy, France, and Sweden. Outside Europe,
Enercon is especially doing well in Canada. Enercon has a product line ranging from 1.8 to 6 MW all direct-drive gear-less machines.
Chinese ‘Goldwind’ holds a 20% share of the Chinese market but for the time being is mainly a domestic supplier. Spanish
‘Gamesa’ dominates the Spanish market with a share of 36% and is doing well in Italy and France. ‘Siemens’ – German owned with
production facilities mainly located in Denmark – is an undisputable number one in offshore wind power, only rivaled by Vestas.
At present, manufacturers are split with regard to two technological trends: a trend toward producing very large turbines and one
toward direct-drive gear-less machines. Among the manufacturers, Repower and Enercon are supplying 6 MW turbines, Bard has a
5 MW one, and Siemens has a very popular 3.6 MW machine. Vestas has announced a 6 MW machine to be on the way and
American Clipper is building a 10 MW prototype in the United Kingdom [2].
The competition between the direct-drive gear-less concept and the traditional gear-based concept is still going on. As
mentioned, German Enercon is a main driver in developing the direct-drive concept, but also Chinese Goldwind is producing a
1.5 MW direct-drive machine that has been sold in large numbers in China in 2009. Siemens launched a 3 MW direct-drive turbine
with permanent magnets in autumn 2009. Although, the majority of turbines are conventional ones, the direct-drive concept seems
increasingly to attract interest among manufacturers.
References
[1]
[2]
[3]
[4]
[5]
[6]
[7]
[8]
[9]
[10]
[11]
[12]
GWEC (2010) (Brussels, accessed March 2010).
BTM-Consult (2010) World Market Update 2009, March.
BTM-Consult (2009) World Market Update 2008, March.
EWEA (2009) Wind Energy the Facts. Earthscan, Brussels.
Nielsen P, Lemming J, Morthorst PE, et al. (2010) Vindmøllers Økonomi (The Economics of Wind Turbines). Aalborg, Denmark: EMD.
EU Commission (2005) Communication from the Commission. The support of electricity from renewable energy sources.
IEA (2008) Recabs-model. Developed in the IEA Implementing Agreement on Renewable Energy Technology Deployment. />
(Paris, accessed March 2010).
OECD/IEA (2008) World Energy Outlook 2007. Paris, France: OECD and International Energy Agency.
Risø Energy Report (2006) Renewable energy for power and transport. Risø, November.
BTM-Consult (2008) “Made in China”, Chinese wind power market assessment 2008–2012, Ringkjoebing, November.
BTM-Consult (2010b) Offshore report 2010. November.
BTM-Consult (2001) World Market Update 2000, March.