Introduction to operations and supply chain management 3e bozarth chapter 04
Bạn đang xem bản rút gọn của tài liệu. Xem và tải ngay bản đầy đủ của tài liệu tại đây (472.97 KB, 47 trang )
Business Processes
Chapter 4
Chapter Objectives
Be able to:
Explain what a business process is and how the business perspective differs from a
traditional, functional perspective.
Create process maps for a business process and use them to understand and
diagnose a process.
Calculate and interpret some common measures of process performance.
Discuss the importance of benchmarking and distinguish between competitive
benchmarking and process benchmarking.
Describe the Six Sigma methodology, including the steps of the DMAIC process.
Use and interpret some common continuous improvement tools.
Explain what the Supply-Chain Operations Reference (SCOR) model is and why it is
important to businesses.
Copyright © 2013 Pearson Education, Inc. publishing as Prentice Hall
4-2
Business Processes
Process – A set of logically related tasks or activities
performed to achieve a defined business outcome.
Primary process – A process
that addresses the main
© 2010 APICS Dictionary
value-added activities of an organization.
Development process – A process that seeks to improve
the performance of primary and support processes.
Support process – A process that performs necessary,
albeit not value added activities.
Copyright © 2013 Pearson Education, Inc. publishing as Prentice Hall
4-3
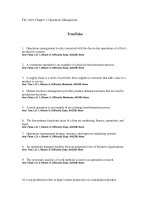
Improving Business Processes
Figure 4.3
Copyright © 2013 Pearson Education, Inc. publishing as Prentice Hall
4-4
Mapping Business Processes
Mapping – The process of developing graphic
representations of the organizational relationships
and/or activities that make up a business process.
Process Map – A detailed map that identifies the
specific activities that make up the informational,
physical, and/or monetary flow of a process.
Copyright © 2013 Pearson Education, Inc. publishing as Prentice Hall
4-5
Purposes of Mapping
Create a common understanding of the processes,
activities, and results.
Define the boundary of the process.
Provide a baseline to measure the impact of
improvement efforts.
Copyright © 2013 Pearson Education, Inc. publishing as Prentice Hall
4-6
Process Mapping Guidelines
Identify the entity that will serve as your focal point.
Customer?
Order?
Item?
Identify clear boundaries and starting and ending
points.
Keep it simple
Does this detail add any insight?
Do we need to map every exception condition?
Copyright © 2013 Pearson Education, Inc. publishing as Prentice Hall
4-7
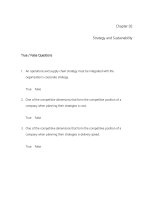
Process Mapping Symbols
Figure 4.4
Copyright © 2013 Pearson Education, Inc. publishing as Prentice Hall
4-8
Process Mapping Example
San Diego Distribution Center (DC)
Process:
Dealer faxes order to DC. One out of 25 orders lost because of paper jams.
Fax sits in “In Box” around 2 hours (up to 4) until internal mail picks it up.
Internal mail takes about one hour (up to 1.5 hours) to deliver to the picking
area. One out of 100 faxes are delivered to the wrong place.
Order sits in clerk’s in-box until it is processed (0 to 2 hours). Processing
time takes 5 minutes.
If item is in stock, worker picks and packs order (average = 20 minutes, but
up to 45 minutes).
Inspector takes 2 minutes to check order. Still, one out of 200 orders are
completed incorrectly.
Transport firm delivers order (1 to 3 hours).
Copyright © 2013 Pearson Education, Inc. publishing as Prentice Hall
4-9
Let’s Map the Process!
What is the focal point of the mapping effort?
What are the boundaries of the process map?
What detail is missing from this simple example?
Copyright © 2013 Pearson Education, Inc. publishing as Prentice Hall
4 - 10
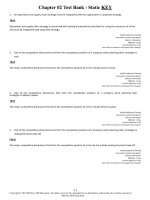
One Possible Solution
Figure 4.6
Copyright © 2013 Pearson Education, Inc. publishing as Prentice Hall
4 - 11
Guidelines for
Process Improvement
Examine each delay symbol
Cause, Length, Possible to Reduce?
Examine each activity symbol
Necessary? What is the value? How can we prevent errors?
Examine each decision symbol
Can it be eliminated?
Look for loops
Would better quality eliminate them? Costs?
Copyright © 2013 Pearson Education, Inc. publishing as Prentice Hall
4 - 12
Swim Lane Process Maps
Swim lane process map – A process map that
graphically arranges the process steps so that the
user can see who is responsible for each step.
Copyright © 2013 Pearson Education, Inc. publishing as Prentice Hall
4 - 13
Swim Lane Process Example
Figure 4.7
Copyright © 2013 Pearson Education, Inc. publishing as Prentice Hall
4 - 14
Measuring Process Performance
Quality
Cost
Time
Flexibility
Copyright © 2013 Pearson Education, Inc. publishing as Prentice Hall
4 - 15
Productivity
Productivity – A measure of process performance.
Productivity = Outputs
Inputs
Copyright © 2013 Pearson Education, Inc. publishing as Prentice Hall
4 - 16
Productivity
Single-factor productivity – A productivity score that
measures output levels relative to single input.
Multifactor productivity – A productivity score that
measures output levels relative to more than one
input.
Copyright © 2013 Pearson Education, Inc. publishing as Prentice Hall
4 - 17
Examples
Single-factor
productivity ratio:
Multifactor:
Total multifactor:
Batteries Produced
Direct Labor Hours
Batteries Produced
Machine Hours + Direct Labor Hours
Total Nightly Sales ($)
Total Nightly Costs ($)
Copyright © 2013 Pearson Education, Inc. publishing as Prentice Hall
4 - 18
Another Example
Quantity
$/Unit
Car X
4,000 cars
$8,000/car
Car Y
6,000 cars
$9,500/car
Total labor for
building X
20,000 hours
$12/hour
Total labor for
building Y
30,000 hours
$14/hour
Copyright © 2013 Pearson Education, Inc. publishing as Prentice Hall
4 - 19
Productivity Example
What is the Labor Productivity
in hours for Each Car?
Car X:
(4,000 cars / 20,000 hrs) = ?
Car Y:
(6,000 cars / 30,000 hrs) = ?
How might these measures be affected
by capital substitution?
Copyright © 2013 Pearson Education, Inc. publishing as Prentice Hall
4 - 20
Productivity Example
What is the Labor Productivity
in hours for Each Car?
Car X:
(4,000 × $8,000) =
(20,000 × $12)
?
Car Y:
(6,000 × $9,500) =
(30,000 × $14)
?
Copyright © 2013 Pearson Education, Inc. publishing as Prentice Hall
4 - 21
Productivity Example
Car X:
(4,000 cars / 20,000 hrs) = .2
Car Y:
(6,000 cars / 30,000 hrs) = .2
Car X:
(4,000 × $8,000)/(20,000 × $12) = 133.33
Car Y:
(6,000 × $9,500)/(30,000 × $14) = 135.72
What are the benefits/drawbacks?
Copyright © 2013 Pearson Education, Inc. publishing as Prentice Hall
4 - 22
Efficiency
Efficiency – A measure of process performance; the
ratio of actual outputs to standard outputs.
Standard output – An estimate of what should be
produced, given a certain level of resources.
Copyright © 2013 Pearson Education, Inc. publishing as Prentice Hall
4 - 23
Efficiency
Efficiency =
100% (actual outputs / standard outputs)
OR: Efficiency =
100% (standard time/actual time) for one unit
Copyright © 2013 Pearson Education, Inc. publishing as Prentice Hall
4 - 24
Cycle Time
Cycle Time – The total elapsed time needed to
complete a business process.
Percent Value-Added Time – The percentage of total
cycle time that is spent on activities that actually
provide value.
Percent Value-Added Time =
100% (value-added time)/(total cycle time)
Copyright © 2013 Pearson Education, Inc. publishing as Prentice Hall
4 - 25