Introduction to operations and supply chain management 3e bozarth chapter 10
Bạn đang xem bản rút gọn của tài liệu. Xem và tải ngay bản đầy đủ của tài liệu tại đây (850.83 KB, 42 trang )
Sales and Operations Planning
(Aggregate Planning)
Chapter 10
Chapter Objectives
Be able to:
Distinguish among strategic planning, tactical planning, and detailed planning
and control.
Describe why sales and operations planning (S&OP) is important to an
organization and its supply chain partners.
Generate multiple alternative sales and operations plans for a firm.
Describe the differences between top-down and bottom-up S&OP and discuss
the strengths and weaknesses of level, chase, and mixed production strategies.
Discuss the organizational issues that arise when firms decide to incorporate
S&OP into their efforts.
Examine how S&OP can be used to coordinate activities up and down the
supply chain.
Apply optimization modeling techniques to the S&OP process.
Copyright © 2013 Pearson Education, Inc. publishing as Prentice Hall
10 - 2
Sales and Operations Planning
Sales and operations planning (S&OP) – A process to
develop tactical plans by integrating marketing
plans for new and existing products with the
management of the supply chain.
Brings together all the
plans for the business into
© 2010 APICS Dictionary
one integrated set of plans.
Also called Aggregate planning.
Copyright © 2013 Pearson Education, Inc. publishing as Prentice Hall
10 - 3
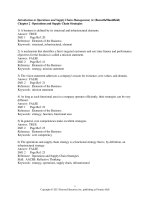
S&OP Planning Levels
Strategic planning
Tactical planning
Detailed planning and control
Figure 10.1
Copyright © 2013 Pearson Education, Inc. publishing as Prentice Hall
10 - 4
Goals of S&OP
To indicate how the organization will use its tactical
capacity resources to meet expected customer
demand.
To strike a balance between the various needs and
constraints of the supply chain partners.
To serve as a coordinating mechanism for the
various supply chain partners.
To express the business’s plans in terms that
everyone can understand.
Copyright © 2013 Pearson Education, Inc. publishing as Prentice Hall
10 - 5
Major Approaches
Top-down planning – An approach to S&OP in which
a single, aggregated sales forecast drives the
planning process.
Bottom-up planning – An approach to S&OP that is
used when the product/service mix is unstable and
resource requirements vary greatly across the
offerings.
Copyright © 2013 Pearson Education, Inc. publishing as Prentice Hall
10 - 6
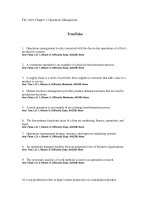
Choosing an Approach
Figure 10.2
Copyright © 2013 Pearson Education, Inc. publishing as Prentice Hall
10 - 7
Planning Values
Planning values – Values that decision makers use to
translate a sales forecast into resource requirements
and to determine the feasibility and costs of
alternative sales and operations plans.
Copyright © 2013 Pearson Education, Inc. publishing as Prentice Hall
10 - 8
Top-Down Planning
Developing a top-down plan:
Develop the aggregate sales forecast and
planning values.
Translate the sales forecast into resource
requirements.
Generate alternative production plans.
Copyright © 2013 Pearson Education, Inc. publishing as Prentice Hall
10 - 9
Top-Down Example –
Pennington Cabinets
12 month
sales forecast
Copyright © 2013 Pearson Education, Inc. publishing as Prentice Hall
10 - 10
Top-Down Example –
Pennington Cabinets
Table 10.3
Copyright © 2013 Pearson Education, Inc. publishing as Prentice Hall
10 - 11
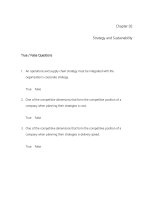
Top-Down Example –
Pennington Cabinets
Forecast
exceeds capacity
in peak months
Figure 10.3
Copyright © 2013 Pearson Education, Inc. publishing as Prentice Hall
10 - 12
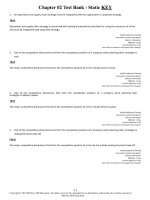
Top-Down Example –
Pennington Cabinets
Translate the Sales Forecast into Resource Requirements
For example:
April
800 * 20 = 16,000 hrs
16,000/160 = 100 wkrs
Table 10.4
Copyright © 2013 Pearson Education, Inc. publishing as Prentice Hall
10 - 13
Alternative Production Plans
Level production plan – A S&OP plan in which
production is held constant and inventory is used to
absorb the differences between production and the
sales forecast.
Chase production plan – A S&OP plan in which
production is changed in each time period to match
the sales forecast.
Mixed production plan - A S&OP plan that varies
both production and inventory levels in an effort to
develop the most effective plan.
Copyright © 2013 Pearson Education, Inc. publishing as Prentice Hall
10 - 14
Level Production Plan
Table 10.5
Copyright © 2013 Pearson Education, Inc. publishing as Prentice Hall
10 - 15
Level Production Plan
Actual Workers
Hold workforce constant at 105 (average
workforce over 12-month planning horizon)
Regular Production
105 x (160 hours per month/20 hours per set) =
840 sets per month or 10,080 sets per year
Copyright © 2013 Pearson Education, Inc. publishing as Prentice Hall
10 - 16
Level Production Plan
Hiring and Layoffs
Hire 5 workers in January to bring the workforce
up to 105 from the initial level of 100.
Layoff 5 workers at the end to bring the
workforce back to its starting level.
• Ensures equal comparison of alternative plans under
the same beginning and ending conditions.
Copyright © 2013 Pearson Education, Inc. publishing as Prentice Hall
10 - 17
Level Production Plan
Inventory Levels
Copyright © 2013 Pearson Education, Inc. publishing as Prentice Hall
10 - 18
Level Production Plan
Cost of the Plan
Copyright © 2013 Pearson Education, Inc. publishing as Prentice Hall
10 - 19
Chase Production Plan
Actual workforce production and overtime
production vary so that total production essentially
matches sales for each month.
Inventory never builds up because total production
“chases” sales.
There are more hires and layoffs and overtime
production costs.
Copyright © 2013 Pearson Education, Inc. publishing as Prentice Hall
10 - 20
Chase Production Plan
Table 10.6
Copyright © 2013 Pearson Education, Inc. publishing as Prentice Hall
10 - 21
Chase Production Plan
Cost of the plan
Copyright © 2013 Pearson Education, Inc. publishing as Prentice Hall
10 - 22
Mixed Production Plan
By varying the production and inventory levels, the
best plan can be developed.
The number of potential mixed plans is essentially
limitless.
For example, overtime may be limited to 12 cabinet
sets per month in October and November.
Copyright © 2013 Pearson Education, Inc. publishing as Prentice Hall
10 - 23
Mixed Production Plan
Table 10.7
Copyright © 2013 Pearson Education, Inc. publishing as Prentice Hall
10 - 24
Mixed Production Plan
Cost of the Plan
Copyright © 2013 Pearson Education, Inc. publishing as Prentice Hall
10 - 25