IT project management 3rd by THompson chappter 06
Bạn đang xem bản rút gọn của tài liệu. Xem và tải ngay bản đầy đủ của tài liệu tại đây (543.34 KB, 46 trang )
Chapter 6:
Project Time Management
Learning Objectives
• Understand the importance of project schedules and good
project time management
• Define activities as the basis for developing project
schedules
• Describe how project managers use network diagrams
and dependencies to assist in activity sequencing
• Explain how various tools and techniques help project
managers perform activity duration estimating and
schedule development
• Use a Gantt chart for schedule planning and tracking
schedule information
Learning Objectives
• Understand and use critical path analysis
• Describe how to use several techniques for shortening
project schedules
• Explain the basic concepts behind critical chain
scheduling and Program Evaluation and Review
Technique (PERT)
• Discuss how reality checks and people issues are
involved in controlling and managing changes to the
project schedule
• Describe how software can assist in project time
management
Importance of Project Schedules
• Managers often cite delivering projects on time as
one of their biggest challenges
• Average time overrun from 1995 CHAOS report
was 222%; improved to 163% in 2001 study
• Time has the least amount of flexibility; it passes
no matter what
• Schedule issues are the main reason for conflicts
on projects, especially during the second half of
projects
Figure 6-1. Conflict Intensity
Over the Life of a Project
0.40
Conflict Intensity
0.35
0.30
0.25
Average
Total Conflict
0.20
Procedures
Cost
0.15
Personality conflicts
0.10
0.05
0.00
Schedules
Priorities
Manpower
Technical opinions
Project
Formation
Early Phases
Middle Phases
End Phases
Project Time Management
Processes
• Project time management involves the
processes required to ensure timely completion
of a project. Processes include:
–
–
–
–
–
Activity definition
Activity sequencing
Activity duration estimating
Schedule development
Schedule control
Activity Definition
• Project schedules grow out of the basic
document that initiate a project
– Project charter includes start and end dates and
budget information
– Scope statement and WBS help define what will be
done
• Activity definition involves developing a more
detailed WBS and supporting explanations to
understand all the work to be done so you can
develop realistic duration estimates
Activity Sequencing
• Involves reviewing activities and determining
dependencies
– Mandatory dependencies: inherent in the nature of
the work; hard logic
– Discretionary dependencies: defined by the project
team; soft logic
– External dependencies: involve relationships
between project and non-project activities
• You must determine dependencies in order to
use critical path analysis
Project Network Diagrams
• Project network diagrams are the preferred
technique for showing activity sequencing
• A project network diagram is a schematic
display of the logical relationships among, or
sequencing of, project activities
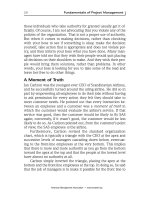
Figure 6-2. Sample Activity-on-Arrow
(AOA) Network Diagram for Project X
Arrow Diagramming Method
(ADM)
• Also called activity-on-arrow (AOA) project
network diagrams
• Activities are represented by arrows
• Nodes or circles are the starting and ending
points of activities
• Can only show finish-to-start dependencies
Process for Creating AOA Diagrams
1. Find
all of the activities that start at node 1. Draw their finish
nodes and draw arrows between node 1 and those finish nodes.
Put the activity letter or name and duration estimate on the
associated arrow
2. Continuing drawing the network diagram, working from left to
right. Look for bursts and merges. Bursts occur when a single
node is followed by two or more activities. A merge occurs
when two or more nodes precede a single node
3. Continue drawing the project network diagram until all
activities are included on the diagram that have dependencies
4. As a rule of thumb, all arrowheads should face toward the right,
and no arrows should cross on an AOA network diagram
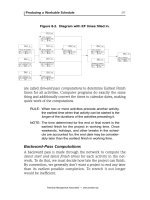
Precedence Diagramming Method
(PDM)
• Activities are represented by boxes
• Arrows show relationships between activities
• More popular than ADM method and used by
project management software
• Better at showing different types of
dependencies
Figure 6-3. Task Dependency Types
Sample PDM Network Diagram
Activity Duration Estimating
• After defining activities and determining their
sequence, the next step in time management is
duration estimating
• Duration includes the actual amount of time
worked on an activity plus elapsed time
• Effort is the number of workdays or work
hours required to complete a task. Effort does
not equal duration
• People doing the work should help create
estimates, and an expert should review them
Schedule Development
• Schedule development uses results of the other
time management processes to determine the
start and end date of the project and its activities
• Ultimate goal is to create a realistic project
schedule that provides a basis for monitoring
project progress for the time dimension of the
project
• Important tools and techniques include Gantt
charts, PERT analysis, critical path analysis, and
critical chain scheduling
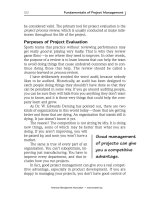
Gantt Charts
• Gantt charts provide a standard format for
displaying project schedule information by
listing project activities and their corresponding
start and finish dates in a calendar format
• Symbols include:
– A black diamond: milestones or significant events on
a project with zero duration
– Thick black bars: summary tasks
– Lighter horizontal bars: tasks
– Arrows: dependencies between tasks
Figure 6-5. Gantt Chart for Project X
Gantt Chart for Software Launch Project
Milestones
• Milestones are significant events on a project
that normally have zero duration
• You can follow the SMART criteria in
developing milestones that are:
–
–
–
–
–
Specific
Measurable
Assignable
Realistic
Time-framed
Sample Tracking Gantt Chart
Critical Path Method (CPM)
• CPM is a project network analysis technique
used to predict total project duration
• A critical path for a project is the series of
activities that determines the earliest time by
which the project can be completed
• The critical path is the longest path through
the network diagram and has the least amount
of slack or float
Finding the Critical Path
• First develop a good project network diagram
• Add the durations for all activities on each path
through the project network diagram
• The longest path is the critical path
Simple Example of Determining
the Critical Path
• Consider the following project network
diagram. Assume all times are in days.
start
1
A=2
2
B=5
C=2
4
E=1
3
6
D=7
5
a. How many paths are on this network diagram?
b. How long is each path?
c. Which is the critical path?
d. What is the shortest amount of time needed to
complete this project?
F=2
finish