MacroEcomonics principles, application, and tools 7th edition by sullivan chapter 06
Bạn đang xem bản rút gọn của tài liệu. Xem và tải ngay bản đầy đủ của tài liệu tại đây (544.96 KB, 28 trang )
CHAPTER 6
Unemployment and
Inflation
Copyright © 2012 Pearson
Prentice
Hall.
All rights
reserved.
Copyright
© 2012
Pearson
Prentice
Hall. All rights reserved.
6-1
CHAPTER
Unemployment
and Inflation
6
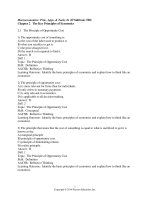
In February 2010, the Bureau of Labor Statistics (BLS) announced
that the unemployment rate was 9.7 percent.
PREPARED BY
Copyright © 2012 Pearson Prentice Hall. All rights reserved.
Brock Williams
CHAPTER 6
Unemployment and
Inflation
APPLYING THE CONCEPTS
1
What do the recent data show about trends in the
percentage of women who are working?
After Growing Sharply, Women’s Labor Force
Participation Has Leveled Off
2
Does more liberal disability insurance decrease
measured unemployment?
More Disability, Less Unemployment?
3
Are you less upset from being unemployed if
unemployment is common in your peer group?
Social Norms, Unemployment, and Perceived
Happiness
4
How large is the bias in the CPI due to not immediately
incorporating new goods?
The Introduction of Cell Phones and the Bias in the
CPI
Copyright © 2012 Pearson Prentice Hall. All rights reserved.
6-3
CHAPTER 6
Unemployment and
Inflation
6.1
EXAMINING UNEMPLOYMENT
How Is Unemployment Defined and Measured?
● labor force
The total number of workers, both
the employed and the unemployed.
labor force = employed + unemployed
● unemployment rate
The percentage of the labor force
that is unemployed.
unemployed
unemployment rate =
× 100
labor force
Copyright © 2012 Pearson Prentice Hall. All rights reserved.
6-4
CHAPTER 6
Unemployment and
Inflation
6.1
EXAMINING UNEMPLOYMENT (cont’d)
How Is Unemployment Defined and Measured?
● labor force participation rate
The percentage of the population
over 16 years of age that is in the
labor force.
labor force participation rate =
Copyright © 2012 Pearson Prentice Hall. All rights reserved.
labor force
× 100
population 16 years and older
6-5
CHAPTER 6
Unemployment and
Inflation
6.1
EXAMINING UNEMPLOYMENT (cont’d)
How Is Unemployment Defined and Measured?
FIGURE 6.1
Unemployment Data, February 2010
Approximately 65 percent of the civilian population is in the labor
force. The unemployment rate in February 2010 was 9.7 percent.
Copyright © 2012 Pearson Prentice Hall. All rights reserved.
6-6
CHAPTER 6
Unemployment and
Inflation
6.1
EXAMINING UNEMPLOYMENT (cont’d)
How Is Unemployment Defined and Measured?
FIGURE 6.2
Unemployment Rates in
Developed Countries
Among the developed
countries, unemployment
rates vary substantially.
Copyright © 2012 Pearson Prentice Hall. All rights reserved.
6-7
CHAPTER 6
Unemployment and
Inflation
APPLICATION
1
AFTER GROWING SHARPLY, WOMEN’S LABOR FORCE
PARTICIPATION HAS LEVELED OFF
APPLYING THE CONCEPTS #1: What do the recent data
show about trends in the percentage of women who are
working?
In 1948, the labor force participation rate for women 20 years
and older was 32 percent. By 1970, it had grown to 43
percent, and by 1997 it had reached 60 percent. Since 1997,
the figure has remained virtually constant at 60 percent.
Explanations:
• Women may simply have run out of available time.
• Even with new technology, housework and childcare do
take time.
Conclusion: Because women provide more household services
than men, it is understandable why their labor force participation
may have reached a peak.
Copyright © 2012 Pearson Prentice Hall. All rights reserved.
6-8
CHAPTER 6
Unemployment and
Inflation
6.1
EXAMINING UNEMPLOYMENT (cont’d)
Alternative Measures of Unemployment and Why They Are Important
● discouraged workers
Workers who left the labor
force because they could not
find jobs.
FIGURE 6.3
Alternative Measures of
Unemployment, February
2010
Including discouraged workers,
marginally attached workers,
and individuals working part
time for economic reasons
substantially increases
measured unemployment in
2010 from 14.87 million to
26.18 million.
Copyright © 2012 Pearson Prentice Hall. All rights reserved.
6-9
CHAPTER 6
Unemployment and
Inflation
6.1
EXAMINING UNEMPLOYMENT (cont’d)
Who Are the Unemployed?
FIGURE 6.4
Selected U.S. Unemployment
Statistics, Unemployment Rates
for February 2010
The incidence of unemployment
differs sharply among demographic
groups.
Copyright © 2012 Pearson Prentice Hall. All rights reserved.
6-10
CHAPTER 6
Unemployment and
Inflation
APPLICATION
2
MORE DISABILITY, LESS UNEMPLOYMENT?
APPLYING THE CONCEPTS #2: Does more liberal
disability insurance decrease measured
unemployment?
•The federal Disability Insurance program provides income to nonelderly
workers who are deemed unable to engage in substantial employment.
•Economists David Autor and Mark Duggan studied the impact of this
program on labor force participation.
•They found that the changes in the rules administering the program, the
increased generosity of the benefits of the program for low-skilled
workers, and the increase in the value of health care services all
contributed to an increase in participation in this program.
•Since these workers, a portion of whom would have been unemployed,
were no longer in the labor force, the economists estimated that the effect
of the Disability Insurance program was to lower the measured
unemployment rate by 0.5 percent, a very large effect.
Copyright © 2012 Pearson Prentice Hall. All rights reserved.
6-11
CHAPTER 6
Unemployment and
Inflation
6.1
EXAMINING UNEMPLOYMENT (cont’d)
Who Are the Unemployed?
● seasonal unemployment
The component of
unemployment attributed to
seasonal factors.
Copyright © 2012 Pearson Prentice Hall. All rights reserved.
6-12
CHAPTER 6
Unemployment and
Inflation
6.2
CATEGORIES OF UNEMPLOYMENT
Types of Unemployment: Cyclical, Frictional, and Structural
● cyclical unemployment
Unemployment that occurs during
fluctuations in real GDP.
● frictional unemployment
Unemployment that occurs with the
normal workings of the economy, such
as workers taking time to search for
suitable jobs and firms taking time to
search for qualified employees.
● structural unemployment
Unemployment that occurs when
there is a mismatch of skills and jobs.
Copyright © 2012 Pearson Prentice Hall. All rights reserved.
6-13
CHAPTER 6
Unemployment and
Inflation
6.2
CATEGORIES OF UNEMPLOYMENT
(cont’d)
The Natural Rate of Unemployment
● natural rate of unemployment
The level of unemployment at which
there is no cyclical unemployment. It
consists of only frictional and
structural unemployment.
● full employment
The level of unemployment that
occurs when the unemployment rate
is at the natural rate.
Copyright © 2012 Pearson Prentice Hall. All rights reserved.
6-14
CHAPTER 6
Unemployment and
Inflation
6.3
THE COSTS OF UNEMPLOYMENT
● unemployment insurance
Payments unemployed people
receive from the government.
Copyright © 2012 Pearson Prentice Hall. All rights reserved.
6-15
CHAPTER 6
Unemployment and
Inflation
APPLICATION
3
SOCIAL NORMS, UNEMPLOYMENT, AND PERCEIVED
HAPPINESS
APPLYING THE CONCEPTS #3: Are you less upset from being
unemployed if unemployment is common in your peer group?
Individuals do not like to become unemployed. A seven year British study showed that:
▪ Well-being declines when we become unemployed.
▪ If employed, having peers lose their job also decreases happiness.
▪ Interestingly, losing one’s job causes less of a decrease in well-being if peers
were also unemployed.
▪ In other words, misery loves company.
Why is this significant?
▪ The more unhappy an unemployed person is, the more aggressive they are
about finding another job.
▪ If your peer group is unemployed, you may be less aggressive about trying to
find another job.
Copyright © 2012 Pearson Prentice Hall. All rights reserved.
6-16
CHAPTER 6
Unemployment and
Inflation
6.4
THE CONSUMER PRICE INDEX AND THE
COST OF LIVING
REAL-NOMINAL PRINCIPLE
What matters to people is the real value of money or income—its
purchasing power—not the face value of money or income.
● Consumer Price Index
A price index that measures the cost
of a fixed basket of goods chosen to
represent the consumption pattern of
a typical consumer.
The CPI index for a given year, say year K, is defined as
Copyright © 2012 Pearson Prentice Hall. All rights reserved.
6-17
CHAPTER 6
Unemployment and
Inflation
6.4
THE CONSUMER PRICE INDEX AND THE
COST OF LIVING (cont’d)
FIGURE 6.5
Components of the
Consumer Price Index (CPI)
Rent and food and beverages
make up 44 percent of the CPI
basket. The remainder consists
of other goods and services.
The CPI versus the Chain Index for GDP
Copyright © 2012 Pearson Prentice Hall. All rights reserved.
6-18
CHAPTER 6
Unemployment and
Inflation
6.4
THE CONSUMER PRICE INDEX AND THE
COST OF LIVING (cont’d)
Problems in Measuring Changes in Prices
● cost-of-living adjustments
(COLAs)
Automatic increases in wages or
other payments that are tied to
the CPI.
Copyright © 2012 Pearson Prentice Hall. All rights reserved.
6-19
CHAPTER 6
Unemployment and
Inflation
APPLICATION
4
THE INTRODUCTION OF CELL PHONES AND THE BIAS IN THE
CPI
APPLYING THE CONCEPTS #4: How large is the bias in the CPI
due to not immediately incorporating new goods?
•Cell phones were introduced in 1983, but not included in the CPI until 1998
•According to Jerry Hausman of MIT, this resulted in an upward bias of the
telecommunication component of the CPI of 0.8 to 1.9 percent.
•The reported increase in telecommunication prices during this period might
have actually been a decrease of .8 percent.
•Room air conditioners also took 15 years to be included.
•Since new products are constantly being introduced, the bias in the CPI can
be large.
Copyright © 2012 Pearson Prentice Hall. All rights reserved.
6-20
CHAPTER 6
Unemployment and
Inflation
6.5
INFLATION
● inflation rate
The percentage rate of change in
the price level.
inflation rate = percentage rate of change of a price index
Copyright © 2012 Pearson Prentice Hall. All rights reserved.
6-21
CHAPTER 6
Unemployment and
Inflation
6.5
INFLATION (cont’d)
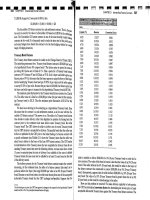
Historical U.S. Inflation Rates
FIGURE 6.6
Price Index for U.S. GDP, 1875–2009
After remaining relatively flat for 60 years, the price level began to steadily increase after World War II.
The price of a postage stamp in 1940 and 2009 illustrates the change in the overall price level that
occurred.
6-22
Copyright © 2012 Pearson Prentice Hall. All rights reserved.
CHAPTER 6
Unemployment and
Inflation
6.5
INFLATION (cont’d)
Historical U.S. Inflation Rates
Copyright © 2012 Pearson Prentice Hall. All rights reserved.
6-23
CHAPTER 6
Unemployment and
Inflation
6.5
INFLATION (cont’d)
Historical U.S. Inflation Rates
FIGURE 6.7
U.S. Inflation Rate, 1950–2009, Based on
Chain-Weighted Price Index
Inflation reached its highest peaks in the
postwar era during the decade of the 1970s
when the economy was hit with several
increases in oil prices.
In recent years, the inflation rate has been
relatively low.
Copyright © 2012 Pearson Prentice Hall. All rights reserved.
6-24
CHAPTER 6
Unemployment and
Inflation
6.5
INFLATION (cont’d)
The Perils of Deflation
● deflation
Negative inflation or falling prices
of goods and services.
Copyright © 2012 Pearson Prentice Hall. All rights reserved.
6-25