Principles of operations management 9th by heizer and render module d
Bạn đang xem bản rút gọn của tài liệu. Xem và tải ngay bản đầy đủ của tài liệu tại đây (880.81 KB, 52 trang )
D
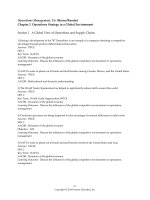
MODULE
Waiting-Line Models
PowerPoint presentation to accompany
Heizer and Render
Operations Management, Eleventh Edition
Principles of Operations Management, Ninth Edition
PowerPoint slides by Jeff Heyl
© 2014
© 2014
Pearson
Pearson
Education,
Education,
Inc.Inc.
MD - 1
Outline
►
►
►
►
►
Queuing Theory
Characteristics of a Waiting-Line
System
Queuing Costs
The Variety of Queuing Models
Other Queuing Approaches
© 2014 Pearson Education, Inc.
MD - 2
Learning Objectives
When you complete this chapter you
should be able to:
1. Describe the characteristics of arrivals,
waiting lines, and service systems
2. Apply the single-server queuing model
equations
3. Conduct a cost analysis for a waiting line
© 2014 Pearson Education, Inc.
MD - 3
Learning Objectives
When you complete this chapter you
should be able to:
4. Apply the multiple-server queuing
model formulas
5. Apply the constant-service-time
model equations
6. Perform a limited-population model
analysis
© 2014 Pearson Education, Inc.
MD - 4
Queuing Theory
▶ The study of waiting lines
▶ Waiting lines are common situations
▶ Useful in both
manufacturing
and service
areas
© 2014 Pearson Education, Inc.
MD - 5
Common Queuing Situations
TABLE D.1
Common Queuing Situations
SITUATION
ARRIVALS IN QUEUE
SERVICE PROCESS
Supermarket
Grocery shoppers
Checkout clerks at cash register
Highway toll booth
Automobiles
Collection of tolls at booth
Doctor’s office
Patients
Treatment by doctors and nurses
Computer system
Programs to be run
Computer processes jobs
Telephone company
Callers
Switching equipment to forward calls
Bank
Customer
Transactions handled by teller
Machine maintenance
Broken machines
Repair people fix machines
Harbor
Ships and barges
Dock workers load and unload
© 2014 Pearson Education, Inc.
MD - 6
Characteristics of Waiting-Line
Systems
1. Arrivals or inputs to the system
▶ Population size, behavior, statistical
distribution
2. Queue discipline, or the waiting line itself
▶ Limited or unlimited in length, discipline of
people or items in it
3. The service facility
▶ Design, statistical distribution of service times
© 2014 Pearson Education, Inc.
MD - 7
Parts of a Waiting Line
Population of
dirty cars
Arrivals
from the
general
population …
Queue
(waiting line)
Service
facility
Dave’s
Car Wash
Enter
Arrivals to the system
Arrival Characteristics
► Size of the population
► Behavior of arrivals
► Statistical distribution of
arrivals
© 2014 Pearson Education, Inc.
Exit the system
In the system
Waiting-Line
Characteristics
► Limited vs.
unlimited
► Queue discipline
Exit
Exit the system
Service Characteristics
► Service design
► Statistical distribution of
service
Figure D.1
MD - 8
Arrival Characteristics
1. Size of the arrival population
▶ Unlimited (infinite) or limited (finite)
2. Pattern of arrivals
▶ Scheduled or random, often a Poisson
distribution
3. Behavior of arrivals
▶ Wait in the queue and do not switch lines
▶ No balking or reneging
© 2014 Pearson Education, Inc.
MD - 9
Poisson Distribution
e-λλx
P(x) =
x!
where
© 2014 Pearson Education, Inc.
for x = 0, 1, 2, 3, 4, …
P(x)= probability of x arrivals
x = number of arrivals per unit of
time
λ = average arrival rate
e = 2.7183 (which is the base of
the natural logarithms)
MD - 10
Poisson Distribution
Figure D.2
e-λλx
x!
0.25 –
0.25 –
0.02 –
0.02 –
Probability
Probability
Probability = P(x) =
0.15 –
0.10 –
0.15 –
0.10 –
0.05 –
0.05 –
–
–
0 1 2 3 4 5 6 7 8 9
Distribution for λ = 2
© 2014 Pearson Education, Inc.
x
0 1 2 3 4 5 6 7 8 9 10 11 x
Distribution for λ = 4
MD - 11
Waiting-Line Characteristics
▶ Limited or unlimited queue length
▶ Queue discipline - first-in, first-out
(FIFO) is most common
▶ Other priority rules may be used in
special circumstances
© 2014 Pearson Education, Inc.
MD - 12
Service Characteristics
1. Queuing system designs
▶ Single-server system, multiple-server
system
▶ Single-phase system, multiphase system
2. Service time distribution
▶ Constant service time
▶ Random service times, usually a negative
exponential distribution
© 2014 Pearson Education, Inc.
MD - 13
Queuing System Designs
A family dentist’s office
Queue
Service
facility
Arrivals
Departures
after service
Single-server, single-phase system
A McDonald’s dual-window drive-through
Queue
Arrivals
Phase 1
service
facility
Phase 2
service
facility
Departures
after service
Single-server, multiphase system
Figure D.3
© 2014 Pearson Education, Inc.
MD - 14
Queuing System Designs
Most bank and post office service windows
Service
facility
Channel 1
Queue
Service
facility
Channel 2
Arrivals
Departures
after service
Service
facility
Channel 3
Multi-server, single-phase system
Figure D.3
© 2014 Pearson Education, Inc.
MD - 15
Queuing System Designs
Some college registrations
Queue
Arrivals
Phase 1
service
facility
Channel 1
Phase 2
service
facility
Channel 1
Phase 1
service
facility
Channel 2
Phase 2
service
facility
Channel 2
Departures
after service
Multi-server, multiphase system
Figure D.3
© 2014 Pearson Education, Inc.
MD - 16
Probability that service time ≥ 1
Figure D.4
1.0 –
Negative Exponential
Distribution
Probability that service time is greater than t = e-µt for t ≥ 1
µ = Average service rate
e = 2.7183
0.9 –
0.8 –
0.7 –
Average service rate (µ) = 3 customers per hour
⇒ Average service time = 20 minutes (or 1/3 hour)
per customer
0.6 –
0.5 –
0.4 –
0.3 –
Average service rate (µ) =
1 customer per hour
0.2 –
0.1 –
|
|
|
|
|
|
|
|
|
|
|
|
0.0 |–
0.00 0.25 0.50 0.75 1.00 1.25 1.50 1.75 2.00 2.25 2.50 2.75 3.00
Time t (hours)
© 2014 Pearson Education, Inc.
MD - 17
Measuring Queue Performance
1. Average time that each customer or object spends
in the queue
2. Average queue length
3. Average time each customer spends in the system
4. Average number of customers in the system
5. Probability that the service facility will be idle
6. Utilization factor for the system
7. Probability of a specific number of customers in the
system
© 2014 Pearson Education, Inc.
MD - 18
Queuing Costs
Cost
Figure D.5
Minimum
Total
cost
Total expected cost
Cost of providing service
Cost of waiting time
Low level
of service
© 2014 Pearson Education, Inc.
Optimal
service level
High level
of service
MD - 19
Queuing Models
The four queuing models here all assume:
1. Poisson distribution arrivals
2. FIFO discipline
3. A single-service phase
© 2014 Pearson Education, Inc.
MD - 20
Queuing Models
TABLE D.2
Queuing Models Described in This Chapter
MODEL
A
NAME
Single-server
system (M/M/1)
EXAMPLE
Information counter at
department store
NUMBER OF
SERVERS
(CHANNELS)
NUMBER
OF
PHASES
ARRIVAL
RATE
PATTERN
SERVICE
TIME
PATTERN
POPULATION QUEUE
SIZE
DISCIPLINE
Single
Single
Poisson
Exponential
Unlimited
© 2014 Pearson Education, Inc.
FIFO
MD - 21
Queuing Models
TABLE D.2
Queuing Models Described in This Chapter
MODEL
B
NAME
Multiple-server
(M/M/S)
EXAMPLE
Airline ticket counter
NUMBER OF
SERVERS
(CHANNELS)
NUMBER
OF
PHASES
ARRIVAL
RATE
PATTERN
SERVICE
TIME
PATTERN
POPULATION QUEUE
SIZE
DISCIPLINE
Multi-server
Single
Poisson
Exponential
Unlimited
© 2014 Pearson Education, Inc.
FIFO
MD - 22
Queuing Models
TABLE D.2
Queuing Models Described in This Chapter
MODEL
C
NAME
EXAMPLE
Constant-service
(M/D/1)
Automated car wash
NUMBER OF
SERVERS
(CHANNELS)
NUMBER
OF
PHASES
ARRIVAL
RATE
PATTERN
SERVICE
TIME
PATTERN
POPULATION QUEUE
SIZE
DISCIPLINE
Single
Single
Poisson
Constant
Unlimited
© 2014 Pearson Education, Inc.
FIFO
MD - 23
Queuing Models
TABLE D.2
Queuing Models Described in This Chapter
MODEL
D
NAME
EXAMPLE
Limited population
(finite population)
Shop with only a dozen
machines that might break
NUMBER OF
SERVERS
(CHANNELS)
NUMBER
OF
PHASES
ARRIVAL
RATE
PATTERN
SERVICE
TIME
PATTERN
POPULATION QUEUE
SIZE
DISCIPLINE
Single
Single
Poisson
Exponential
Limited
© 2014 Pearson Education, Inc.
FIFO
MD - 24
Model A – Single-Server
1. Arrivals are served on a FIFO basis and
every arrival waits to be served regardless
of the length of the queue
2. Arrivals are independent of preceding
arrivals but the average number of arrivals
does not change over time
3. Arrivals are described by a Poisson
probability distribution and come from an
infinite population
© 2014 Pearson Education, Inc.
MD - 25