Principles of operations management 9th by heizer and render module e
Bạn đang xem bản rút gọn của tài liệu. Xem và tải ngay bản đầy đủ của tài liệu tại đây (414.95 KB, 26 trang )
E
MODULE
Learning Curves
PowerPoint presentation to accompany
Heizer and Render
Operations Management, Eleventh Edition
Principles of Operations Management, Ninth Edition
PowerPoint slides by Jeff Heyl
© 2014
© 2014
Pearson
Pearson
Education,
Education,
Inc.Inc.
ME - 1
Outline
►
►
►
►
►
What Is a Learning Curve?
Learning Curves in Services and
Manufacturing
Applying the Learning Curve
Strategic Implications of Learning
Curves
Limitations of Learning Curves
© 2014 Pearson Education, Inc.
ME - 2
Learning Objectives
When you complete this chapter you
should be able to:
1. Define learning curve
2. Use the doubling concept to estimate
times
3. Compute learning-curve effects with
the formula and learning-curve table
approaches
4. Describe the strategic implications of
learning curves
© 2014 Pearson Education, Inc.
ME - 3
What Is a Learning Curves
▶ Based on the premise that people and
organizations become better at their tasks as
the tasks are repeated
▶ Time to produce a unit decreases as more
units are produced
▶ Learning curves typically follow a negative
exponential distribution
▶ Time savings per unit decreases over time
© 2014 Pearson Education, Inc.
ME - 4
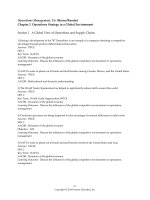
Learning Curve Effect
Exponential graph of learning
Cost or time per repetition
Figure E.1(a)
100 –
50 –
0
© 2014 Pearson Education, Inc.
|
|
|
|
25
50
75
100
Cumulative repetitions (volume)
ME - 5
Learning Curve Effect
Log-log graph of learning
Cost or time per repetition
100
Figure E.1(b)
50
40
30
20
10
© 2014 Pearson Education, Inc.
20
30
40
50
100
Cumulative repetitions (volume)
ME - 6
Learning Curves
T x Ln = Time required for the nth unit
T = unit cost or unit time of the first unit
L = learning curve rate
n = number of times T is doubled
First unit takes 10 labor-hours
70% learning curve is present
Fourth unit will require doubling twice — 1 to 2 to 4
Hours required for unit 4 = 10 x (.7)2 = 4.9 hours
© 2014 Pearson Education, Inc.
ME - 7
Learning Curve Examples
TABLE E.1
Examples of Learning-Curve Effects
CUMULATIVE
PARAMETER
LEARNINGCURVE
SLOPE (%)
1. Model -T Ford Price
production
Units produced
86
2. Aircraft
assembly
Direct labor-hours per
unit
Units produced
80
3. Equipment
maintenance
at GE
Average time to replace Number of
a group of parts
replacements
EXAMPLE
IMPROVING
PARAMETERS
© 2014 Pearson Education, Inc.
76
ME - 8
Learning Curve Examples
TABLE E.1
Examples of Learning-Curve Effects
IMPROVING
PARAMETERS
CUMULATIVE
PARAMETER
LEARNINGCURVE
SLOPE (%)
4. Steel
production
Production worker
labor-hours per unit
produced
Units produced
79
5. Integrated
circuits
Average price per unit
Units produced
72a
6. Handheld
calculator
Average factory selling
price
Units produced
74
EXAMPLE
a
Constant dollars
© 2014 Pearson Education, Inc.
ME - 9
Learning Curve Examples
TABLE E.1
Examples of Learning-Curve Effects
IMPROVING
PARAMETERS
CUMULATIVE
PARAMETER
LEARNINGCURVE
SLOPE (%)
7. Disk memory
drives
Average price per bit
Number of bits
76
8. Heart
transplants
1-year death rates
Transplants
completed
79
9. Caesarean
section baby
deliveries
Average operation time
Number of
surgeries
93
EXAMPLE
© 2014 Pearson Education, Inc.
ME - 10
Learning Curves in Services
and Manufacturing
►
Different organizations have different
learning curves
►
Any change in process, product, or
personnel disrupts the learning curve
© 2014 Pearson Education, Inc.
ME - 11
Learning Curves in Services
and Manufacturing
Internal:
Labor forecasting,
scheduling, establishing
costs and budgets
External: Supply-chain negotiations
Strategic: Evaluation of company and
industry performance,
including costs and pricing
© 2014 Pearson Education, Inc.
ME - 12
Applying the Learning Curve
▶ Doubling approach
▶ Simplest approach
▶ Labor cost declines at a constant rate, the
learning curve rate, as production doubles
▶ Does not work for other production
quantities
© 2014 Pearson Education, Inc.
ME - 13
Applying the Learning Curve
▶For an 80% learning rate
NTH UNIT PRODUCED
HOURS FOR NTH UNIT
1
100.0
2
80.0
= (.8 x 100)
4
64.0
= (.8 x 80)
8
51.2
= (.8 x 64)
16
41.0
= (.8 x 51.2)
© 2014 Pearson Education, Inc.
ME - 14
Formula Approach
Determine labor for any unit, TN , by
TN = T1(Nb)
where
© 2014 Pearson Education, Inc.
TN =
T1 =
b =
2)
=
time for the Nth unit
time to produce the first unit
(log of the learning rate)/(log
slope of the learning curve
ME - 15
Formula Approach
TABLE E.2
Determine labor for any unit, TN , by
Learning-Curve Values of b
TN = T1(Nb)LEARNING
RATE (%)
70
where
© 2014 Pearson Education, Inc.
TN =
T1 =
b =
2)
=
b
– .515
th
time for the N75
unit
– .415
time to produce the first unit
80
– .322
(log of the learning rate)/(log
85
– .234
slope of the learning
curve
90
– .152
ME - 16
Using Logs
Learning rate = 80%
First unit took 100 hours
TN = T1(Nb)
T3 = (100 hours)(3b)
= (100)(3log .8/log 2)
= (100)(3–.322)
= 70.2 labor hours
© 2014 Pearson Education, Inc.
ME - 17
Learning Curve Table Approach
TN = T1C
where
© 2014 Pearson Education, Inc.
TN = number of labor-hours
required to produce the Nth unit
T1 = number of labor-hours
required to produce the first unit
C = learning-curve coefficient
found in Table E.3
ME - 18
Learning-Curve Coefficients
TABLE E.3
Learning-Curve Coefficients, Where Coefficient,
C = N(LOG OF LEARNING RATE/LOG 2)
70%
UNIT
NUMBER
(N)
UNIT TIME
COEFFICIENT
85%
TOTAL TIME
COEFFICIENT
UNIT TIME
COEFFICIENT
TOTAL TIME
COEFFICIENT
1
1.000
1.000
1.000
1.000
2
.700
1.700
.850
1.850
3
.568
2.268
.773
2.623
4
.490
2.758
.723
3.345
5
.437
3.195
.686
4.031
10
.306
4.932
.583
7.116
15
.248
6.274
.530
9.861
20
.214
7.407
.495
12.402
© 2014 Pearson Education, Inc.
ME - 19
Coefficient Example
First boat required 125,000 hours
Labor cost = $40/hour
Learning factor = 85%
TN = T1C
T4 = (125,000 hours)(.723)
= 90,375 hours for the 4th boat
90,375 hours x $40/hour = $3,615,000
TN = T1C
T4 = (125,000 hours)(3.345)
= 418,125 hours for all four boats
© 2014 Pearson Education, Inc.
ME - 20
Coefficient Example
Third boat required 100,000 hours
Learning factor = 85%
New estimate for the first boat
100,000
= 129,366 hours
.773
© 2014 Pearson Education, Inc.
ME - 21
Strategic Implications
If a firm’s strategy is to follow a steeper curve
than the rest of the industry, they can do this
by:
1. Following an aggressive pricing policy
2. Focusing on continuing cost reduction and
productivity improvement
3. Building on shared experience
4. Keeping capacity ahead of demand
© 2014 Pearson Education, Inc.
ME - 22
Industry and Company Learning
Curves
Price per unit (log scale)
Le
ar
nin
g
Le
ar
cu
rve
co nin
m gc
for
pa
ur
ind
ny
ve
us
c o fo
try
r
st
pr
ic e
(c)
Loss
(b)
Gross profit
margin
Selling price
(a)
Figure E.2
Accumulated volume (log scale)
© 2014 Pearson Education, Inc.
ME - 23
Limitations of Learning Curves
▶ Learning curves differ from company
to company as well as industry to
industry so estimates should be
developed for each organization
▶ Learning curves are often based on
time estimates which must be
accurate and should be reevaluated
when appropriate
© 2014 Pearson Education, Inc.
ME - 24
Limitations of Learning Curves
▶ Any changes in personnel, design, or
procedure can be expected to alter the
learning curve
▶ Learning curves do not always apply to
indirect labor or material
▶ The culture of the workplace, resource
availability, and changes in the process
may alter the learning curve
© 2014 Pearson Education, Inc.
ME - 25