Customer satistaction and customer loyalty in Vietnamese mobile telecommunication Industry
Bạn đang xem bản rút gọn của tài liệu. Xem và tải ngay bản đầy đủ của tài liệu tại đây (805.89 KB, 64 trang )
UNIVERSITY OF ECONOMICS HO CHI MINH CITY
INTERNATIONAL SCHOOL OF BUSINESS
TRINH KIM HOA
Customer Satisfaction and Customer
Loyalty in Vietnamese Mobile
Telecommunication Industry
MASTER OF BUSINESS (Honours)
Supervisor: LUU TRONG TUAN, Ph.D
ACKNOWLEDGEMENT
Firstly, I would like to express the deepest gratitude to my research supervisor, Dr. Luu
Trong Tuan, for his extensive support, suggestions and guidance during the time of doing
master thesis.
Secondly, I would like to show my appreciation and gratefulness to Professor Nguyen Dong
Phong, Professor Nguyen Dinh Tho and Dr. Tran Ha Minh Quan for their dedication and
valuable times as the members of proposal and draft thesis examination committee. Their
comments and recommendations are greatly helpful for completing my dissertation.
Thirdly, my great thanks are given to professors, lecturers, tutors for their teaching and
dedication during my MBA course at International School of Business-University of
Economics HCM city.
Lastly, I am so grateful to my MBA classmates, friends and colleagues for their significant
contribution and support to the success of this thesis.
1
ABSTRACT
This study was aimed at investigating three factors (service quality, brand image and
price perception) and assessed the degree of the impact of each factor on customer
satisfaction, especially the relationship between customer satisfaction and customer
loyalty in Vietnamese mobile telecom sector where there have been the existence of the
fierce competition, mature market and internationally integrated economy, ultimately
struggling for market share and survival.
The method of qualitative research (in-depth interview) was used to modify the draft
questionnaires on the purpose of removing the ambiguity and enhance the clarity before
they was officially launched in the main research. Then, the quantitative research was
conducted to gather the data for analysis. The data was analyzed by three methods,
namely, Cronbach’s Alpha analysis, Exploratory Factor Analysis and Standard Multiple
Regression.
The results indicated that each factor (service quality, brand image, price perception) has
a positive impact on customer satisfaction at the different level as well as a significantly
positive relationship between customer satisfaction and customer loyalty in mobile
telecommunication industry in Vietnam. The results of this study are consistent with the
findings and evidence in the extant literature. The study provides the important feedback
from customers to mobile telecom suppliers. The findings are expected to be marketing
insights for Vietnamese mobile telecom managers so that they can develop the sound
marketing strategies in today’s competitive and costly market.
Key words: service quality; brand image; price perception; customer satisfaction;
customer loyalty; mobile telecommunication industry.
2
TABLE OF CONTENTS
ACKNOWLEDGEMENT………………………………………………………1
ABSTRACT……………………………………………………………………..2
LIST OF TABLES………………………………………………………………5
LIST OF FIGURES……………………………………………………………..6
CHAPTER 1: INTRODUCTION……………………………………………..7
1.1 Research background ……………………………………………………………….7
1.2 Research problems…………………………………………………………………..8
1.3 Research objectives………………………………………………………………….9
1.4 Research methodology and scopes…………………………………………………10
1.5 Structure of research………………………………………………………………..11
CHAPTER 2: LITERATURE REVIEW…………………………………..13
2.1. Overview of mobile telecommunication industry in Vietnam……………………13
2.2. Customer loyalty………………………………………………………………….14
2.3. Customer satisfaction and customer loyalty……………………………………...16
2.4. Service quality and customer satisfaction………………………………………...17
2.5. Price perception and customer satisfaction……………………………………….19
2.6. Brand image and customer satisfaction…………………………………………..20
2.7. Research model and hypotheses………………………………………………….21
CHAPTER 3: RESEARCH METHODOLOGY…………………………..23
3.1. Research design …………………………………………………………………23
3.1.1. Qualitative research……………………………………………………………25
3.1.2. Quantitative research…………………………………………………………..26
3
3.2. Data analysis methods …………………………………………………………..29
CHAPTER 4: DATA ANALYSIS AND FINDINGS………………………30
4.1. Descriptive statistics of research samples……………………………………….30
4.2. Reliability test: Cronbach’s alpha test…………………………………………...33
4.3. Exploratory Factor Analysis……………………………………………………..36
4.4. Hypotheses testing……………………………………………………………….38
4.4.1. Testing assumptions of multiple regression……………………………………38
4.4.2. Testing hypotheses on the impacts of factors (service quality, brand image, price
perception) on customer satisfaction………………………………………………….39
4.4.3. Testing hypothesis on the impact of customer satisfaction on customer
loyalty…………………………………………………………………………………42
4.4.4. Summary of hypotheses testing results ………………………………………..43
CHAPTER 5:CONCLUSIONS, IMPLICATIONS AND LIMITATIONS.44
5.1. Conclusions………………………………………………………………………44
5.2. Managerial implications………………………………………………………….45
5.3. Limitations and further research direction……………………………………….46
REFERENCES………………………………………………………………...48
APPENDIX A-GUIDELINE FOR QUALITATIVE IN-DEPTH INTERVIEW…………..54
APPENDIX B-QUESTIONNAIRE IN ENGLISH…………………………………………56
APPENDIX C- QUESTIONNAIRE IN VIETNAMESE………………………………….59
APPENDIX D-HISTOGRAM, NORMAL P-P PLOT OF REGRESSION, SCATTER PLOT
OF DEPENDENT VARIABLE: CUSTOMER SATISFACTION…………………………62
APPENDIX E- HISTOGRAM, NORMAL P-P PLOT OF REGRESSION, SCATTER PLOT
OF DEPENDENT VARIABLE: CUSTOMER LOYALTY……………………………….63
4
LIST OF TABLES
Table 4.1 Descriptive statistics of research samples………………………………………...31
Table 4.2 Reliability Test Result…………………………………………………………….34
Table 4.3 Total variance explained of independent variables……………………………….37
Table 4.4 Rotated component matrix of independent variables……………………………..37
Table 4.5 Component matrix of mediator variable-customer satisfaction…………………..38
Table 4.6 Component matrix of dependent variable-customer loyalty……………………...38
Table 4.7 Pearson correlation………………………………………………………………..39
Table 4.8 Model summary of Testing hypotheses on the impacts of factors (service quality,
brand image, price perception) on customer satisfaction…………………………………….40
Table 4.9 ANOVAb Result of Testing hypotheses on the impacts of factors (service quality,
brand image, price perception) on customer satisfaction…………………………………….40
Table 4.10 Coefficientsa Result of Testing hypotheses on the impacts of factors (service
quality, brand image, price perception) on customer satisfaction……………………………41
Table 4.11 Model Summary of Testing hypothesis on the impact of customer satisfaction on
customer loyalty……………………………………………………………………………..42
Table 4.12 ANOVAb Results of Testing hypothesis on the impact of customer satisfaction
on customer loyalty………………………………………………………………………….42
Table 4.13 Coefficientsa Result of Testing hypothesis on the impact of customer satisfaction
on customer loyalty………………………………………………………………………….43
Table 4.14 Results of hypotheses testing……………………………………………………43
5
LIST OF FIGURES
Figure 2.1 Research model…………………………………………………………………21
Figure 3.1 Research process………………………………………………………………..25
Figure D1: Histogram of Customer Satisfaction……………………………………………62
Figure D2: Normal Plot of Customer Satisfaction………………………………………….62
Figure D3: Scatter Plot of Customer Satisfaction…………………………………………..62
Figure E1: Histogram of Customer Loyalty………………………………………………..63
Figure E2: Normal Plot of Customer Loyalty………………………………………………63
Figure E3: Scatter Plot of Customer Loyalty……………………………………………….63
6
Chapter 1: INTRODUCTION
1.1 Research background
Mobile telecommunication industry has been playing an economically important role in
today’s increasingly fast-growing society. Therefore, not surprisingly, this has inspired many
researchers, marketers as well as management scholars to do many researches in this sector.
Since the 1990s, mobile telecommunication service has soon become a dynamic sector of
economic development in the industrialized nations. That is not only because of the rapid
development of technology but also because of the increasing amount of network operators.
In addition, the fiercely high competition among mobile telecom service providers is
inevitable in this field.
It has been proved in many empirical studies that as market becomes increasingly
competitive and difficult, the companies tend to make many efforts to maintain the market
share by focusing on satisfying and retaining the existing customers. Because of the high cost
of reaching and attracting new customers, it is extremely important for companies to
strategically concentrating on customer retention and customer loyalty. Hence, how to satisfy
and make customers increasingly loyal is becoming a strategic goal for any business.
Vietnamese mobile telecommunication market is no longer a market of monopoly.
Internationally-integrated economy has had an impact on mobile telecom industry in everfiercely competitive market. According to the Department of Telecommunications (Ministry
of Information and Telecommunications), by the end of May 2013, the number of telephone
subscribers on the entire network of Vietnam totaled 132.8 million. More particularly, mobile
subscribers occupied 122.79 million( 92.5 percent) and 10 million was for landline
7
subscribers( 7.5 percent). With the population of approximately 88 million people, one
person uses an average of about 1.5 mobile numbers (Ha, 2013).
In its report “Research and Markets: 2013 Vietnam Telecommunications Services Report”,
Business Wire (2013) stated that 2011-2012 was a busy and difficult period for the
telecommunications sector in Vietnam. The mobile telecommunication industry has left its
hot growth stage to dig deeper in the saturated area. There will be no more leapfrogging in
revenue streams and the number of subscribers.
Obviously, mobile telecommunication services providers need to fully realize the relevance
and significance of the oriented-customer business strategy as a condition for sustaining the
competitive advantages and achieving profitable targets. When the number of subscribers
reach a level of saturation, acquiring new customers is not only complicated but also costly
from marketing point of view. It is widely believed that the fundamental marketing strategy
in the future is to maintain the existing customers by capitalizing upon the customer
satisfaction, thus leading to customer loyalty. As a result, the strategic focus of how to
investigate the factors influencing on customer satisfaction and customer loyalty is a business
and research necessity for management in mobile telecommunication industry.
1.2 Research problems
Vietnamese mobile network suppliers have been struggling with the increasingly fierce
competition at not only domestic level but also international level. In addition, there has been
the state of the slower growth rate and saturated market. Under these circumstances, a
defensive strategy is much more significant than an aggressive one, which expands the size of
the overall market by persuading the potential customers (Fornell,1992). Therefore, it would
be time for management of each Vietnamese mobile network supplier to find out the best
ways on how to keep, retain and satisfy customers, thereby making them to be more and more
8
loyal to mobile telecom services the operaters provide, and more importantly, for customer
profitability. Needless to say, deriving from managerial statement, it is imperative for mobile
telecom services providers to invetigate the main factors which affect customer satisfaction,
thus creating customer loyalty in Vietnamese mobile telecom market.
Many researchers have especially emphasized the importance of service quality, brand
image and price perception in correlation with customer satisfaction and customer loyalty in
service industry (Sureshchandar et al., 2002; Parasuraman et al.,1985; Saravana & Rao, 2007;
Oliver, 1997; Han and Ryu, 2009; Hermann et al., 2007; Davies et al., 2003; Wu, 2011).
Besides, the relationship between customer satisfaction and customer loyalty has been
evaluated comprehensively in many studies (Szymanski and Henard, 2001; Guiltinan, Paul
and Madden, 1997; Fornell, 1992; Oliver, 1999; Lee et al., 2001; Jones and Sasser, 1995; Bei
and Chiao, 2001).
While the impacts of some main factors (such as service quality, brand image, price
perception) on customer satisfaction as well as the relationship between customer satisfaction
and customer loyalty have been intepreted and analysed in the many studies in developed
countries mentioned above, there are very few studies on this in Vietnam, especially in
mobile telecommunication industry. Therefore, it is determined that this study focuses only
on three factors (service quality, brand image and price perception) to evaluate their impacts
on customer satisfaction and customer loyalty in Vietnamese mobile telecommunication
industry.
1.3 Research objectives
Because of the problem identification discussed previously, there are some research
objectives that have to be achieved:
9
1. Evaluate the degree of the impact of service quality on customer satisfaction in
Vietnamese mobile telecommunication industry
2. Evaluate the degree of the impact of brand image on customer satisfaction in
Vietnamese mobile telecommunication industry
3. Evaluate the degree of the impact of price perception on customer satisfaction in
Vietnamese mobile telecommunication industry.
4. Evaluate the degree of the impact of customer satisfaction on customer loyalty in
Vietnamese mobile telecommunication industry.
Based on the research objectives mentioned above, this research has to answer some
questions:
1. To what extent does service quality affect customer satisfaction in Vietnamese mobile
telecommunication industry?
2. To what extent does brand image affect customer satisfaction in Vietnamese mobile
telecommunication industry?
3. To what extent does price perception affect customer satisfaction in Vietnamese
mobile telecommunication industry?
4. To what extent does customer satisfaction affect customer loyalty in Vietnamese
mobile telecommunication industry?
1.4. Research methodology and scopes
The qualitative research and quantitative research are conducted in this study. The author
uses the software of SPSS 16.0 to analyze the data. Particularly, three data analysis methods
used: Cronbach’s Alpha for testing the scale reliability, Exploratory Factor Analysis for
testing the scale validity and Multiple Regression to test the relationships between
independent variables and dependent variable.
10
Only three factors (service quality, brand image, price perception) that affect customer
satisfaction and customer loyalty are focused and analyzed, other factors are beyond this
study. This research is conducted only in Ho Chi Minh city and participants in survey are
those who are using the mobile telecommunication services. The study examines the
customers’ point of view, not the mobile telecom service suppliers’ perspectives. This study
only focuses on the mobile telecommunication industry, other industries are out of research
scope.
1.5 Structure of research
Structure of this study consists five chapters:
Chapter 1: Introduction
This chapter presents research background, research problems, research objectives, research
methodology and research scopes.
Chapter 2: Literature review
This chapter starts with the overview of Vietnamese mobile telecommunication industry.
Then, more importantly, the author provides the definitions and literature review of customer
satisfaction, customer loyalty, service quality, brand image, price perception. Literature
review on relationship between customer satisfaction and customer loyalty, customer
satisfaction and service quality, customer satisfaction and brand image, customer satisfaction
and price perception are also presented. Finally, research model and hypotheses are proposed
in Vietnamese mobile telecom industry.
Chapter 3: Research methodology
11
Particularly, this chapter presents research design including qualitative research and
quantitative research, research processes and data analysis methods.
Chapter 4: Data analysis and findings
This chapter presents the results of research after analyzing the data. Based on the results, the
author makes the analysis of the extent of the impact of each factor on customer satisfaction,
as well as the degree of impact of customer satisfaction on customer loyalty.
Chapter 5: Conclusions, implications and limitations
This chapter presents the main findings of research, managerial implications as well as the
limitations of this study.
12
Chapter 2: LITERATURE REVIEW
In this chapter, firstly, it is necessary to have the general picture of mobile telecommunication
in Vietnam. Then, the author presents the literature related to customer loyalty, customer
satisfaction, service quality, brand image and price perception. More importantly, the
relationships between customer satisfaction and customer loyalty, service quality and
customer satisfaction, price perception and customer satisfaction, brand image and customer
satisfaction are reviewed in many empirical studies. Based on this literature review, finally,
research model and hypotheses are proposed.
2.1. Overview of mobile telecommunication industry in Vietnam
In 1993, Vietnam’s first mobile telecommunication network, MobiFone, was put into
operation. At first, MobiFone’s network had a limited number of subcribers, limited
network coverage and expensive telecommunication terminal equipment. MobiFone had
3,200 subscribers in 1994, 15,000 in 1995 and 30,000 in 1996 (ICTnews, 2013)
It is estimated that there will be 156.5mn mobile subscribers by the end of the year 2017, a
penetration rate of 166.3% (Business Monitor International, 2014). The International
Telecommunication Union( ITU) has ranked Vietnam’s mobile phone subscription density
eighth in the world.
According to the Department of Telecommunications (Ministry of Information and
Telecommunications), by the end of May 2013, the number of telephone subscribers on the
entire network of Vietnam totaled 132.8 million. More particularly, mobile subscribers
occupied 122.79 million( 92.5 percent) and 10 million was for landline subscribers( 7.5
percent). With the population of approximately 88 million people, one person uses an average
of about 1.5 mobile numbers(Ha, 2013). This is found to be a quite fast development
pace. Currently, there are five major network providers, of which three suppliers account for
13
the bulk of the market: Viettel (holding 40 percent), Vinaphone (holding 30 percent) and
Mobifone (holding 20 percent); the remaining two mobile network suppliers are
Vietnamobile and Gtel-mobile(Ha, 2013).
Because of the new challenges, the fierce competition, saturated market and especially
industry changes such as new players, regulations, innovations in mobile
telecommunications market, it is extremely important for mobile network providers to work
out the long-term strategy on how to make customers to be increasingly loyal to mobile
brands they have been using. More importantly, investigating and researching on the factors
that influence significantly on customer satisfaction and loyalty is inevitable and dispensable
if mobile telecommunication companies in Vietnam are expected to survive and thrive in
today’s fiercely competitive market.
2.2. Customer loyalty
Oliver (1997, p.392) defined customer loyalty as a “deeply held commitment to rebury or
repatronize a preferred product or service consistently in the future, thereby causing repetitive
same-brand or same brand-set purchasing, despite situational influences and marketing
efforts having the potential to cause switching behavior” .
Chu (2009) pointed out that loyalty is a positive attitude and behavior related
to the level of repurchasing commitment to a brand in the future . Loyal customers are less
likely to switch to a competitor solely because of price, and they even make more purchases
than non-loyal customers. Loyal customers are considered to be the most important assets of
a company. Therefore, not surprisingly, Tseng(2007) said that it is extremely important for
companies to keep loyal customers who will contribute long-term benefits to the business
organizations.
14
To enhance the financial growth of a company, thing should be done is to make existing
customers increase their purchases (Hayes, 2008). Moreover, organization’s financial growth
is dependent on a company’s competency to retain existing customers at a faster rate than it
acquires new ones (Hayes, 2008). Hence, management should understand that the road to
growth is to focus on customers – not only attracting new customers but also maintaining
existing customers, motivating them to spend more and getting them to recommend products
and services to the other people (Keiningham et al., 2008).
According to Aydin and Ozer(2005), customer loyalty has been generally divided into
attitudinal loyalty and behavioral loyalty. They stated that attitudinal loyalty describes
customer’s attitude toward loyalty by measuring customer preference, buying intention,
supplier prioritization and recommendation willingness. Meanwhile, behavioral loyalty
relates to shares of purchase, purchasing frequency. Wulf et al. (2001) defined the construct
of behavioral loyalty as a composite measure based on a consumer’s purchasing frequency
and amount spent at a retailer compared with the amount spent at other retailers from whom
the consumer buys. Morgan and Hunt (1994) found significant relationships between the
level of a buyer’s relationship commitment and his acquiescence, propensity to leave, and
cooperation, all of which can be regarded as behavioral outcomes of relationships.
Conceptualization and measurement of loyalty concept has become more and more complex
(Jones and Taylor, 2007). Reichheld (2003) found that, in service industry, loyalty can be
measured by one special indicator-willingness to recommend.
Ball et al. (2004) reviewed the literature related to the determinants of loyalty, not only in the
business-to-business but also in business-to-consumer cases. They stated that investigating
customer loyalty and its antecedents in the different markets and countries may produce
significant variance in the loyalty interpretation.
Jacoby and Kyner (1973) emphasized that loyalty has to be: biased, behavioural
15
response, expressed over time, by some decision-making units, with respect to one or more
alternative brands out of a set of such brands and a function of psychological processes.
2.3. Customer satisfaction and customer loyalty
The most widely accepted conceptualisation of the customer satisfaction concept is the
expectancy disconfirmation theory. This theory was invented by Oliver (1980), who
suggested that satisfaction level is a result of the difference between expected and perceived
performance. Satisfaction (positive disconfirmation) occurs when product or service is better
than expected. Conversely, a performance worse than expected results in dissatisfaction
(negative disconfirmation).
Fornell (1992) defined satisfaction as an overall evaluation dependent on the total purchase
and consumption experience of the target product or service performance compared with
repurchase expectations over time.
Fornell (1992) also found that high customer satisfaction will lead to the increased loyalty for
the company and, more importantly, customers will be less likely to make overtures to
competitors. Likewise, Jones and Sasser (1995) described that an increase in customer
satisfaction bring about a stronger influence on loyalty among customers who are at the high
end of the satisfaction scale.
Guiltinan, Paul and Madden (1997) also investigated that satisfied customers tend to
be repeated (and even become loyal) customers and are less likely to switch to other service
providers. Many scholars have believed that customer satisfaction is one of the best indicators
of a company’s future profit and competitiveness. The results of customer satisfaction include
customer loyalty (Bei and Chiao, 2001). Both marketing academics and professionals have
aimed to identify the most noticeable determinants of customer loyalty. Researchers have
recognized a bond between customer satisfaction and loyalty. In meta-analysis study,
Szymanski and Henard (2001) demonstrated 15 positive and significant interconnections
16
between the two constructs. Bearden and Teel (1983) have also indicated a relationship
between satisfaction and loyalty. Meanwhile, Jones et al. (1995) found out that this
relationship is not a simple linear one and the resulting behaviors may depend on consumer
attributions (their belief in the causes of the customer satisfaction and dissatisfaction
assessment). Furthermore, some academics pointed out that switching costs, a moderating
variable, can substantially impact customer loyalty through customer satisfaction (Fornell,
1992; Oliver, 1999; Lee et al., 2001) and perceived value (Woodruff, 1997; Neal, 1999).
Evidently, it is widely recognized that customer satisfaction is a driver of customer loyalty.
However, the number of findings in services marketing literatures and empirical studies over
the past decade has shown that, in service industry, customer satisfaction and loyalty do not
always correlate positively (Silvestro and Cross, 2000; Kamakura, 2002; Pritchard and
Silvestro, 2005).
Based on literatures and findings on customer satisfaction and customer loyalty discussed
above, the hypothesis is proposed in Vietnamese mobile telecommunication industry:
H4: Customer satisfaction has a positive impact on customer loyalty
2.4. Service quality and customer satisfaction
Gronroos (2000, p.46) stated that “a service is a process consisting of a series of more or less
intangible activities that normally, but not necessarily always, take place in interactions
between the customers and service employees and/or physical resources or goods and/or
systems of the service provider, which are provided as solutions to customer problems”. This
definition showed that service is a process in which interactions between customer and
service provider most often exist. Hence, in a service context, relationship between customer
and service provider can be utilised as a basis for marketing strategies (Gronroos, 2000).
Service quality is defined as “an overall assessment of services by the customers”(Ganguli
&Roy, 2010, p.405). In service industry, service quality is evaluated by interaction and
17
interconnection between customers and firm employees. This implies that “quality
evaluations are made not solely on outcomes of a service, they also involve the evaluations of
process of service delivery”(Parasuraman, Zeithaml and Berry, 1988, p.42). It is also stated
that service quality is a critical and indispensable factor in persuading customers to use a
particular service provider instead of another (Kandampully, 1998).
With respect to the relationship between customer satisfaction and service quality, Oliver
(1993) first maintained that service quality would be a determinant of customer satisfaction
irrespective of whether these constructs were cumulative or transaction-specific. Some
researchers have identified the empirical evidences for the viewpoint mentioned above
(Anderson & Sullivan, 1993; Fornell et al 1996; Spreng & Macky 1996) in which customer
satisfaction came as an outcome of service quality.
Although it is proven that other factors such as price and product quality can impact on
customer satisfaction, service quality is a antecedent to customer satisfaction (Zeithaml et al.,
2006). This finding is in line with the invention of Wilson et al. (2008) and has been
supported by the definition of customer satisfaction demonstrated by other researchers.
It is evident that, based on past studies of service quality and customer satisfaction, customer
satisfaction and service quality themselves are interconnected from their definitions to
relationships. Parasuraman et al. (1985) explained that when perceived service quality is
high, then it will lead to increase in customer satisfaction. Some other scholars did grasp the
idea proposed by Parasuraman (1995) and they significantly recognized that “Customer
satisfaction is based upon the level of service quality that is provided by the service
providers” (Saravana & Rao, 2007, p. 436; Lee et al., 2000, p. 226).
Sureshchandar et al. (2002) in their research on relationship of customer satisfaction and
service quality, pointed out that these two variables are positively related, confirming that the
definitions of both variables are always been connected. They also determined that “service
18
quality is more abstract, since it may be influenced by perceptions of value or by the
experiences of others that may not be so good, than customer satisfaction which reflects the
customer’s feelings about many encounters and experiences with service firm”.
(Sureshchandar et al., 2002, p. 372).
Therefore, based on literature review mentioned above, the hypothesis is proposed in
Vietnamese mobile telecommunication industry:
H1: Service quality has a positive impact on customer satisfaction
2.5. Price perception and customer satisfaction
Zeithal (1988, p.10) has defined the price as “ what is given up and sacrificed to obtain a
product”. Price is an essential determinant of customer satisfaction as it is extrinsic indicator
of quality. Jacoby and Olson(1977) distinguished price as objective price and perceived price.
They defined objective price as the actual price of a product or service. Meanwhile,
perceived price is the price that is encoded by consumer(Zeithaml, 1988).
Chang and Wildt(1994) defined the perceived price as consumers’ perceptual representation
or subjective perception of the objective price of product or service. Varki and Colgate(2001)
stated that price perception is created in comparison with the internal reference prices.
Customers tend to choose their service providers based on the perceived price. Because of
different needs and wants among individuals, how much consumers are willing to pay for the
same service is to vary. Higher price perception might negatively affect purchasing
probabilities (Peng and Wang, 2006). Perceived price is also found to be related to price
searching (Lichtenstein et al., 1993). The likelihood is that consumers usually are attracted by
perceived high-quality services at perceived competitive prices during the searching process.
Oliver (1997) stated that consumers often evaluate the price in relation to service quality,
thus generating satisfaction or dissatisfaction. If consumers see price to be fair, they are more
likely to enter into transactions with the service providers. Based on previous researches,
19
Cheng et al. (2008) suggested that perceived price can be measured by two constructs: one is
rationality of prices, which reflects the way that price is perceived by customers compared
with that of competitors; another is value for money, which implies the relative status of the
service provider in terms of price.
Many researchers have maintained that price perception affects customer satisfaction
(Oliver, 1997; Peng and Wang, 2006; Cheng et al., 2008; Kim et al., 2008). Peng and
Cheng(2006) believed that customers often switch to another service providers mainly
because of some pricing issues such as high price perception , unfair or deceptive pricing
policies. In service industry, Singh and Serdeshmurkh (2000) have also pointed out that price
significantly influences customer satisfaction. Han and Ryu (2009) identified that price
perception impact considerably on customer satisfaction in restaurant industry. Hermann et
al. (2007) found that perceived price has a positive influence on customer satisfaction.
Therefore, the hypothesis is proposed in Vietnamese mobile telecommunication industry:
H2: Price perception has a positive impact on customer satisfaction
2.6. Brand image and customer satisfaction
Brand concept has been usually interpreted and analyzed in marketing literatures. Not only is
brand building a pivotal driver for marketing physical products, it is but also an important
issue for service firms. Keller (1993, p3) defined brand image as “the perceptions about a
brand held in consumers’ memory”. A similar definition to Keller's was suggested by Aaker
(1991), whereby brand image is mentioned as "a set of associations, usually organized in
some meaningful way" (p. 109). Furthermore, Biel (1992) defined brand image as "a cluster
of attributes and associations that consumers connect to the brand name" (p. 8).
Gronroos (2000, p.287) stated that “A brand is not first built and then perceived by the
customers. Instead, every step in the branding process, every brand message, is separately
perceived by customers and together add up to brand image, which is formed in customers’
20
mind”. Hence, brand image is an outcome of how a customer makes perceptual relationship
with a brand over time. The advancement of a brand relationship with customers is based on
a series of brand contacts experienced by customers (Gronroos, 2000). Importantly, service
providers need to form a positive brand image in customers’ mind, thus conveying brand
value to customers and creating a supportive word of mouth among people.
Corporate brand image has been evaluated as an important antecedent of customer
satisfaction and loyalty (Wu, 2011). Davies et al. (2003) noted that there has been a positive
relationship between corporate brand image and satisfaction. Martineau (1958) said that if
consumers advocate image of the store, they will be more likely to develop a certain degree
of satisfaction and loyalty. Selnes (1993) also determined the impact of brand image on
customer satisfaction. However, Davies and Chun (2002) maintained that brand image had an
indirect impact on brand loyalty via customer satisfaction.
Therefore, based on the literature review discussed above, the hypothesis is proposed in
Vietnamese mobile telecommunication industry:
H3: Brand image has a positive impact on customer satisfaction
2.7. Research model and hypotheses
Considering the importance of customer loyalty in today’s business, it will
make sense to find out, interpret and analyze the factors that affect customer satisfaction,
which is a main force of customer loyalty. Consequently, based on the literature review and
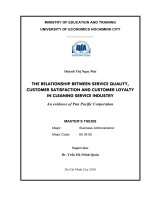
empirical studies mentioned above, research model is proposed as follows:
21
Service Quality
Price Perception
Customer Satisfaction
Customer Loyalty
Brand Image
Figure 2.1 Research model
To summarize, there are four hypotheses that researcher wants to test in Vietnamese mobile
telecomunication industry:
H1: Service quality has a positive impact on customer satifaction
H2: Price perception has a positive impact on customer satisfaction
H3: Brand image has a positive impact on customer satisfaction
H4: Customer satisfaction has a positive impact on customer loyalty
22
Chapter 3: RESEARCH METHODOLOGY
In this chapter, at first, the author presented how to design the research. Next, some main
steps of the qualitative and quantitative research were interpreted. Finally, some data analysis
methods were briefly mentioned.
3.1. Research design
Target population
The objective of this study is to determine the degree of the impact of service quality, brand
image and price perception on customer satisfaction and customer loyalty in Vietnamese
mobile telecommunication sector. Therefore, the customers who are using mobile
telecommunication services (such as Viettle, Vinaphone, Mobiphone, Vietnamobile and
Gmobile) are target sample population of this research.
Measurement scale
Scales of this study were based on theories, findings and scales that many researchers used in
their empirical studies. Most of scales were borrowed from Godfred et al. (2012), who also
adapted the scales from the other researchers.
Service quality was measured by 4 items adapted from Gronroos(2000):
-Supplier X follows up in a timely manner to customer requests
-The customer care officials of supplier X are always willing to help me
-The response to consumers’ complaints of supplier X is always taken quickly
-My calls, text messages and internet services of supplier X always go through,
hardly encountering network problems
23
Price perception was measured by 3 items adapted from Cheng et al.(2006):
-The pricing policies of services from this supplier X are attractive
-The calling rate offered by supplier X is reasonable
-Supplier X is offering flexible pricing for various services that meet my needs.
Brand image was measured by 4 items adapted from Gronroos(2000):
-I consider that reputation of supplier X is popular and admired by many people
-I have a good feeling about social responsibility of supplier X
-I have a clear image of supplier X
-Supplier X is very familiar to me
Customer satisfaction was measured by 4 items adapted from Oliver (1997)
and Fornel(1992):
- I am satisfied with the overall service quality offered by supplier X
- I am satisfied with the performance of the frontline employees of supplier X
-I am comfortable about the relationship with supplier X
-I am satisfied with the professional competence of supplier X
Customer loyalty was measured by 5 items adapted from Aydin and Ozer
(2005):
-I will encourage friends and relatives to use the services offered by this operator
-If I want an additional telecom service, I am willing to continue selecting supplier
X
-Even if another operator’ price is lower, I will go on using supplier X
-I am willing to say positive things about supplier X to other people
24