Statistics for business decision making and analysis robert stine and foster chapter 04
Bạn đang xem bản rút gọn của tài liệu. Xem và tải ngay bản đầy đủ của tài liệu tại đây (445.02 KB, 42 trang )
Chapter 4
Describing Numerical
Data
Copyright © 2011 Pearson Education, Inc.
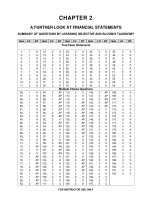
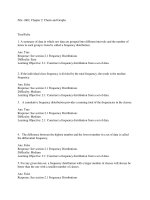
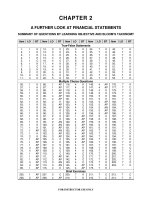
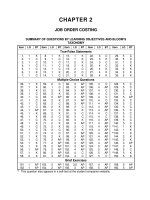
4.1 Summaries of Numerical Variables
Can 500 different songs fit on the iPod
Shuffle?
To answer this question we must understand the
typical length of a song and the variation of song
sizes around the typical length
We can do this using summary statistics
3 of 42
Copyright © 2011 Pearson Education, Inc.
4.1 Summaries of Numerical Variables
A Subset of the Data
4 of 42
Copyright © 2011 Pearson Education, Inc.
4.1 Summaries of Numerical Variables
The Median
Value in the middle of a sorted list of numerical
values (a typical value)
Half of the values fall below the median; half fall
above
It is the 50th Percentile
5 of 42
Copyright © 2011 Pearson Education, Inc.
4.1 Summaries of Numerical Variables
Common Percentiles
Lower Quartile = 25th Percentile
Upper Quartile = 75th Percentile
One quarter of the values fall below the lower
quartile and one quarter fall above the upper
quartile
6 of 42
Copyright © 2011 Pearson Education, Inc.
4.1 Summaries of Numerical Variables
The Interquartile Range (IQR)
IQR = 75th Percentile – 25th Percentile
A measure of variation based on quartiles
Used to accompany the median
7 of 42
Copyright © 2011 Pearson Education, Inc.
4.1 Summaries of Numerical Variables
The Range
Range = Maximum - Minimum
Maximum Value = 100th Percentile
Minimum Value = 0th Percentile
Another measure of variation; not preferred
because based on extreme values
8 of 42
Copyright © 2011 Pearson Education, Inc.
4.1 Summaries of Numerical Variables
The Five Number Summary
Minimum
Lower Quartile
Median
Upper Quartile
Maximum
9 of 42
Copyright © 2011 Pearson Education, Inc.
4.1 Summaries of Numerical Variables
The Five Number Summary for Song Sizes
Minimum = 0.148 MB
Lower Quartile = 2.85 MB
Median = 3.5015 MB
Upper Quartile = 4.32 MB
Maximum = 21.622 MB
10 of 42
Copyright © 2011 Pearson Education, Inc.
4.1 Summaries of Numerical Variables
Summary Statistics for Song Sizes
Median = 3.5015 MB
IQR = 4.32 MB – 2.85 MB = 1.47 MB
Range = 21.622 MB – 0.148 MB = 21.474 MB
11 of 42
Copyright © 2011 Pearson Education, Inc.
4.1 Summaries of Numerical Variables
The Mean (Average)
Arithmetic average; divide the sum of the values
by the number of values (another typical value)
The symbol y represents the variable of interest
The symbol
y
read “y bar” represents the mean
12 of 42
Copyright © 2011 Pearson Education, Inc.
4.1 Summaries of Numerical Variables
The Mean (Average)
y
1 y 2 L yn
y
n
13 of 42
Copyright © 2011 Pearson Education, Inc.
4.1 Summaries of Numerical Variables
The Variance (s2)
Is a measure of variation based on the mean
How far a value is from the mean is known as its
deviation; the variance is the average of the squared
deviations
14 of 42
Copyright © 2011 Pearson Education, Inc.
4.1 Summaries of Numerical Variables
The Variance
s
2
y1 y
2
y2 y L yn y
2
2
n 1
15 of 42
Copyright © 2011 Pearson Education, Inc.
4.1 Summaries of Numerical Variables
The Standard Deviation (SD)
Is the square root of the variance
s s
2 the original units of the data (the
Is a measure of variability in
variance results in squared units)
16 of 42
Copyright © 2011 Pearson Education, Inc.
4.1 Summaries of Numerical Variables
Summary Statistics for Song Sizes
Mean = 3.7794 MB
Variance = 2.584 MB²
SD = 1.607 MB
17 of 42
Copyright © 2011 Pearson Education, Inc.
4M Example 4.1: MAKING M&M’s
Motivation
How many M&M’s are needed to fill a bag
labeled to weigh 1.6 ounces?
18 of 42
Copyright © 2011 Pearson Education, Inc.
4M Example 4.1: MAKING M&M’s
Method
Data are weights of 72 plain chocolate M&M’s taken
from several packages. To get a measure of the
amount of variation relative to the typical size, we
use the ratio of the standard deviation to the
mean (known as the coefficient of variation).
s
cv
y
19 of 42
Copyright © 2011 Pearson Education, Inc.
4M Example 4.1: MAKING M&M’s
Mechanics
Mean Weight = 0.86 gm
SD = 0.04 gm
Cv = 0.04 gm / 0.86 gm = 0.0465
20 of 42
Copyright © 2011 Pearson Education, Inc.
4M Example 4.1: MAKING M&M’s
Message
Since the SD is quite small compared to the mean
(with a cv of about 5%) the results suggest that 53
pieces are usually enough to fill a bag.
A bag labeled 1.6 ounces weighs about 45.36 grams.
Since there is little variability around the typical weight of
an M&M, we can calculate the number of pieces to fill a
1.6 ounce bag as 45.36/0.86.
21 of 42
Copyright © 2011 Pearson Education, Inc.
4.2 Histograms and the
Distribution of Numerical Data
Histograms
Plot the distribution of a numerical variable by
showing counts of values occurring within
adjacent intervals
Similar to bar charts but designed for continuous
quantitative data (bar charts are only appropriate
for discrete categories)
22 of 42
Copyright © 2011 Pearson Education, Inc.
4.2 Histograms and the
Distribution of Numerical Data
Histogram of Song Sizes
23 of 42
Copyright © 2011 Pearson Education, Inc.
4.2 Histograms and the
Distribution of Numerical Data
Histogram of Song Sizes
Indicates a few very long songs (outliers)
The graph devotes more than half of its area to
show less than 1% of the songs (white space
rule: graphs with mostly white space can be
improved by changing the interval of the plot to
focus on the data rather than the white space)
24 of 42
Copyright © 2011 Pearson Education, Inc.
4.3 Boxplot
Graph of the Five Number Summary
25 of 42
Copyright © 2011 Pearson Education, Inc.