Solution manual accounting information systems 12th edition by romney and steinbart CH16
Bạn đang xem bản rút gọn của tài liệu. Xem và tải ngay bản đầy đủ của tài liệu tại đây (1.37 MB, 26 trang )
Find more on www.downloadslide.com
Accounting Information Systems
CHAPTER 16
GENERAL LEDGER AND REPORTING SYSTEM
SUGGESTED ANSWERS TO DISCUSSION QUESTIONS
16.1
Although XBRL facilitates the electronic exchange of financial information, some
external users do not think it goes far enough. They would like access to the entire
general ledger, not just to XBRL-tagged financial reports that summarize general
ledger accounts. Should companies provide external users with such access? Why or
why not?
No, companies should not provide access to their general ledger. Providing external
users access to a company’s general ledger opens the company up to significant
competitive and financial risk.
16.2
How can responsibility accounting and flexible budgets improve morale?
Responsibility accounting improves morale by holding managers accountable only for the
activities over which they have control. In this way, they are not unfairly “punished” for
poor performance that they could not alter.
Flexible budgeting enables more accurate interpretation of deviations from budget. For
example, if activity levels are higher than planned, then costs should also increase.
Therefore, costs higher than the original budget may not be “bad” if they have risen at a
rate less than or equal to the proportionate increase in activity.
16.3
Why is the audit trail an important control?
The audit trail is a detective control used to verify the accuracy and completeness of
transaction processing. Tracing a set of source documents forward through the journal
entries that updated the general ledger verifies that the transactions were actually
recorded. Tracing changes in general ledger accounts back to source documents provides
a way to verify that the transactions did indeed occur and that they were recorded
correctly.
Although an accounting system should employ a variety of processing integrity controls
to prevent errors from occurring, preventive controls are never 100% effective.
Therefore, they need to be supplemented with detective controls like an audit trail.
16-1
© 2009 Pearson Education, Inc. Publishing as Prentice Hall
Find more on www.downloadslide.com
Ch. 16: General Ledger and Reporting System
16.4
The balanced scorecard measures organizational performance along four
dimensions. Is it possible that measures on the customer, internal operations, and
innovation and learning dimensions could be improving without any positive change
in the financial dimension? If so, what are the implications of such a pattern?
It may indeed be possible for measures on three dimensions of the balanced scorecard to
improve, but for financial results to deteriorate. This may occur because the 3 other areas
are leading indicators of financial performance. If so, the latter should soon begin to
improve.
On the other hand, it may be that the measures developed for the other areas are flawed in
that they do not address activities that customers value. Consequently, improved
performance on those dimensions does not translate into improved profitability. In this
case, management needs to redesign the nonfinancial dimensions of the Balanced
Scorecard to include items that are causally related to future financial performance.
Yet another possibility is that macroeconomic factors could be depressing earnings.
Clearly, a company cannot continue indefinitely with declining financial performance.
Top management needs to investigate the underlying causes of this pattern.
16.5
Do you think that mandatory standards should be developed for the design of
graphs of financial data that are included in annual reports and other periodic
communications to investors? Why or why not?
There is no right answer here but it should generate a good discussion. It may be helpful
to start the discussion off by talking about the reporting standards of the SEC and FASB.
It may also be useful to find annual reports or other financial news stories that contain
graphs which violate one or more of the rules presented in this chapter, and ask students
to discuss the effects, if any, of such violations.
Should students support standards, a good follow-up topic concerns the type of audit
guidance that would be helpful.
16-2
© 2009 Pearson Education, Inc. Publishing as Prentice Hall
Find more on www.downloadslide.com
Accounting Information Systems
SUGGESTED ANSWERS TO THE PROBLEMS
16.1
Match the term in the left column with its appropriate definition from the right
column:
1. __d__ journal voucher file
2. __k__ instance document
3. __a__ XBRL element
4. __f__ Balanced Scorecard
5. __l__ XBRL extension taxonomy
6. __i__ audit trail
7. __e__ XBRL taxonomy
8. __g__ XBRL linkbase
9. __h__ XBRL schema
10. __j__ XBRL style sheet
11. __b__ responsibility accounting
12. __c__ flexible budget
a. an individual financial statement item
b. evaluating performance based on controllable costs
c. evaluating performance by computing standards in
light of actual activity levels
d. the set of journal entries that updated the general
ledger
e. a set of files that defines XBRL elements and specifies
the relationships among them
f. a multi-dimensional performance report
g. a file that defines relationships among XBRL elements
h. a file that defines the attributes of XBRL elements
i. a detective control that can be used to trace changes in
general ledger account balances back to source
documents
j. a file that explains how to display an XBRL instance
document
k. a file that contains specific data values for a set of
XBRL elements for a specific time period or point in
time
l. a file containing a set of customized tags to define new
XBRL elements that are unique to a specific
organization
16-3
© 2009 Pearson Education, Inc. Publishing as Prentice Hall
Find more on www.downloadslide.com
Ch. 16: General Ledger and Reporting System
16.2
Which control procedure would be most effective in addressing the following
problems?
a. When entering a journal entry to record issuance of new debt, the treasurer
inadvertently transposes two digits in the debit amount.
Use a cross-footing balance check to test the equality of debits and credits
b. The spreadsheet used to calculate accruals had an error in a formula. As a
result, the controller’s adjusting entry was for the wrong amount.
Audit spreadsheets used to support journal entries
c. The controller forgot to make an adjusting entry to record depreciation.
Create a set of standard adjusting entries
d. A sales manager tipped off friends that the company’s financial results, to be
released tomorrow, were unexpectedly good.
Implement access controls to prevent the sales manager from obtaining access to
the general ledger and reporting system.
e. The general ledger master file is stored on disk. For some reason, the disk is no
longer readable. It takes the accounting department a week to reenter the past
month’s transactions from source documents in order to create a new general
ledger master file.
Backup files more frequently.
Create two copies of the backup files and store one on-site and the other off-site.
f. The controller sent a spreadsheet containing a preliminary draft of the income
statement to the CFO by e-mail. An investor intercepted the e-mail and used the
information to sell his stock in the company before news of the disappointing
results became public.
Encrypt sensitive financial information when it is transmitted over the Internet.
g. A company’s XBRL business report was incorrect because the controller
selected the wrong element from the taxonomy.
16-4
© 2009 Pearson Education, Inc. Publishing as Prentice Hall
Find more on www.downloadslide.com
Accounting Information Systems
Train users on the proper use of the taxonomy to prevent this..
Audit or validate the instance document prior to submission to detect this.
h. Instead of a zero, the letter o was entered when typing in data values in an
XBRL instance document.
Use processing integrity controls when entering data in instance documents.
Use a field check to detect this kind of error.
16-5
© 2009 Pearson Education, Inc. Publishing as Prentice Hall
Find more on www.downloadslide.com
Ch. 16: General Ledger and Reporting System
16.3
Explain the components of an audit trail for verifying changes to accounts payable.
Your answer should specify how those components can be used to verify the
accuracy, completeness, and validity of all purchases, purchase returns, purchase
discounts, debit memos, and cash disbursements.
The sum of all amounts owed to individual vendors would be computed and compared to
the balance in the general ledger accounts payable control account.
To verify all transactions, you would follow the audit trail to identify the voucher
numbers, purchase order numbers, and receiving report numbers for all approved vendor
invoices and use that list to select all source documents.
You could then recalculate the total amount purchased and the total cash disbursed. You
could also recalculate all purchase discounts available and compare that to the amount
taken.
To verify vendor balances, you could recompute the effects of all purchases and
payments on the beginning balance; this calculated figure should equal the new ending
balance.
16-6
© 2009 Pearson Education, Inc. Publishing as Prentice Hall
Find more on www.downloadslide.com
Accounting Information Systems
16.4
As manager of a local pizza parlor, you want to develop a balanced scorecard so you
can more effectively monitor the restaurant’s performance.
a. Propose at least two goals for each dimension, and explain why those goals are
important to the overall success of the pizza parlor. One goal should be purely
performance-oriented and the other should be risk-related.
b. Suggest specific measures for each goal developed in part a.
Below is a sample of a balanced scorecard containing goals and measures.
Dimension Goals
Financial
Increase sales
Profitability
Measure
Customer
Customer satisfaction
Attract new customers
Fast service
Internal operations
Reduce waste
Reduce mistakes
Innovation and
learning
Develop new products
Improve employee
skills
Target
Actual
Percentage change in sales
Operating margin
5%
12%
4%
13.5%
Customer satisfaction rating
Percentage of sales to first time
customers
Average time to serve food
9.5
10%
9.6
3%
15 minutes
14 minutes
Food waste (% of sales)
Percentage of orders with mistakes
3%
1%
4%
2%
Number of new products this year
2
2
Number of cooking classes attended
this year
Percentage of cooks who attended at
least one cooking class this year
25
18
85%
75%
c. Explain how to gather the data needed for each measure developed in part b.
Financial measures would be generated by the accounting system.
Customer satisfaction and first-time customers could be measured through in-store
surveys.
The other measures would have to be collected as part of performing the activities.
16-7
© 2009 Pearson Education, Inc. Publishing as Prentice Hall
Find more on www.downloadslide.com
Ch. 16: General Ledger and Reporting System
16.5
Use Table 16-1 to create a questionnaire checklist that can be used to evaluate
controls in the general ledger and reporting cycle.
a. For each control issue, write a Yes/No question such that a “No” answer
represents a control weakness. For example, one question might be “Is access to
the general ledger restricted?”
A wide variety of questions is possible. Below is a sample list:
Question
1. Is access to the general ledger restricted?
2. Is the general ledger regularly reviewed and all changes investigated?
3. Is sensitive data encrypted while stored in the database?
4. Does a backup and disaster recovery plan exist?
5. Have backup procedures been tested within the past year?
6. Are appropriate data entry edit controls used for journal entries?
7. Is an audit trail maintained and regularly reviewed?
8. Are the spreadsheets used to calculate amounts for adjusting journal
entries audited to verify that the formulas are correct?
9. Has the controller or person responsible for mapping the organization’s
data to an XBRL taxonomy attended XBRL training?
10. Are XBRL instance documents validated by someone not involved in
their creation?
11. Have employees responsible for creating graphs been trained in the
principles of graph design?
Yes
No
b. For each Yes/No question, write a brief explanation of why a “No” answer
represents a control weakness.
Question
Reason a “No” answer represents a weakness
1
Unrestricted access to the general ledger could facilitate fraud or the
unauthorized disclosure of sensitive data
2
Failure to investigate all changes to the general ledger may allow fraud to occur
because unauthorized master records (e.g., fake suppliers, non-existent
employees, etc.) may not be detected. Also, unauthorized changes to account
balances may not be detected.
3
Failure to encrypt sensitive data can result in unauthorized disclosure of
financial results by someone who obtains access to the data
4
If a backup and disaster recovery plan does not exist, the organization may
suffer the loss of important data.
5
If the backup plan is not regularly tested, it may not work.
6
Without proper data entry edit controls, errors in journal entries used to update
the general ledger may occur
16-8
© 2009 Pearson Education, Inc. Publishing as Prentice Hall
Find more on www.downloadslide.com
Accounting Information Systems
7
8
9
10
11
Without an audit trail, it is not possible to verify the completeness and accuracy
of all changes to the general ledger.
Failure to audit spreadsheets for errors increases the risk of erroneous adjusting
entries
Training in XBRL is necessary to avoid making errors in the mapping of the
organization’s data to taxonomy elements or the unnecessary creation of
taxonomy extensions
Failure to validate an instance document by someone not involved in its
creation increases the risk of submitting inaccurate instance documents.
If employees have not been trained in the principles of proper graph design,
they may create misleading graphs.
16-9
© 2009 Pearson Education, Inc. Publishing as Prentice Hall
Find more on www.downloadslide.com
Ch. 16: General Ledger and Reporting System
16.6
Visit the SEC website (www.sec.gov) and explore what is available in terms of
interactive data (the SEC’s term for XBRL reports). Use the SEC’s viewer software
and examine the annual reports for two companies.
There is no “solution” per se – the objective of this problem is to introduce students to
XBRL filings and the use of viewer software.
16.7
Obtain the annual report of a company assigned by your professor. Read the
management discussion and analysis section, and develop a balanced scorecard that
reflects that company’s vision, mission, and strategy. Create both performanceoriented and risk-based goals and measures for each section of the balanced
scorecard.
The key to this assignment is the appropriateness of the goals and measures developed for
the Balanced Scorecard in light of management’s discussion about the mission, vision,
and values of the company. This requires inferring from management’s discussion in the
annual report the company’s strategy (low-cost or product differentiation) and strategic
position (variety-based, needs-based, or access-based).
You should probably develop your own grading key, based on what you expect from the
students. At a minimum, students need to develop multiple goals for each of the four
dimensions of the Balanced Scorecard. They also need to present quantifiable measures
for each goal.
To facilitate grading, ask them to turn in both the annual report they used and a list of
references to specific points in the management discussion that they used to justify their
choice of goals and measures.
16-10
© 2009 Pearson Education, Inc. Publishing as Prentice Hall
Find more on www.downloadslide.com
Accounting Information Systems
16.8
Excel Problem Objective: Practice graph design principles.
Use the data in Table 16-3 to create the following graphs:
Sales
Cost of Goods Sold
Gross Margin
Earnings Per Share
2010
598,000
350,000
248,000
12.52
2009
640,000
400,000
240,000
12.10
2008
575,000
375,000
200,000
11.95
2007
560,000
330,000
230,000
11.66
2006
530,000
300,000
230,000
10.50
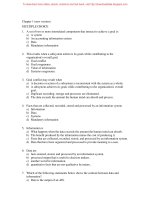
a. Sales
Sales
640,000
530,000
2006
560,000
575,000
2007
2008
2009
598,000
2010
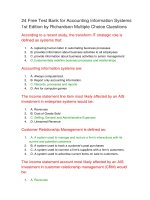
b. Sales and Gross Margin
640,000
530,000
230,000
2006
575,000
560,000
230,000
200,000
2007
240,000
2008
Sales
2009
598,000
248,000
2010
Gross Margin
16-11
© 2009 Pearson Education, Inc. Publishing as Prentice Hall
Find more on www.downloadslide.com
Ch. 16: General Ledger and Reporting System
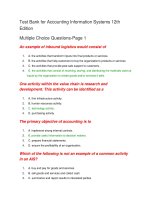
c. Earnings per share
Earnings Per Share
11.66
11.95
12.10
12.52
2007
2008
2009
2010
10.50
2006
d. Which principles of graph design, if any, did you have to manually implement to
over-ride the default graphs created by Excel?
1. Students had to reverse the x-axis, which automatically followed the sequence of
years in the spreadsheet.
2. Students had to adjust the y-axis to begin at zero for earnings per share. However, if
variations in EPS are important to monitor, then the default graph below may be
preferred.
Earnings Per Share
12.52
11.95
12.10
11.66
10.50
2006
2007
2008
2009
2010
16-12
© 2009 Pearson Education, Inc. Publishing as Prentice Hall
Find more on www.downloadslide.com
Accounting Information Systems
16.9
Excel Problem Objective: Create pivot tables for what-if analysis
Read the article “Make Excel an Instant Know-It-All” by Roberta Ann Jones in the March 2004 issue of the Journal of
Accountancy. (Available at www.aicpa.org)
a. Follow the instructions in the article to create a spreadsheet with pivot tables.
First, create the spreadsheet. Then, to create the Pivot Table, position your cursor in a cell where you want the Pivot Table to
appear. Then click on the Insert Tab, and then click on the Pivot Table choice.
Click on PivotTable option
16-13
© 2009 Pearson Education, Inc. Publishing as Prentice Hall
Find more on www.downloadslide.com
Ch. 16: General Ledger and Reporting System
Next, highlight the cells containing the data as shown:
Clicking OK yields the following blank skeleton outline of a PivotTable which we will use in parts b and c to create PivotTables:
16-14
© 2009 Pearson Education, Inc. Publishing as Prentice Hall
Find more on www.downloadslide.com
Accounting Information Systems
16-15
© 2009 Pearson Education, Inc. Publishing as Prentice Hall
Find more on www.downloadslide.com
Ch. 16: General Ledger and Reporting System
b. Print out a report that shows sales by month for each salesperson.
Step1: select the salesperson, order date, and order amount fields in the window in the upper right corner that says “Choose
Fields to add to Report.”
16-16
© 2009 Pearson Education, Inc. Publishing as Prentice Hall
Find more on www.downloadslide.com
Accounting Information Systems
Step 2: Then click on the salesperson entry and move it from the “Row Labels” window to the “Column Labels” window.
16-17
© 2009 Pearson Education, Inc. Publishing as Prentice Hall
Find more on www.downloadslide.com
Ch. 16: General Ledger and Reporting System
Step 3: Highlight all the cells in the PivotTable and format them to display currency with two decimals.
16-18
© 2009 Pearson Education, Inc. Publishing as Prentice Hall
Find more on www.downloadslide.com
Accounting Information Systems
c. Assume that Brown and David are in sales group 1 and the other three salespeople are in sales group 2. Print out a
report that shows monthly sales for each group.
Step 1: To separate the sales people into groups, click on the sales person row in the Pivot Table and highlight Brown and David.
16-19
© 2009 Pearson Education, Inc. Publishing as Prentice Hall
Find more on www.downloadslide.com
Ch. 16: General Ledger and Reporting System
Step 2: Right click the two highlighted cells and select “Group”. They will now have a super-title called “Group 1”. Do the same
for the other three sales people to form group 2. The spreadsheet should look like this:
16-20
© 2009 Pearson Education, Inc. Publishing as Prentice Hall
Find more on www.downloadslide.com
Accounting Information Systems
Step 3: You can collapse and display the groups by clicking on the button to the left of each group name. The preceding screen
shot showed all members of each group (note the minus signs to the left of the labels “Group1” and “Group2”). Clicking those to
change to a plus sign produces the following:
16-21
© 2009 Pearson Education, Inc. Publishing as Prentice Hall
Find more on www.downloadslide.com
Ch. 16: General Ledger and Reporting System
16.10 Excel Problem Objective: How to do what-if analysis with graphs.
a. Read the article “Tweaking the Numbers,” by Theo Callahan in the June 2001 issue of the Journal of Accountancy
(either the print edition, likely available at your school’s library, or access the Journal of Accountancy archives at
www.aicpa.org). Follow the instructions in the article to create a spreadsheet with graphs that do what-if analysis.
Most of the steps in the article can be done as indicated. One difference is finding the control toolbox to create a spin button. This
requires that the “Developer” tab is available as shown below.
Click on “Design Mode” to toggle
Click on Insert to add spin
buttons and other Active X
controls
The Developer tab normally appears
to the right of the View tab
The Microsoft Office Button is in
the far upper left
16-22
© 2009 Pearson Education, Inc. Publishing as Prentice Hall
Find more on www.downloadslide.com
Accounting Information Systems
If the developer tab is not available, follow these steps (for Excel 2007):
1. Click the Microsoft Office Button (in far upper left corner – see prior
screenshot)
2. Click Excel Options
3. In the “Popular” category, under “Top options for working with Excel” select
the “Show Developer tab in the Ribbon” check box and click OK
On the Developer tab you then click insert and select the “spin box” option from the list of
choices of Active X controls. Then position your cursor in the cell where you want to insert a
spin button and left-click once. You can now right-click on the spin-button and fill in the
values for the spin buttons as indicated in the article.
Hint: it may help to increase the height of the rows before trying to add more spin buttons.
The rest of the article steps work as described.
16-23
© 2009 Pearson Education, Inc. Publishing as Prentice Hall
Find more on www.downloadslide.com
Ch. 16: General Ledger and Reporting System
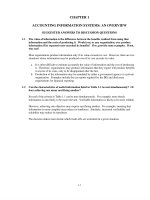
b. Now create a spreadsheet to do graphical what-if analysis for the “cash gap.”
Cash gap represents the number of days between when a company has to pay its
suppliers and when it gets paid by its customers. Thus, Cash gap = Inventory
days on hand + Receivables collection period – Accounts payable period.
The “cash gap” formula indicates how much of a cushion a company has, given a set
of assumptions about inventory, receivables, and payables. If the projected cash gap
is too small, management can increase it by instituting changes that either increase the
delay in paying suppliers, speeding up collections from customers, or reducing
inventory levels.
The purpose of your spreadsheet is to display visually what happens to cash gap
when you “tweak” policies concerning inventory, receivables, and payables.
Thus, you will create a spreadsheet that looks like Figure 16-11
c. Set the three spin buttons to have the following values:
Linked cell
Maximum
Minimum
Value
Small change
Spin button for
Inventory
C2
120
0
30
10
Spin button for
Receivables
C3
120
30
60
10
16-24
© 2009 Pearson Education, Inc. Publishing as Prentice Hall
Spin button for
Payables
C4
90
20
20
10
Find more on www.downloadslide.com
Accounting Information Systems
16-25
© 2009 Pearson Education, Inc. Publishing as Prentice Hall