Solution manual cost accounting 14e by horngren chapter 16
Bạn đang xem bản rút gọn của tài liệu. Xem và tải ngay bản đầy đủ của tài liệu tại đây (1.08 MB, 43 trang )
To download more slides, ebook, solutions and test bank, visit
CHAPTER 16
COST ALLOCATION: JOINT PRODUCTS AND BYPRODUCTS
16-1 Exhibit 16-1 presents many examples of joint products from four different general
industries. These include:
Industry
Separable Products at the Splitoff Point
Food Processing:
• Lamb
• Lamb cuts, tripe, hides, bones, fat
• Turkey
• Breasts, wings, thighs, poultry meal
Extractive:
• Petroleum
• Crude oil, natural gas
16-2 A joint cost is a cost of a production process that yields multiple products simultaneously.
A separable cost is a cost incurred beyond the splitoff point that is assignable to each of the
specific products identified at the splitoff point.
16-3 The distinction between a joint product and a byproduct is based on relative sales value.
A joint product is a product from a joint production process (a process that yields two or more
products) that has a relatively high total sales value. A byproduct is a product that has a relatively
low total sales value compared to the total sales value of the joint (or main) products.
16-4 A product is any output that has a positive sales value (or an output that enables a
company to avoid incurring costs). In some joint-cost settings, outputs can occur that do not have
a positive sales value. The offshore processing of hydrocarbons yields water that is recycled back
into the ocean as well as yielding oil and gas. The processing of mineral ore to yield gold and
silver also yields dirt as an output, which is recycled back into the ground.
16-5
1.
2.
3.
4.
5.
6.
The chapter lists the following six reasons for allocating joint costs:
Computation of inventoriable costs and cost of goods sold for financial accounting
purposes and reports for income tax authorities.
Computation of inventoriable costs and cost of goods sold for internal reporting purposes.
Cost reimbursement under contracts when only a portion of a business's products or
services is sold or delivered under cost-plus contracts.
Insurance settlement computations for damage claims made on the basis of cost
information of joint products or byproducts.
Rate regulation when one or more of the jointly-produced products or services are subject
to price regulation.
Litigation in which costs of joint products are key inputs.
16-6 The joint production process yields individual products that are either sold this period or
held as inventory to be sold in subsequent periods. Hence, the joint costs need to be allocated
between total production rather than just those sold this period.
16-7 This situation can occur when a production process yields separable outputs at the splitoff
point that do not have selling prices available until further processing. The result is that selling
prices are not available at the splitoff point to use the sales value at splitoff method. Examples
include processing in integrated pulp and paper companies and in petro-chemical operations.
16-1
To download more slides, ebook, solutions and test bank, visit
16-8 Both methods use market selling-price data in allocating joint costs, but they differ in
which sales-price data they use. The sales value at splitoff method allocates joint costs to joint
products on the basis of the relative total sales value at the splitoff point of the total production of
these products during the accounting period. The net realizable value method allocates joint costs
to joint products on the basis of the relative net realizable value (the final sales value minus the
separable costs of production and marketing) of the total production of the joint products during
the accounting period.
16-9
Limitations of the physical measure method of joint-cost allocation include:
a. The physical weights used for allocating joint costs may have no relationship to the
revenue-producing power of the individual products.
b. The joint products may not have a common physical denominator––for example, one
may be a liquid while another a solid with no readily available conversion factor.
16-10 The NRV method can be simplified by assuming (a) a standard set of post-splitoff point
processing steps, and (b) a standard set of selling prices. The use of (a) and (b) achieves the same
benefits that the use of standard costs does in costing systems.
16-11 The constant gross-margin percentage NRV method takes account of the post-splitoff
point ―profit‖ contribution earned on individual products, as well as joint costs, when making
cost assignments to joint products. In contrast, the sales value at splitoff point and the NRV
methods allocate only the joint costs to the individual products.
16-12 No. Any method used to allocate joint costs to individual products that is applicable to
the problem of joint product-cost allocation should not be used for management decisions
regarding whether a product should be sold or processed further. When a product is an inherent
result of a joint process, the decision to process further should not be influenced by either the
size of the total joint costs or by the portion of the joint costs assigned to particular products.
Joint costs are irrelevant for these decisions. The only relevant items for these decisions are the
incremental revenue and the incremental costs beyond the splitoff point.
16-13 No. The only relevant items are incremental revenues and incremental costs when
making decisions about selling products at the splitoff point or processing them further.
Separable costs are not always identical to incremental costs. Separable costs are costs incurred
beyond the splitoff point that are assignable to individual products. Some separable costs may
not be incremental costs in a specific setting (e.g., allocated manufacturing overhead for postsplitoff processing that includes depreciation).
16-14 Two methods to account for byproducts are:
a. Production method—recognizes byproducts in the financial statements at the time
production is completed.
b. Sales method—delays recognition of byproducts until the time of sale.
16-15 The sales byproduct method enables a manager to time the sale of byproducts to affect
reported operating income. A manager who was below the targeted operating income could
adopt a ―fire-sale‖ approach to selling byproducts so that the reported operating income exceeds
the target. This illustrates one dysfunctional aspect of the sales method for byproducts.
16-2
To download more slides, ebook, solutions and test bank, visit
16-16
(20-30 min.) Joint-cost allocation, insurance settlement.
1.
(a)
Breasts
Wings
Thighs
Bones
Feathers
Sales value at splitoff method:
Pounds
of
Product
100
20
40
80
10
250
Wholesale
Selling Price
per Pound
$0.55
0.20
0.35
0.10
0.05
Sales
Value
at Splitoff
$55.00
4.00
14.00
8.00
0.50
$81.50
Weighting:
Joint
Sales Value
Costs
at Splitoff Allocated
0.675
$33.75
0.049
2.45
0.172
8.60
0.098
4.90
0.006
0.30
1.000
$50.00
Allocated
Costs per
Pound
0.3375
0.1225
0.2150
0.0613
0.0300
Costs of Destroyed Product
Breasts: $0.3375 per pound 40 pounds = $13.50
Wings: $0.1225 per pound 15 pounds =
1.84
$15.34
b.
Physical measure method:
Breasts
Wings
Thighs
Bones
Feathers
Pounds
of
Product
100
20
40
80
10
250
Costs of Destroyed Product
Breast: $0.20 per pound
Wings: $0.20 per pound
Weighting:
Physical
Measures
0.400
0.080
0.160
0.320
0.040
1.000
40 pounds
15 pounds
Joint
Costs
Allocated
$20.00
4.00
8.00
16.00
2.00
$50.00
=
=
Allocated
Costs per
Pound
$0.200
0.200
0.200
0.200
0.200
$ 8
3
$11
Note: Although not required, it is useful to highlight the individual product profitability figures:
Product
Breasts
Wings
Thighs
Bones
Feathers
Sales
Value
$55.00
4.00
14.00
8.00
0.50
Sales Value at
Splitoff Method
Joint Costs
Gross
Allocated
Income
$33.75
$21.25
2.45
1.55
8.60
5.40
4.90
3.10
0.30
0.20
16-3
Physical
Measures Method
Joint Costs
Gross
Allocated
Income
$20.00
$35.00
4.00
0.00
8.00
6.00
16.00
(8.00)
2.00
(1.50)
To download more slides, ebook, solutions and test bank, visit
2.
The sales-value at splitoff method captures the benefits-received criterion of cost
allocation and is the preferred method. The costs of processing a chicken are allocated to
products in proportion to the ability to contribute revenue. Quality Chicken’s decision to process
chicken is heavily influenced by the revenues from breasts and thighs. The bones provide
relatively few benefits to Quality Chicken despite their high physical volume.
The physical measures method shows profits on breasts and thighs and losses on bones
and feathers. Given that Quality Chicken has to jointly process all the chicken products, it is nonintuitive to single out individual products that are being processed simultaneously as making
losses while the overall operations make a profit. Quality Chicken is processing chicken mainly
for breasts and thighs and not for wings, bones, and feathers, while the physical measure method
allocates a disproportionate amount of costs to wings, bones and feathers.
16-17 (10 min.) Joint products and byproducts (continuation of 16-16).
1.
Ending inventory:
Breasts
15
Wings
4
Thighs
6
Bones
5
Feathers
2
$0.3375
0.1225
0.2150
0.0613
0.0300
=
=
=
=
=
$5.06
0.49
1.29
0.31
0.06
$7.21
2.
Joint products
Breasts
Thighs
Net Realizable Values of
byproducts:
Wings
$ 4.00
Bones
8.00
Feathers
0.50
$12.50
Byproducts
Wings
Bones
Feathers
Joint costs to be allocated:
Joint costs – Net Realizable Values of byproducts = $50 – $12.50 = $37.50
Breast
Thighs
Pounds
of
Product
Wholesale
Selling Price
per Pound
Sales
Value
at Splitoff
Weighting:
Sales Value
at Splitoff
100
40
$0.55
0.35
$55
14
$69
55 ÷ 69
14 ÷ 69
Ending inventory:
Breasts 15 $0.2989
Thighs 6
0.1903
Joint
Costs
Allocated
$29.89
7.61
$37.50
Allocated
Costs Per
Pound
$0.2989
0.1903
$4.48
1.14
$5.62
3.
Treating all products as joint products does not require judgments as to whether a product
is a joint product or a byproduct. Joint costs are allocated in a consistent manner to all products
for the purpose of costing and inventory valuation. In contrast, the approach in requirement 2
lowers the joint cost by the amount of byproduct net realizable values and results in inventory
values being shown for only two of the five products, the ones (perhaps arbitrarily) designated as
being joint products.
16-4
To download more slides, ebook, solutions and test bank, visit
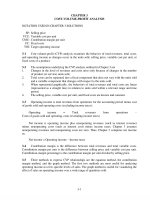
16-18 (10 min.) Net realizable value method.
A diagram of the situation is in Solution Exhibit 16-18.
Corn Syrup
Final sales value of total production,
12,500 $50; 6,250 $25
Deduct separable costs
Net realizable value at splitoff point
Weighting, $250,000; $62,500 $312,500
Joint costs allocated, 0.8; 0.2 $325,000
$625,000
375,000
$250,000
0.8
$260,000
Corn Starch
$156,250
93,750
$ 62,500
0.2
$ 65,000
Total
$781,250
468,750
$312,500
$325,000
SOLUTION EXHIBIT 16-18 (all numbers are in thousands)
Joint Costs
Separable Costs
Processing
$375,000
Corn Syrup:
12,500 cases at
$50 per case
Processing
$93,750
Corn Starch:
6,250 cases at
$25 per case
Processing
$325 000
Splitoff
Point
16-5
To download more slides, ebook, solutions and test bank, visit
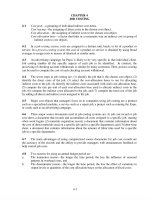
16-19 (40 min.) Alternative joint-cost-allocation methods, further-process decision.
A diagram of the situation is in Solution Exhibit 16-19.
1.
Physical measure of total production (gallons)
Weighting, 2,500; 7,500 10,000
Joint costs allocated, 0.25; 0.75 $120,000
2.
Final sales value of total production,
2,500 $21.00; 7,500 $14.00
Deduct separable costs,
2,500 $3.00; 7,500
$2.00
Net realizable value at splitoff point
Weighting, $45,000; $90,000 $135,000
Joint costs allocated, 1/3; 2/3 $120,000
3.
Methanol
2,500
0.25
$30,000
Turpentine
7,500
0.75
$ 90,000
Total
10,000
$120,000
Methanol
Turpentine
Total
$52,500
$105,000
$157,500
7,500
$45,000
15,000
$ 90,000
22,500
$135,000
1/3
$40,000
2/3
$ 80,000
$120,000
a. Physical-measure (gallons) method:
Revenues
Cost of goods sold:
Joint costs
Separable costs
Total cost of goods sold
Gross margin
Methanol
$52,500
Turpentine
$105,000
Total
$157,500
30,000
7,500
37,500
$15,000
90,000
15,000
105,000
0
120,000
22,500
142,500
$ 15,000
$
b. Estimated net realizable value method:
Methanol
$52,500
Revenues
Cost of goods sold:
Joint costs
Separable costs
Total cost of goods sold
Gross margin
40,000
7,500
47,500
$ 5,000
16-6
Turpentine
$105,000
Total
$157,500
80,000 120,000
15,000
22,500
95,000 142,500
$ 10,000 $ 15,000
To download more slides, ebook, solutions and test bank, visit
4.
Alcohol Bev.
Turpentine
$150,000
$105,000
60,000
$ 90,000
0.50
$ 60,000
15,000
$ 90,000
0.50
$ 60,000
Final sales value of total production,
2,500 $60.00; 7,500 $14.00
Deduct separable costs,
(2,500 $12.00) + (0.20 $150,000);
7,500 $2.00
Net realizable value at splitoff point
Weighting, $90,000; $90,000 $180,000
Joint costs allocated, 0.5; 0.5 $120,000
Total
$255,000
75,000
$180,000
$120,000
An incremental approach demonstrates that the company should use the new process:
Incremental revenue,
($60.00 – $21.00) 2,500
$ 97,500
Incremental costs:
Added processing, $9.00 2,500
$22,500
Taxes, (0.20 $60.00) 2,500
30,000
(52,500)
Incremental operating income from
further processing
$ 45,000
Proof:
Total sales of both products
Joint costs
Separable costs
Cost of goods sold
New gross margin
Old gross margin
Difference in gross margin
$255,000
120,000
75,000
195,000
60,000
15,000
$ 45,000
SOLUTION EXHIBIT 16-19
Joint Costs
Separable Costs
2 500
gallons
Processing
$3 per gallon
Methanol:
2 500 gallons
at $21 per gallon
7 500
gallons
Processing
$2 per gallon
Turpentine:
7 500 gallons
at $14 per gallon
Processing
$120 000
for 10 000
gallons
Splitoff
Point
16-7
To download more slides, ebook, solutions and test bank, visit
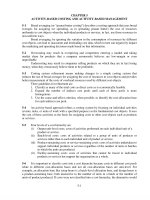
16-20 (40 min.) Alternative methods of joint-cost allocation, ending inventories.
Total production for the year was:
X
Y
Z
Ending
Inventories
175
75
70
Sold
75
225
280
Total
Production
250
300
350
A diagram of the situation is in Solution Exhibit 16-20.
1.
a. Net realizable value (NRV) method:
X
Final sales value of total production,
250 $1,800; 300 $1,300; 350 $800
Deduct separable costs
Net realizable value at splitoff point
Weighting, $450; $390; $160
$1,000
Joint costs allocated,
0.45, 0.39, 0.16 $328,000
Y
Z
Total
$450,000
––
$450,000
$390,000
––
$390,000
$280,000
120,000
$160,000
$1,120,000
120,000
$1,000,000
0.45
0.39
0.16
$147,600
$127,920
$ 52,480
X
175
250
70%
Y
75
300
25%
$ 328,000
Ending Inventory Percentages:
Ending inventory
Total production
Ending inventory percentage
Z
70
350
20%
Income Statement
X
Revenues,
75 $1,800; 225 $1,300; 280 $800
Cost of goods sold:
Joint costs allocated
Separable costs
Production costs
Deduct ending inventory,
70%; 25%; 20% of production costs
Cost of goods sold
Gross margin
Gross-margin percentage
Y
Z
Total
$135,000
$292,500
$224,000
$651,500
147,600
––
147,600
127,920
––
127,920
52,480
120,000
172,480
328,000
120,000
448,000
103,320
44,280
$ 90,720
31,980
95,940
$196,560
34,496
137,984
$ 86,016
169,796
278,204
$373,296
67.2%
67.2%
38.4%
16-8
To download more slides, ebook, solutions and test bank, visit
b.
Constant gross-margin percentage NRV method:
Step 1:
Final sales value of prodn., (250 $1,800) + (300 $1,300) + (350
Deduct joint and separable costs, $328,000 + $120,000
Gross margin
Gross-margin percentage, $672,000 ÷ $1,120,000
$800)
$1,120,000
448,000
$ 672,000
60%
Step 2:
X
Final sales value of total production,
250 $1,800; 300 $1,300; 350 $800
Deduct gross margin, using overall
Gross-margin percentage of sales, 60%
Total production costs
Step 3: Deduct separable costs
Joint costs allocated
Y
Z
Total
$450,000
$390,000
$280,000
$1,120,000
270,000
180,000
234,000
156,000
168,000
112,000
672,000
448,000
—
$180,000
—
$156,000
120,000
120,000
$ (8,000) $ 328,000
The negative joint-cost allocation to Product Z illustrates one ―unusual‖ feature of the
constant gross-margin percentage NRV method: some products may receive negative cost
allocations so that all individual products have the same gross-margin percentage.
Income Statement
Revenues, 75 $1,800;
225 $1,300; 280 $800
Cost of goods sold:
Joint costs allocated
Separable costs
Production costs
Deduct ending inventory,
70%; 25%; 20% of production costs
Cost of goods sold
Gross margin
Gross-margin percentage
X
Y
Z
Total
$135,000
$292,500
$224,000
$651,500
180,000
180,000
156,000
156,000
(8,000)
120,000
112,000
328,000
120,000
448,000
126,000
54,000
$ 81,000
60%
39,000
117,000
$175,500
60%
22,400
89,600
$134,400
60%
187,400
260,600
$390,900
60%
16-9
To download more slides, ebook, solutions and test bank, visit
Summary
a.
NRV method:
Inventories on balance sheet
Cost of goods sold on income statement
b.
Y
Z
Total
$103,320
44,280
$ 31,980
95,940
$ 34,496
137,984
$169,796
278,204
$448,000
$126,000
54,000
$ 39,000
117,000
X
67.2%
60.0%
Y
67.2%
60.0%
Constant gross-margin
percentage NRV method
Inventories on balance sheet
Cost of goods sold on income statement
2.
X
$
22,400
89,600
$187,400
260,600
$448,000
Gross-margin percentages:
NRV method
Constant gross-margin percentage NRV
Z
38.4%
60.0%
SOLUTION EXHIBIT 16-20
Joint Costs
Separable Costs
Product X:
250 tons at
$1,800 per ton
Joint
Processing
Costs
$328,000
Product Y:
300 tons at
$1,300 per ton
Processing
$120 000
Splitoff
Point
16-10
Product Z:
350 tons at
$800 per ton
To download more slides, ebook, solutions and test bank, visit
16-21 (30 min.) Joint-cost allocation, process further.
Joint Costs =
$1 800
ICR8
(Non-Saleable)
Processing
$175
Crude Oil
150 bbls × $18 / bbl =
$2 700
ING4
(Non-Saleable)
Processing
$105
NGL
50 bbls × $15 / bbl =
$750
XGE3
(Non-Saleable)
Processing
$210
Gas
800 eqvt bbls ×
$1.30 / eqvt bbl =
$1 040
Splitoff
Point
1a.
Physical Measure Method
1. Physical measure of total prodn.
2. Weighting (150; 50; 800 ÷ 1,000)
3. Joint costs allocated (Weights $1,800)
1b.
1.
2.
3.
4.
5.
Crude Oil
150
0.15
$270
NGL
50
0.05
$90
Gas
800
0.80
$1,440
Total
1,000
1.00
$1,800
NRV Method
Final sales value of total production
Deduct separable costs
NRV at splitoff
Weighting (2,525; 645; 830 ÷ 4,000)
Joint costs allocated (Weights $1,800)
Crude Oil
$ 2,700
175
$ 2,525
0.63125
$1,136.25
16-11
NGL
750
105
$ 645
0.16125
$290.25
$
Gas
$ 1,040
210
$ 830
0.20750
$373.50
Total
$4,490
490
$4,000
$1,800
To download more slides, ebook, solutions and test bank, visit
2.
The operating-income amounts for each product using each method is:
(a)
Physical Measure Method
Revenues
Cost of goods sold
Joint costs
Separable costs
Total cost of goods sold
Gross margin
(b)
Crude Oil
$2,700
270
175
445
$2,255
NGL
$750
90
105
195
$555
Gas
$1,040
Total
$4,490
1,440
210
1,650
$ (610)
1,800
490
2,290
$2,200
Gas
$1,040.00
Total
$4,490.00
NRV Method
Revenues
Cost of goods sold
Joint costs
Separable costs
Total cost of goods sold
Gross margin
Crude Oil
NGL
$2,700.00 $750.00
1,136.25 290.25
175.00
105.00
1,311.25 395.25
$1,388.75 $354.75
373.50
210.00
583.50
$ 456.50
1,800.00
490.00
2,290.00
$2,200.00
3.
Neither method should be used for product emphasis decisions. It is inappropriate to use
joint-cost-allocated data to make decisions regarding dropping individual products, or pushing
individual products, as they are joint by definition. Product-emphasis decisions should be made
based on relevant revenues and relevant costs. Each method can lead to product emphasis
decisions that do not lead to maximization of operating income.
4.
Since crude oil is the only product subject to taxation, it is clearly in Sinclair’s best
interest to use the NRV method since it leads to a lower profit for crude oil and, consequently, a
smaller tax burden. A letter to the taxation authorities could stress the conceptual superiority of
the NRV method. Chapter 16 argues that, using a benefits-received cost allocation criterion,
market-based joint cost allocation methods are preferable to physical-measure methods. A
meaningful common denominator (revenues) is available when the sales value at splitoff point
method or NRV method is used. The physical-measures method requires nonhomogeneous
products (liquids and gases) to be converted to a common denominator.
16-12
To download more slides, ebook, solutions and test bank, visit
16-22 (30 min.) Joint-cost allocation, sales value, physical measure, NRV methods.
1a.
PANEL A: Allocation of Joint Costs using Sales Value at
Splitoff Method
Sales value of total production at splitoff point
(10,000 tons $10 per ton; 20,000 $15 per ton)
Weighting ($100,000; $300,000 ÷ $400,000)
Joint costs allocated (0.25; 0.75 $240,000)
PANEL B: Product-Line Income Statement for June 2012
Revenues
(12,000 tons $18 per ton; 24,000 $25 per ton)
Deduct joint costs allocated (from Panel A)
Deduct separable costs
Gross margin
Gross margin percentage
Special B/
Beef
Ramen
Special S/
Shrimp
Ramen
$100,000
0.25
$60,000
$300,000
0.75
$180,000
Special B
Special S
$216,000
60,000
48,000
$108,000
50%
$600,000
180,000
168,000
$252,000
42%
$816,000
240,000
216,000
$360,000
44%
Special B/
Beef
Ramen
10,000
33%
$80,000
Special S/
Shrimp
Ramen
20,000
67%
$160,000
Total
30,000
$240,000
Special B
Special S
Total
Total
$400,000
$240,000
Total
1b.
PANEL A: Allocation of Joint Costs using Physical-Measure
Method
Physical measure of total production (tons)
Weighting (10,000 tons; 20,000 tons ÷ 30,000 tons)
Joint costs allocated (0.33; 0.67 $240,000)
PANEL B: Product-Line Income Statement for June 2012
Revenues
(12,000 tons $18 per ton; 24,000 $25 per ton)
Deduct joint costs allocated (from Panel A)
Deduct separable costs
Gross margin
Gross margin percentage
$216,000
80,000
48,000
$ 88,000
41%
$600,000
160,000
168,000
$272,000
45%
$816,000
240,000
216,000
$360,000
44%
Special B
Special S
Total
1c.
PANEL A: Allocation of Joint Costs using Net Realizable
Value Method
Final sales value of total production during accounting period
(12,000 tons $18 per ton; 24,000 tons $25 per ton)
Deduct separable costs
Net realizable value at splitoff point
Weighting ($168,000; $432,000 ÷ $600,000)
Joint costs allocated (0.28; 0.72 $240,000)
PANEL B: Product-Line Income Statement for June 2012
Revenues (12,000 tons $18 per ton; 24,000 tons $25 per ton)
Deduct joint costs allocated (from Panel A)
Deduct separable costs
Gross margin
Gross margin percentage
16-13
$216,000
48,000
$168,000
28%
$67,200
$600,000
168,000
$432,000
72%
$172,800
$816,000
216,000
$600,000
Special B
$216,000
67,200
48,000
$100,800
46.7%
Special S
$600,000
172,800
168,000
$259,200
43.2%
Total
$816,000
240,000
216,000
$360,000
44.1%
$240,000
To download more slides, ebook, solutions and test bank, visit
2.
Sherrie Dong probably performed the analysis shown below to arrive at the net loss of
$2,228 from marketing the stock:
PANEL A: Allocation of Joint Costs using
Sales Value at Splitoff
Sales value of total production at splitoff point
(10,000 tons $10 per ton; 20,000 $15 per
ton; 4,000 $5 per ton)
Weighting
($100,000; $300,000; $20,000 ÷ $420,000)
Joint costs allocated
(0.238095; 0.714286; 0.047619 $240,000)
PANEL B: Product-Line Income Statement
for June 2012
Revenues
(12,000 tons $18 per ton; 24,000 $25 per ton;
4,000 $5 per ton)
Separable processing costs
Joint costs allocated (from Panel A)
Gross margin
Deduct marketing costs
Operating income
Special B/
Beef
Ramen
Special S/
Shrimp
Ramen
Stock
$100,000
$300,000
$20,000
$420,000
23.8095%
71.4286%
4.7619%
100%
$57,143
$171,429
$11,428
$240,000
Special S
Stock
$600,000
168,000
171,429
$260,571
$20,000
0
11,428
8,572
10,800
$ (2,228)
Special B
$216,000
48,000
57,143
$110,857
Total
Total
$836,000
216,000
240,000
380,000
10,800
$369,200
In this (misleading) analysis, the $240,000 of joint costs are re-allocated between Special B,
Special S, and the stock. Irrespective of the method of allocation, this analysis is wrong. Joint
costs are always irrelevant in a process-further decision. Only incremental costs and revenues
past the splitoff point are relevant. In this case, the correct analysis is much simpler: the
incremental revenues from selling the stock are $20,000, and the incremental costs are the
marketing costs of $10,800. So, Instant Foods should sell the stock—this will increase its
operating income by $9,200 ($20,000 – $10,800).
16-14
To download more slides, ebook, solutions and test bank, visit
16-23 (20 min.) Joint cost allocation: sell immediately or process further.
1.
a. Sales value at splitoff method:
Sales value of total production at splitoff,
500lbs × $1; 100 gallons × $4
Weighting, $500; $400 $900
Joint costs allocated,
0.556; 0.444 $500
Cookies/
Soymeal
Soyola/
Soy Oil
Total
$ 500
0.556
$ 400
0.444
$900
$ 278
$ 222
$500
Cookies
Soyola
Total
$1,200
300
$ 900
0.75
$
b. Net realizable value method:
Final sales value of total production,
600lbs × $2; 400qts × $1.25
Deduct separable costs
Net realizable value
Weighting, $900; $300 $1,200
Joint costs allocated,
0.75; 0.25 $500
$375
500
200
$ 300
0.25
$1,700
500
$1,200
$125
$500
2.
Cookies/Soy Meal
Revenue if sold at splitoff
Process further NRV
Profit (Loss) from processing further
a
500 lbs × $ 1 =
100 gal × $ 4 =
c
600 lbs × $ 2 –
d
400 qts × $1.25 –
b
a
$500
900 c
$400
Soyola/Soy Oil
$ 400 b
300 d
$(100)
$500
$400
$300 = $900
$200 = $300
ISP should process the soy meal into cookies because it increases profit by $400 (900-500).
However, they should sell the soy oil as is, without processing it into the form of Soyola, because
profit will be $100 (400-300) higher if they do. Since the total joint cost is the same under both
allocation methods, it is not a relevant cost to the decision to sell at splitoff or process further.
16-15
To download more slides, ebook, solutions and test bank, visit
16-24 (30 min.) Accounting for a main product and a byproduct.
Production
Method
1.
Sales
Method
Revenues
Main product
Byproduct
Total revenues
$682,240a
––__
682,240
$682,240
65,000d
747,240
Cost of goods sold
Total manufacturing costs
Deduct value of byproduct production
Net manufacturing costs
Deduct main product inventory
Cost of goods sold
Gross margin
500,000
85,000b
415,000
74,700c
340,300
$341,940
500,000
0
500,000
90,000e
410,000
$337,240
a
42,640 $16.00
8,500 $10.00
c
(9,360/52,000) × $415,000 = $74,700
d
b
2.
a
e
6,500 $10.00
(9,360/52,000) × $500,000 = $90,000
Production
Method
$74,700
20,000a
Main Product
Byproduct
Ending inventory shown at unrealized selling price.
BI + Production – Sales = EI
0 + 8,500 – 6,500 = 2,000 pounds
Ending inventory = 2,000 pounds $10 per pound = $20,000
16-16
Sales
Method
$90,000
0
To download more slides, ebook, solutions and test bank, visit
16-25 (35-45 min.) Joint costs and byproducts.
1.
A
B
Totals
A
B
Totals
Computing byproduct deduction to joint costs:
Revenues from C, 16,000 $6
Deduct:
Gross margin, 10% of revenues
Marketing costs, 20% of revenues
Peanut Butter Department separable costs
Net realizable value (less gross margin) of C
$ 96,000
Joint costs
Deduct byproduct contribution
Net joint costs to be allocated
$180,000
55,200
$124,800
Quantity
12,000
65,000
Unit
Sales
Price
$12
3
Joint Costs
Allocation
$ 46,800
78,000
$124,800
Deduct
Final Separable
Sales Processing
Value
Cost
$144,000
$27,000
195,000
––
$339,000
$27,000
Add Separable
Processing
Costs
$27,000
––
$27,000
9,600
19,200
12,000
$ 55,200
Net
Realizable
Allocation of
Value at
$124,800
Splitoff
Weighting Joint Costs
$117,000
37.5%
$ 46,800
195,000
62.5%
78,000
$312,000
$124,800
Total Costs
$ 73,800
78,000
$151,800
Units
12,000
65,000
77,000
Unit Cost
$6.15
1.20
Unit cost for C: $3.45 ($55,200 ÷ 16,000) + $0.75 ($12,000 ÷ 16,000) = $4.20,
or
$6.00 – $0.60 (10% $6) – $1.20 (20% $6) = $4.20.
16-17
To download more slides, ebook, solutions and test bank, visit
2.
A
B
C
Totals
A
B
C
Totals
If all three products are treated as joint products:
Quantity
12,000
65,000
16,000
Unit
Sales
Price
$12
3
6
Joint Costs
Allocation
$ 55,892
93,153
30,955
$180,000
Final
Sales
Value
$144,000
195,000
96,000
$435,000
Deduct
Separable
Processing
Cost
$27,000
─
31,200
$58,200
Add Separable
Processing
Costs
$27,000
––
12,000
$39,000
Net
Realizable
Value at
Splitoff
$117,000
195,000
64,800
$376,800
Total Costs
$ 82,892
93,153
42,955
$219,000
Weighting
117 ÷ 376.8
195 ÷ 376.8
64.8 ÷ 376.8
Units
12,000
65,000
16,000
93,000
Allocation
of
$180,000
Joint
Costs
$ 55,892
93,153
30,955
$180,000
Unit Cost
$6.91
1.43
2.68
Call the attention of students to the different unit ―costs‖ resulting from the two assumptions
about the relative importance of Product C. The point is that costs of individual products depend
heavily on which assumptions are made and which accounting methods and techniques are used.
16-18
To download more slides, ebook, solutions and test bank, visit
16-26 (25 min.) Accounting for a byproduct.
1. Byproduct recognized at time of production:
Joint cost = $7,200
Joint cost to be charged to main product = Joint Cost - NRV of Byproduct = $7,200 - (900 lbs. × $2)
= $5,400
$5400
Inventoriable cost of main product =
= $1.80 per half-gallon
1500×2
Inventoriable cost of byproduct = NRV = $2.00 per pound
Gross Margin Calculation under Production Method
Revenues
Main product: Juice (2800 half-gallons × $2.50)
Byproduct: Pulp and peel
Cost of goods sold
Main product: Juice (2800 half-gallons × $1.80)
Gross margin
Gross-margin percentage ($1,960 ÷ $7,000)
Inventoriable costs (end of period):
Main product: Juice (200 half-gallons × $1.80) = $360
Byproduct: Pulp and peel (40 pounds × $2.00) = $80
2.
$7,000
0
7,000
5,040
$1,960
28.00%
Byproduct recognized at time of sale:
Joint cost to be charged to main product = Total joint cost = $7,200
$7, 200
Inventoriable cost of main product =
= $2.40 per half-gallon
1,500×2
Inventoriable cost of byproduct = $0
Gross Margin Calculation under Sales Method
Revenues
Main product: Juice (2800 half-gallons × $2.50)
$7,000
Byproduct: Pulp and peel (860 pounds × $2.00)
1,720
8,720
Cost of goods sold
Main product: Juice (2800 half-gallons × $2.40)
6,720
Gross margin
$2,000
Gross-margin percentage ($2,000 ÷ $8,720)
22.94%
Inventoriable costs (end of period):
Main product: Juice (200 half-gallons × $2.40) = $480
Byproduct: Pulp and peel (40 pounds × $ 0) = $ 0
3. The production method recognizes the byproduct cost as inventory in the period it is
produced. This method sets the cost of the byproduct inventory equal to its net realizable
value. When the byproduct is sold, inventory is reduced without being expensed through the
income statement. The sales method associates all of the production cost with the main
product. Under this method, the byproduct has no inventoriable cost and is recognized only
when it is sold.
16-19
To download more slides, ebook, solutions and test bank, visit
16-27 (40 min.) Alternative methods of joint-cost allocation, product-mix decisions.
A diagram of the situation is in Solution Exhibit 16-27.
1.
Computation of joint-cost allocation proportions:
a.
Sales Value of
Total Production
at Splitoff
A
$ 84,000
B
72,000
C
24,000
D
60,000
$240,000
Weighting
84 ÷ 240 = 0.35
72 ÷ 240 = 0.30
24 ÷ 240 = 0.10
60 ÷ 240 = 0.25
1.00
Allocation of $96,000
Joint Costs
$33,600
28,800
9,600
24,000
$96,000
b.
A
B
C
D
Physical Measure
of Total Production
322,400 gallons
119,600 gallons
52,000 gallons
26,000 gallons
520,000 gallons
Weighting
322.4 ÷ 520 = 0.62
119.6 ÷ 520 = 0.23
52.0 ÷ 520 = 0.10
26.0 ÷ 520 = 0.05
1.00
Allocation of $96,000
Joint Costs
$59,520
22,080
9,600
4,800
$96,000
c.
Final Sales
Value of
Total
Separable
Production
Costs
Super A $300,000
$249,600
Super B 160,000
102,400
C
24,000
–
Super D 160,000
152,000
Net
Realizable
Value at
Splitoff
Weighting
$ 50,400 50.4 ÷ 140 = 0.36
57,600 57.6 ÷ 140 = 0.41
24,000 24.0 ÷ 140 = 0.17
8,000 8.0 ÷ 140 = 0.06
$140,000
1.00
16-20
Allocation
of
$96,000
Joint Costs
$34,560
39,360
16,320
5,760
$96,000
To download more slides, ebook, solutions and test bank, visit
Computation of gross-margin percentages:
a. Sales value at splitoff method:
Revenues
Joint costs
Separable costs
Total cost of goods sold
Gross margin
Gross-margin percentage
Super A
$300,000
33,600
249,600
283,200
$ 16,800
5.6%
Super B
$160,000
28,800
102,400
131,200
$ 28,800
18%
C
$24,000
9,600
0
9,600
$14,400
60%
Super D
Total
$160,000 $644,000
24,000
96,000
152,000
504,000
176,000
600,000
$ (16,000)
$ 44,000
(10%) 6.83%
Super B
$160,000
22,080
102,400
124,480
$ 35,520
22.2%
C
$24,000
9,600
0
9,600
$14,400
60%
Super D
Total
$160,000
$644,000
4,800
96,000
152,000
504,000
156,800
600,000
$ 3,200
$ 44,000
2%
6.83%
Super B
$160,000
39,360
102,400
141,760
$ 18,240
11.4%
C
$24,000
16,320
0
16,320
$ 7,680
32%
Super D
Total
$160,000
$644,000
5,760
96,000
152,000
504,000
157,760
600,000
$ 2,240
$ 44,000
1.4%
6.83%
b. Physical-measure method:
Revenues
Joint costs
Separable costs
Total cost of goods sold
Gross margin
Gross-margin percentage
Super A
$300,000
59,520
249,600
309,120
$ (9,120)
(3.04%)
c. Net realizable value method:
Revenues
Joint costs
Separable costs
Total cost of goods sold
Gross margin
Gross-margin percentage
Super A
$300,000
34,560
249,600
284,160
$ 15,840
5.28%
Summary of gross-margin percentages:
Joint-Cost
Allocation Method
Sales value at splitoff
Physical measure
Net realizable value
Super A
5.60%
3.04%
5.28%
Super B
18.00%
22.20%
11.40%
16-21
C
60.00%
60.00%
32.00%
Super D
(10.00)%
2.00%
1.40%
To download more slides, ebook, solutions and test bank, visit
2.
Further Processing of A into Super A:
Incremental revenue, $300,000 – $84,000
Incremental costs
Incremental operating loss from further processing
$216,000
249,600
$ (33,600)
Further processing of B into Super B:
Incremental revenue, $160,000 – $72,000
Incremental costs
Incremental operating loss from further processing
$ 88,000
102,400
$ (14,400)
Further Processing of D into Super D:
Incremental revenue, $160,000 – $60,000
Incremental costs
Incremental operating loss from further processing
$ 100,000
152,000
$ (52,000)
Operating income can be increased by $100,000 if A,B and D are sold at their splitoff point
rather than processing them further into Super A, Super B and Super D.
SOLUTION EXHIBIT 16-27
Revenues at Splitoff
and Separable Costs
Joint Costs
A, 322 400 gallons
Revenue = $84 000
B, 119 600 gallons
Revenue = $72 000
Processing
$96 000
Processing
$249 600
Super A
$300 000
Processing
$102 400
Super B
$160 000
Processing
$152 000
Super D
$160 000
C, 52 000 gallons
Revenue = $24 000
D, 26 000 gallons
Revenue = $60 000
Splitoff
Point
16-22
To download more slides, ebook, solutions and test bank, visit
16-28 (40–60 min.) Comparison of alternative joint-cost allocation methods, furtherprocessing decision, chocolate products.
Joint Costs
$30,000
Separable Costs
ChocolatePowder Liquor
Base
Cocoa
Beans
Processing
$12,750
Chocolate
Powder
Processing
Milk-Chocolate
Liquor Base
Processing
$26,250
Milk
Chocolate
SPLITOFF
POINT
1a.
Sales value at splitoff method:
ChocolatePowder/
Liquor Base
Sales value of total production at splitoff,
600 $21; 900 $26
Weighting, $12,600; $23,400 $36,000
Joint costs allocated,
0.35; 0.65 $30,000
MilkChocolate/
Liquor Base
Total
$12,600
0.35
$23,400
0.65
$36,000
$10,500
$19,500
$30,000
1b.
Physical-measure method:
Physical measure of total production
(15,000 1,500) 60; 90
Weighting, 600; 900 1,500
Joint costs allocated,
0.40; 0.60 $30,000
600 gallons
0.40
$12,000
16-23
900 gallons
0.60
$18,000
1,500 gallons
$30,000
To download more slides, ebook, solutions and test bank, visit
1c.
Net realizable value method:
ChocolatePowder
Final sales value of total production,
6,000 $4; 10,200 $5
Deduct separable costs
Net realizable value at splitoff point
Weighting, $11,250; $24,750 $36,000
Joint costs allocated,
0.3125; 0.6875 $30,000
d.
MilkChocolate
$24,000
12,750
$11,250
0.3125
$ 9,375
Total
$51,000
26,250
$24,750
0.6875
$75,000
39,000
$36,000
$20,625
$30,000
Constant gross-margin percentage NRV method:
Step 1:
Final sales value of total production, (6,000 $4) + (10,200 $5)
Deduct joint and separable costs, ($30,000 + $12,750 + $26,250)
Gross margin
Gross-margin percentage ($6,000 ÷ $75,000)
$75,000
69,000
$ 6,000
8%
Step 2:
ChocolatePowder
Final sales value of total production,
6,000 $4; 10,200 $5
Deduct gross margin, using overall
gross-margin percentage of sales (8%)
Total production costs
MilkChocolate
Total
$24,000
$51,000
$75,000
1,920
22,080
4,080
46,920
6,000
69,000
12,750
$ 9,330
26,250
$20,670
39,000
$30,000
Step 3:
Deduct separable costs
Joint costs allocated
16-24
To download more slides, ebook, solutions and test bank, visit
2.
a.
b.
c.
Revenues
Joint costs
Separable costs
Total cost of goods sold
Gross margin
ChocolatePowder
$24,000
10,500
12,750
23,250
$ 750
Gross-margin percentage
3.125%
Revenues
Joint costs
Separable costs
Total cost of goods sold
Gross margin
$24,000
12,000
12,750
24,750
$ (750)
Gross-margin percentage
(3.125)%
Revenues
Joint costs
Separable costs
Total cost of goods sold
Gross margin
Gross-margin percentage
d.
3.
$24,000
9,375
12,750
22,125
$ 1,875
7.812%
MilkChocolate
$51,000
19,500
26,250
45,750
$ 5,250
Total
$75,000
30,000
39,000
69,000
$ 6,000
10.294%
$51,000
18,000
26,250
44,250
$ 6,750
13.235%
$51,000
20,625
26,250
46,875
$ 4,125
8.088%
8%
$75,000
30,000
39,000
69,000
$ 6,000
8%
$75,000
30,000
39,000
69,000
$ 6,000
8%
Revenues
Joint costs
Separable costs
Total cost of goods sold
Gross margin
$24,000
9,330
12,750
22,080
$ 1,920
$51,000
20,670
26,250
46,920
$ 4,080
$75,000
30,000
39,000
69,000
$ 6,000
Gross-margin percentage
8%
8%
8%
Further processing of chocolate-powder liquor base into chocolate powder:
Incremental revenue, $24,000 – $12,600 ($21× 600)
$11,400
Incremental costs
12,750
Incremental operating income from further processing
$ (1,350)
Further processing of milk-chocolate liquor base into milk chocolate:
Incremental revenue, $51,000 – $23,400 ($26× 900)
$27,600
Incremental costs
26,250
Incremental operating income from further processing
$ 1,350
Chocolate Factory should continue to process milk-chocolate liquor base into milk chocolate.
However, it could increase operating income by $1,350 (to $7,350) if it sold chocolate-powder
liquor base at the splitoff point rather than process it into chocolate powder.
16-25