Solution manual cost management measuring monitoring and motivating performance 1st by wolcott ch06
Bạn đang xem bản rút gọn của tài liệu. Xem và tải ngay bản đầy đủ của tài liệu tại đây (787.34 KB, 42 trang )
To download more slides, ebook, solutions and test bank, visit
Chapter 6
Process Costing
LEARNING OBJECTIVES
Chapter 6 addresses the following questions:
Q1
Q2
Q3
Q4
Q5
Q6
Q7
Q8
How are costs assigned to mass-produced products?
What are equivalent units, and how do they relate to the production process?
How is the weighted average method used in process costing?
How is the FIFO method used in process costing?
What alternative methods are used for mass production?
How is process costing performed for multiple production departments?
How are spoilage costs handled in process costing?
What are the uses and limitations of process cost information?
These learning questions (Q1 through Q8) are cross-referenced in the textbook to individual
exercises and problems.
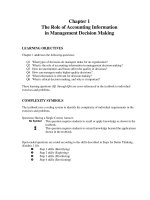
COMPLEXITY SYMBOLS
The textbook uses a coding system to identify the complexity of individual requirements in the
exercises and problems.
Questions Having a Single Correct Answer:
No Symbol
This question requires students to recall or apply knowledge as shown in the
textbook.
This question requires students to extend knowledge beyond the applications
e
shown in the textbook.
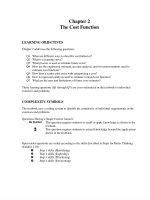
Open-ended questions are coded according to the skills described in Steps for Better Thinking
(Exhibit 1.10):
Step 1 skills (Identifying)
Step 2 skills (Exploring)
Step 3 skills (Prioritizing)
Step 4 skills (Envisioning)
To download more slides, ebook, solutions and test bank, visit
6-2
Cost Management
QUESTIONS
6.1
Weighted average and FIFO process costing produce similar equivalent unit costs
whenever the unit cost of production does not change or whenever there are no beginning
or ending work-in-process inventories. In addition, the equivalent unit costs will be
similar if the number of equivalent units produced during the period is large relative to
inventories.
6.2
A process would complete more units during the period than it started when there are
more units in beginning inventory than in ending inventory.
6.3
This approach would overstate the cost of spoiled units because partially complete units
would be treated as if they had received 100% of direct materials and conversion costs,
regardless of the amount actually allocated to those units.
6.4
If the beginning and ending inventories are the same from one period to the next, the
number of units started is equal to the number of units completed and transferred out.
This means that WIP inventory can be ignored when calculating equivalent units.
However, if costs change from one period to the next, then the cost allocated to ending
WIP will not be the same as the cost allocated to beginning WIP.
6.5
Judgment is needed to determine the percentage complete that is used in process costing
calculations. Each unit or batch of units is complete to a different degree than other units
or batches because the process is continuous. The percent complete is an average
completion percentage that is estimated using judgment.
6.6
If the percent completion in year 1 is overestimated, then the equivalent units for those
units will be too high in year 1. In turn, this will cause the cost per equivalent unit in year
1 to be understated. In year 2, this misstatement will cause the equivalent units for
completion of beginning WIP to be too low. The understatement of equivalent units will
cause the cost per equivalent unit to be overstated in year 2.
6.7
The weighted average method ignores the period in which product is started. In addition,
costs from beginning inventories are added to costs of this period. All products
completed are then given an average cost, regardless of when they were started. The
FIFO method, on the other hand, tracks work completed and costs from the prior period
separately from work completed and costs incurred during the current period. Under
FIFO, beginning WIP consists of last period’s costs and work valued separately. At the
end of the accounting period, this period’s costs to complete these units are added. Then
the total costs for beginning WIP from last period and this period are summed and
attached to the beginning inventory units that were completed this period. Then the units
started and completed this period are valued using this period’s costs. If an
organization’s costs fluctuate regularly, the FIFO method will reflect the most current
costs so that managers can investigate changes in cost more quickly.
6.8
Goods that are mass-produced have uniform specifications and are made in large batches
or on a continuous assembly line. Services that are mass-produced are performed using
To download more slides, ebook, solutions and test bank, visit
Chapter 6: Process Costing
6-3
the same skills and time and each task is very similar. Goods that are custom produced
come in many variations and are made to specifications that vary with each order. Many
services are custom, such as accounting, health care, and law services because each
customer requires different inputs to match their needs. While it is relatively easy to
track costs for custom made goods by attaching tags or using individual records to log
costs of materials and labor, it is impossible to trace costs to mass-produced units. Job
order costing is used for custom products. Direct material and labor costs are traced to
each product and overhead costs are allocated using some allocation base that is labor or
machine related. For mass-production, process costing is used. Equivalent units are
calculated to account for units that are partially complete. Direct materials costs are
allocated separately. Direct labor and overhead are combined and called conversion
costs. These are allocated to complete and partially completed units.
6.9
They should be counted as ending WIP inventory in the department. Completed units
imply that the units have been transferred to the next department or to finished goods,
which is not the case with these units.
6.10
This is what is referred to as "continuous processing." Units just entering the process
have had little done to them, while units just about to leave the process have had all or
most of the conversion done. On average, the units in process are 50% complete as to
conversion.
6.11
The cost of spoiled units is added to the total cost of goods transferred and increases the
cost per unit.
6.12
Job costing is often used when products are manufactured in batches. In this firm, a
single batch would have a specific sized wire and specific length of nail. The cost of
each type of nail will depend primarily on the cost of the type of wire used and the time
required for each type. Therefore job costing is the most appropriate method. This
information would be lost if process cost techniques were employed.
6.13
Here are three factors. 1. If inspection costs are high and the cost to produce a single
unit is very low, managers may decide to reduce the number of time units are inspected.
In this case, inspection might occur only when units are completed. 2. If production
costs are high and units go through several different departments, inspection may take
place earlier in the manufacturing process so that spoiled units are caught when they are
relatively incomplete. 3. If a firm is developing a strategy of high quality products,
inspection may take place more often to insure that products are free of defects.
6.14
Advantages of reducing spoilage include saving the cost of the spoiled units and being
able to sell those units and increasing the contribution margin. In addition, in some
industries all firms need to compete on quality, and increased spoilage may lead to
increased defects in units sold, harming the reputation of the company resulting in a loss
of market share. Disadvantages might be that the costs incurred do not guarantee that
spoilage will be significantly reduced, or that the benefits in improved quality will be
worth the costs.
To download more slides, ebook, solutions and test bank, visit
6-4
Cost Management
EXERCISES
6.15 Francisco’s
A and B
Assumptions:
Work performed in May:
Beginning WIP
% complete direct materials
% complete conversion costs
Units started
Units completed and transferred out
Ending WIP
% complete direct materials
% complete conversion costs
9,000
100%
40%
50,000
47,000
12,000
100%
30%
Summarize Physical and Equivalent Units
Physical Units
Equivalent Units:
Direct Materials
Conversion Costs
Beginning
WIP
9,000
9,000
3,600
Complete
Beginning
WIP
0
0
5,400
Work This Period
Start
Start
Total Work
Total
and
Ending
Performed
Units to
Complete
WIP
This Period
Account for
38,000
12,000
50,000
59,000
38,000
38,000
12,000
3,600
50,000
47,000
Total Work
59,000
50,600
A. Weighted average equivalent units for direct materials is 59,000 (total work this period)
because the ending units get 100% credit for direct materials, since direct materials are
added at the beginning of processing. Equivalent units for conversion costs are 50,600
(total work this period) because ending inventory units are only 30% complete and,
hence, have only 30% of the conversion costs (since conversion costs are incurred evenly
during production).
B. FIFO equivalent units are found under Total Work Performed This Period. Therefore
direct materials equivalent units are 50,000 (excludes beginning inventory because direct
materials were added last period and includes ending inventory because materials were
added this period), and equivalent units for conversion costs are 47,000 (excluding work
done on beginning WIP but including this period’s work to complete those units and
including the portion of work completed on ending WIP.
To download more slides, ebook, solutions and test bank, visit
Chapter 6: Process Costing
6-5
6.16 Fine Fans
A and B
Assumptions for October:
Work performed:
Costs:
Beginning WIP
% complete direct materials
% complete conversion costs
Units started
Units completed and transferred out
Ending WIP
% complete direct materials
% complete conversion costs
9,000
100%
20%
100,000
94,000
15,000
100%
60%
Beginning WIP (FIFO and Weighted
Average)
Direct materials
Conversion costs
Total beginning WIP costs
Costs added this month
Direct materials
Conversion costs
Total costs added
Total costs to account for
$
18,000
36,000
54,000
100,000
200,000
300,000
$354,000
Summarize Physical and Equivalent Units
Physical Units
Beginning
WIP (20%)
9,000
Equivalent Units:
Direct Materials
Conversion Costs
9,000
1,800
Complete
Beginning
WIP (80%)
0
0
7,200
Work This Period
Start
Start
Total Work
Total
and
Ending
Performed
Units to
Complete
WIP (60%) This Period
Account for
85,000
15,000
100,000
109,000
85,000
85,000
15,000
9,000
100,000
101,200
Total Work
109,000
103,000
Calculate Actual Cost Per Equivalent Unit
Weighted Average:
Direct materials:
Beginning WIP + Direct materials cost =
Equivalent units for total work
$118,000
109,000
=$ 1.08
Conversion costs:
Beginning WIP + Direct materials cost =
Equivalent units for total work
$236,000
103,000
=
Total cost per equivalent unit:
2.29
$3.37
First-in, First-out:
Direct materials:
_____________Direct materials cost_____________
Equivalent units for total work performed this period
= $100,000
100,000
=$ 1.00
Conversion costs:
______________Conversion costs______________
Equivalent units for total work performed this period
= $200,000
101,200
=
Total cost per equivalent unit:
1.98
$2.98
To download more slides, ebook, solutions and test bank, visit
6-6
Cost Management
6.17 Journal Entry for Abnormal Spoilage
[Note: This problem requires students to extend concepts about journal entries for spoilage from
Chapter 5 to Chapter 6.]
When spoiled units are sold, the net realizable value offsets the cost. In this case the total
cost of spoiled units is $16,000 (80*$200). However, $2,000 is recovered by selling the
spoiled units for their net realizable value. The journal entry follows.
Loss from Abnormal Spoilage
Cash
Work-in-Process inventory
$14,000
2,000
$16,000
6.18 Journal Entry for Normal and Abnormal Spoilage
A. Number of spoiled units = 10,000 – 8,000 = 2,000
Cost of spoiled units = 2,000*$5 = $10,000
B. When all spoilage is normal, the total cost of units (good and spoiled) is transferred into
finished goods. That cost is $50,000 (10,000*$5). The journal entries follow.
Finished Goods Inventory
Work-in-Process Inventory
$50,000
$50,000
C. For abnormal spoilage, only the cost of good units is transferred to finished goods. The
cost of spoiled units is recorded as a separate loss. The cost of good units is $40,000
(8,000*$5).
Finished Goods Inventory
Loss from Abnormal Spoilage
Work-in-Process Inventory
$40,000
10,000
$50,000
To download more slides, ebook, solutions and test bank, visit
Chapter 6: Process Costing
6-7
6.19 through 6.22 Felix and Sons
Assumptions for December:
Work performed:
Costs:
Beginning WIP
% complete direct materials
% complete conversion costs
Units started (12,000 – 8,000 + 6,000)
Units completed and transferred out
Ending WIP
% complete direct materials
% complete conversion costs
8,000
100%
75%
10,000
12,000
6,000
100%
50%
Beginning WIP (FIFO and Weighted
Average)
Direct materials
Conversion costs
Total beginning WIP costs
Costs added this month
Direct materials
Conversion costs
Total costs added
Total costs to account for
$
19,200
7,200
26,400
31,200
21,600
52,800
$79,200
Summarize Physical and Equivalent Units
Physical Units
Beginning
WIP (30%)
8,000
Equivalent Units:
Direct Materials
Conversion Costs
8,000
6,000
Complete
Beginning
WIP (75%)
0
0
2,000
Work This Period
Start
Start
Total Work
Total
and
Ending
Performed
Units to
Complete
WIP (50%) This Period
Account for
4,000
6,000
10,000
18,000
4,000
4,000
6,000
3,000
10,000
9,000
Total Work
18,000
15,000
Calculate Actual Cost Per Equivalent Unit
Weighted Average:
Direct materials:
Beginning WIP + Direct materials cost =
Equivalent units for total work
$50,400
18,000
=$ 2.80
Conversion costs:
Beginning WIP + Direct materials cost =
Equivalent units for total work
$28,800
15,000
=
Total cost per equivalent unit:
First-in, First-out:
Direct materials:
Conversion costs:
1.92
$4.72
_____________Direct materials cost_____________
Equivalent units for total work performed this period
= $31,200
10,000
=$ 3.12
______________Conversion costs______________
Equivalent units for total work performed this period
= $21,600
9,000
=
Total cost per equivalent unit:
2.40
$5.52
To download more slides, ebook, solutions and test bank, visit
6-8
Cost Management
Process Cost Reports for December 31
Beginning WIP
Costs to complete
beginning WIP:
Direct materials
Conversion costs
Total costs added this
period
First-in, First-Out
Computation
Units
From November
cost report
8,000
4,000x$5.52
Total units completed and
transferred out
Ending WIP:
Direct materials
Conversion costs
Total ending WIP cost
Weighted Average
Computation
Units
0
4,800
_____
4,800
8,000
31,200
4,000
22,080
12,000
53,280
(8,000+4,000)x$4.72
6,000x$2.80
3,000x$1.92
_____
18,720
7,200
25,920
18,000
$79,200
6,000
12,000
_____
16,800
5,760
22,560
18,000
$79,200
6.23 Humphrey Manufacturing
A and B
Assumptions for April:
Work performed:
Beginning WIP
% complete direct materials
% complete conversion costs
Units started (8,000+40,000-6,000)
Units completed and transferred out
Ending WIP
% complete direct materials
% complete conversion costs
$56,640
6,000
6,000x$3.12
3,000x2.40
Total Accounted For
Costs
$26,400
0x$3.12
2,000x$2.40
Total cost of beginning
WIP transferred out
New units started,
completed, and transferred
out
Costs
Costs:
6,000
100%
40%
42,000
40,000
8,000
100%
25%
Beginning WIP (FIFO and Weighted
Average)
Direct materials
Conversion costs
Total beginning WIP costs
Costs added this month
Direct materials
Conversion costs
Total costs added
Total costs to account for
$
7,500
2,125
9,625
70,000
42,500
112,500
$122,125
To download more slides, ebook, solutions and test bank, visit
Chapter 6: Process Costing
6-9
Summarize Physical and Equivalent Units
Physical Units
Beginning
WIP (40%)
6,000
Equivalent Units:
Direct Materials
Conversion Costs
6,000
2,400
Complete
Beginning
WIP (60%)
0
0
3,600
Work This Period
Start
Start
Total Work
Total
and
Ending
Performed
Units to
Complete
WIP (25%) This Period
Account for
34,000
8,000
42,000
48,000
34,000
34,000
8,000
2,000
42,000
39,600
Total Work
48,000
42,000
Calculate Actual Cost Per Equivalent Unit
Weighted Average:
Direct materials:
Beginning WIP + Direct materials cost =
Equivalent units for total work
$77,500
48,000
=$ 1.6146
Conversion costs:
Beginning WIP + Direct materials cost =
Equivalent units for total work
$44,625
42,000
=
Total cost per equivalent unit:
1.0625
$2.6771
First-in, First-out:
Direct materials:
_____________Direct materials cost_____________
Equivalent units for total work performed this period
= $70,000
42,000
=$1.6667
Conversion costs:
______________Conversion costs______________
Equivalent units for total work performed this period
= $42,500
39,600
=
Total cost per equivalent unit:
1.0732
$2.7399
To download more slides, ebook, solutions and test bank, visit
6-10 Cost Management
Process Cost Reports for April
Beginning WIP
Costs to complete beginning
WIP:
Direct materials
Conversion costs
Total costs added this
period
First-in, First-Out
Computation
Units
Costs
From March
cost report
6,000
$ 9,625
0x$1.6667
3,600x$1.0732
Total cost of beginning WIP
transferred out
New units started,
completed, and transferred
out
34,000x$2.7399
Total units completed and
transferred out
Ending WIP:
Direct materials
Conversion costs
Total ending WIP cost
Total Accounted For
Weighted Average
Computation
Units
Costs
0
3,864
_____
3,864
6,000
13,489
34,000
93,157
40,000
106,646
40,000x$2.6771
8,000x$1.6146
2,000x$1.0625
_____
13,336
2,146
15,482
48,000
$122,128
8,000
8,000x$1.667
2,000x1.073
40,000
$107,084
8,000
_____
12,917
2,125
15,042
48,000
$122,126
Differences in total costs are due to rounding errors. If a spreadsheet is used to make these
calculations, the totals will have fewer rounding errors.
C. Journal entries for weighted average method for April:
Work in process inventory
$70,000
Raw materials inventory
To record the cost of raw materials used in production during April.
$70,000
Work in process inventory
$42,500
Wages and accounts payable
To record the conversion costs incurred in production during April.
$42,500
Finished goods
$107,084
Work in process inventory
$107,084
To record the cost of 40,000 units transferred to finished goods during April
(includes the cost of normal spoilage).
To download more slides, ebook, solutions and test bank, visit
Chapter 6: Process Costing 6-11
Journal entries for FIFO method for April:
Work in process inventory
$70,000
Raw materials inventory
To record the cost of raw materials used in production during April.
$70,000
Work in process inventory
$42,500
Wages and accounts payable
To record the conversion costs incurred in production during April.
$42,500
Finished goods
$106,646
Work in process inventory
$106,646
To record the cost of 40,000 units transferred to finished goods during April
(includes the cost of normal spoilage).
6.24 For Seniors Only
A. Process costing is appropriate in this situation because the returns are very similar in the
amount of time and therefore cost to complete each one. If the returns were more
complex or extra research was needed on certain ones, process costing would no longer
be appropriate because there would be too much variation between different returns.
B. To determine the costs for April, last year’s cost data is needed as well as data from
previous months. Additional information required is the approximate number of returns
will be done, the salary paid to the employees, overhead costs, the number of employees
that will be hired for the month, the amount of time each will work, and the amount of
time it takes for each return. Also, an estimate is needed for the number of returns that
are likely to be in progress at the beginning of April.
C. The first step in determining the cost for April returns is to find the total units in progress
and their percent completion. In addition, the number of returns to be completed in April
needs to be estimated. Last year’s data will be useful in estimating this year’s volume.
Using data mentioned in part B, costs are categorized as direct materials or conversion
costs. An equivalent cost per unit for the tax returns can then be estimated. Once the
number of returns for the month of April has been predicted, the equivalent costs can be
estimated and a total cost for that month can be predicted. It is likely that there will be no
ending WIP inventory, because tax returns are due April 15 and this organization’s
clients are likely to file by the due date rather than request extensions.
To download more slides, ebook, solutions and test bank, visit
6-12 Cost Management
PROBLEMS
6.25 Benton Industries
1. Summarize Total Costs to Account For
FIFO:
Beginning WIP
Current period costs
Total costs to account for
Transferred-in Direct Materials Conversion Costs
$ 40,470
$
0
$ 14,322
224,130
166,840
315,228
$264,600
$166,840
$329,550
Total Cost
$ 54,792
706,198
$760,990
2. Summarize Physical and Equivalent Units
Physical Units
Beginning
WIP (33%)
15,000
Equivalent Units:
Transferred-in
Direct Materials
Conversion Costs
0
0
5,000
Complete
Beginning
WIP (67%)
0
0
15,000
10,000
Work This Period
Start
Start
Total Work
and
Ending
Performed
Total to
Complete
WIP (40%) This Period
Account for
82,000
11,000
93,000
108,000
82,000
82,000
82,000
11,000
0
4,400
93,000
97,000
96,400
3. Calculate First-in, First-out Cost Per Equivalent Unit
Transferred-in:
_____________Transferred-in costs_____________
Equivalent units for total work performed this period
= $224,130
93,000
=$ 2.41
Direct materials:
_____________Direct materials cost_____________
Equivalent units for total work performed this period
= $166,840
97,000
= 1.72
Conversion costs:
______________Conversion costs______________
Equivalent units for total work performed this period
= $315,228
96,400
=
Total cost per equivalent unit:
3.27
$7.40
To download more slides, ebook, solutions and test bank, visit
Chapter 6: Process Costing 6-13
4. Process cost report for the year
Beginning WIP
Costs to complete beginning WIP:
Direct materials
Conversion costs
Total costs added this period
Computation
From last year
15,00 x $1.72
10,000 x $3.27
_____
Total cost of beginning WIP transferred out
New units started, completed, and transferred out
82,000*$7.40
Total units completed and transferred out
Ending WIP:
Transferred-in
Direct materials
Conversion costs
Total ending WIP cost
First-in, First-Out
Units
Costs
15,000
$ 54,792
25,800
32,700
58,500
15,000
113,292
82,000
606,800
97,000
720,092
11,000
11,000 x $2.41
0 x $1.72
4,400 x $3.27
_____
Total Accounted For
108,000
26,510
0
14,388
40,898
$760,990
Notice that the total costs summarized above ($760,990) are equal to the costs accounted for in
the cost report.
6.26 Victoria’s Closet-A
A. Preparation of process cost report using the weighted average method.
Summary of unit information given in the problem:
WIP Units
Beginning (25% complete) 11,000
Started
74,000
61,000
completed
8,000
Ending (75% complete)
16,000
Summary of Spoilage
Good
Normal spoilage
6,600
Spoiled
Abnormal spoilage
Total
???
8,000
When computing equivalent units, notice that the ending WIP inventory units are
considered 100% complete with respect to direct materials, since direct materials are
added at the beginning of processing. However, the ending WIP inventory units are only
75% complete and, hence, have only 75% of the conversion costs (incurred evenly
throughout production). Both normal and abnormal spoilage are assigned 100% of all
costs because spoilage occurs just before inspection, which is at the 100% stage of
completion.
To download more slides, ebook, solutions and test bank, visit
6-14 Cost Management
1. Summarize Total Costs to Account For
Direct Materials
Conversion Costs
$220,000
$30,000
1,480,000
942,000
$1,700,000
$972,000
Beginning WIP
Current period costs
Total costs to account for
Total Cost
$ 250,000
2,422,000
$2,672,000
2. Summarize Physical and Equivalent Units
Physical Units
Complete
Beginning Beginning
WIP (25%) WIP (75%)
11,000
0
Equivalent Units:
Direct Materials
Conversion Costs
11,000
2,750
Work Performed This Period
Start
Start
Total Work
and
Ending
Performed
Complete WIP (75%) This Period
58,000
16,000
74,000
0
8,250
58,000
58,000
16,000
12,000
74,000
78,250
Total
Spoiled
Units to
Units
Account for
(100%)
85,000 (8,000)
Total Work
85,000
81,000
(8,000)
(8,000)
Total Spoilage
Less Normal Spoilage
Abnormal Spoilage
8,000
6,600
1,400
3. Calculate Cost per Equivalent Unit: Weighted Average
Direct materials:
Beginning WIP + Direct materials cost =
Equivalent units for total work
$1,700,000
85,000
Conversion costs:
Beginning WIP + Direct materials cost =
Equivalent units for total work
$972,000
81,000
= $20
=
Total cost per equivalent unit:
12
$32
4. Weighted Average Process Cost Report for January
Computation
Total units completed and transferred out:
Good units
Normal spoilage
Total transferred out
(11,000 + 58,000 – 8,000) x$32
6,600 x $32
Abnormal spoilage
1,400*$32
Ending WIP:
Direct materials
Conversion costs
Total ending WIP cost
16,000 x $20
12,000 x $12
Total Good Units Accounted For
Total Accounted For
Units
61,000
______
61,000
Costs
$1,952,000
211,200
2,163,200
44,800
16,000
85,000 – 8,000
320,000
144,000
464,000
77,000
$2,672,000
B. Journal entries:
Work in process inventory
$1,480,000
Raw materials inventory
$1,480,000
To record the cost of raw materials used in production during January.
To download more slides, ebook, solutions and test bank, visit
Chapter 6: Process Costing 6-15
Work in process inventory
$942,000
Wages and accounts payable
$942,000
To record the conversion costs incurred in production during January.
Finished goods
$2,163,200
Work in process inventory
$2,163,200
To record the cost of 61,000 units transferred to finished goods during January
(includes the cost of normal spoilage).
Abnormal spoilage loss
$44,800
Work in process inventory
To record the cost of abnormal spoilage during January.
$44,800
6.27 Victoria’s Closet-B
A. This problem is identical to problem 6.26, except that the FIFO method is used instead of
the weighted average method. The first two parts of the process cost report are identical
under the two methods. Therefore, the following solution shows only the last two parts
of the process cost report.
3. Calculate Cost per Equivalent Unit: FIFO
Direct materials:
_____________Direct materials cost_____________
Equivalent units for total work performed this period
= $1,480,000
74,000
=$20.0000
Conversion costs:
______________Conversion costs______________
Equivalent units for total work performed this period
= $942,000
78,250
= 12.0383
Total cost per equivalent unit:
$32.0383
To download more slides, ebook, solutions and test bank, visit
6-16 Cost Management
4. FIFO Process Cost Report for Victoria’s Closet
Computation
Beginning WIP
Costs to complete beginning WIP:
Direct materials
Conversion costs
Total costs added this period
Costs
$ 250,000
0x$20
8,250*$12.0383
0
99,316
99,316
_____
Total cost of beginning WIP transferred out
11,000
New units started, completed, and transferred out
50,000*$32.0383
Normal spoilage
6,600*$32.0383
Units completed and transferred out
349,316
50,000
1,601,915
______
211,453
61,000
Abnormal spoilage
1,400*$32.0383
Ending WIP:
Direct materials
Conversion costs
Total ending WIP cost
16,000 x $20
12,000 x $12.0383
Total Good Units Accounted For
Total Costs Accounted For
Units
11,000
2,162,684
44,854
16,000
320,000
144,460
464,460
_____
85,000-8,000
77,000
$2,671,998
B. A standard cost report would be the same as the FIFO cost report from a format
standpoint. However, the standard costs would be used instead of equivalent unit costs.
That is the only difference.
C. If Victoria’s Closet wants to set a benchmark for productivity, standard costs are
appropriate. A standard cost is an estimate of cost under efficient operations and
therefore acts as a benchmark or budget with which actual costs can be compared. The
standards need to be updated regularly, though.
6.28 Kim Mills-A
Summary of information given in the problem:
Beginning
Started
Ending
WIP Units
20,000
????
90,000
completed
7,000
17,000
Summary of Spoilage
Good
Normal spoilage
3,600
Spoiled
Abnormal spoilage
Total
????
7,000
A. Abnormal spoilage = 7,000 – 3,600 = 3,400 units
B. Spoilage costs = 7,000 x $1,000 = $7,000,000
To download more slides, ebook, solutions and test bank, visit
Chapter 6: Process Costing 6-17
C. The opportunity costs of spoilage can be measured in several ways. First, in addition to
the cost of the spoiled units, there is also the contribution margin foregone because the
products could not be sold. In addition, there are the opportunity costs of bad units that
are sold because they pass through inspection without having been detected as spoiled.
Through word of mouth or services such as Consumer Reports or Good Housekeeping, a
company’s reputation may suffer and the organization loses market share. These costs
can be considerable, especially if competitors have reputations for high quality with
similar prices.
6.29 Kim Mills-B
A. If inspection occurs when units are 40% complete, direct materials have already been
added, but conversion costs will only be 40% added.
Equivalent units for direct materials = 100% x 7,000 units = 7,000 units
Equivalent units for conversion costs = 40% x 7,000 units = 2,800 units
B. Abnormal spoilage for conversion costs = 2,800 (total spoilage per Part A) – 1,800
(normal spoilage) = 1,000 units.
C. Here are several advantages of inspecting units earlier in their manufacturing process:
Kim saves the rest of the conversion cost that would be added.
Units are removed from further handling (storage and control), except to dispose
of them.
If the manufacturing process further down the line would tend to hide the defects,
a larger number of defective units are identified, and Kim avoids selling defective
units to customers.
6.30 Red Dog Products
A and B. Weighted average and FIFO process costing reports:
Summarize Physical and Equivalent Units
Physical Units
Equivalent Units:
Direct Materials
Conversion Costs
Beginning
WIP (30%)
20,000
20,000
6,000
Complete
Beginning
WIP (70%)
0
0
14,000
Work This Period
Start
Start
Total Work
Total
and
Ending
Performed
Units to
Complete
WIP (50%) This Period
Account for
68,000
12,000
80,000
100,000
68,000
68,000
12,000
6,000
80,000
88,000
Total Work
100,000
94,000
To download more slides, ebook, solutions and test bank, visit
6-18 Cost Management
Calculate Actual Cost Per Equivalent Unit
First-in, First-out:
Direct materials:
_____________Direct materials cost_____________
Equivalent units for total work performed this period
= $220,000
80,000
=$ 2.75
Conversion costs:
______________Conversion costs______________
Equivalent units for total work performed this period
= $74,000
88,000
=
Total cost per equivalent unit:
0.84
$3.59
Weighted Average:
Direct materials:
Beginning WIP + Direct materials cost =
Equivalent units for total work
$245,000
100,000
=$ 2.45
Conversion costs:
Beginning WIP + Direct materials cost =
Equivalent units for total work
$77,000
94,000
=
Total cost per equivalent unit:
0.82
$3.27
Process Cost Reports for Molding Department: May
Beginning WIP
Costs to complete beginning
WIP:
Direct materials
Conversion costs
Total costs added this period
First-in, First-Out
Computation
Units
Costs
From April
cost report
20,000
$ 28,000
0x$2.75
14,000x$0.84
Total cost of beginning WIP
transferred out
New units started, completed, and
transferred out
68,000x$3.59
Total units completed and
transferred out
Ending WIP:
Direct materials
Conversion costs
Total ending WIP cost
Total Accounted For
_____
0
11,760
11,760
20,000
39,760
68,000
244,120
88,000
283,880
Weighted Average
Computation
Units
Costs
(88,000)x$3.27
12,000
12,000x$2.75
6,000x$0.84
88,000
$287,760
12,000
_____
33,000
5,040
38,040
100,000
$321,920
12,000x$2.45
6,000x$0.82
_____
29,400
4,920
34,320
100,000
$322,080
The total costs to account for disagree with the total calculated in part 1 because of differences
due to rounding the cost per equivalent unit. If students used a spreadsheet for these calculations
they would have no error.
C. Factors that would affect the choice of accounting method include:
The stability of input prices
The need for current price information
To download more slides, ebook, solutions and test bank, visit
Chapter 6: Process Costing 6-19
Whether managers want to compare a standard cost to actual costs
Whether beginning and ending inventory levels are large or small
6.31 Empire Forging
Summary of information given in the problem:
Beginning
Started
Ending
WIP Units
60,000
????
420,000
completed
36,000
68,000
Summary of Spoilage
Good
Normal spoilage
12,600
Spoiled
Abnormal spoilage
Total
??
36,000
A. Abnormal spoilage = Total spoilage – Normal spoilage
= 36,000 – 12,600 = 23,400 units
B. Units started in May: Refer to the above T-Account, and solve for the unknown number
of units started
60,000 + Started – 420,000 – 36,000 = 68,000
Started = 464,000
C. Percentage of good units allowed for spoilage is 3% (12,600/420,000). Total spoiled
units as a percentage of good units is 8.6% (36,000/420,000). When spoilage rates
increase dramatically, it is likely that more spoiled units are sold as good units because
they have been overlooked in the inspection process. This leads to more returns and
potential loss of market share. In addition, the cost of good units increases, and so the
contribution margin on those units decreases. It is also possible that more units have
been reworked, and these could be lower quality than first run units, and rework also
increases the cost of good units.
D. Below are examples of arguments that could be made; students may think of additional
arguments.
The costs of undetected spoiled units can be quite high. Customers are unhappy with
defective units and may not purchase the goods again, so market share could be lost. In
addition, if the defect causes any type of harm, the company could be subject to legal
action and may have to pay a settlement or high legal fees. These costs are difficult to
value. It is much easier to determine the cost of quality improvements, such as more
frequent inspections, quality circles with employees to elicit suggestions for
improvements, or redesigning the product or manufacturing process to reduce defects.
Because of the uncertainty of the costs of spoiled units, the company should analyze costs
for returned units and warranty work, develop better tracking systems so that all spoiled
units are counted (whether they are reworked or not), and hire a marketing company to
identify customers who have quit using its products to determine if quality was a factor in
To download more slides, ebook, solutions and test bank, visit
6-20 Cost Management
this decision. Once the managers have more information, they will better understand the
costs and benefits of quality problems and quality initiatives.
6.32 The Rally Company
A sample spreadsheet showing the solution for this problem is available on the Instructor’s web
site for the textbook (available at www.wiley.com/college/eldenburg).
A. Weighted average: Following are excerpts from the sample spreadsheet for this problem.
A
B
C
D
E
F
G
H
I
J
1
2 Input Area for Assumptions
3 Work Performed:
4
Work in Process:
5
Units
6
% complete direct materials
7
% complete conversion costs
8
Units started
9
Units completed and transferred out
10
Spoiled Units:
11
Normal
12
Abnormal
13
14 Costs:
15
Beginning Work in Process:
16
Direct materials
17
Conversion costs
18
Costs Added This Month:
19
Direct materials
20
Conversion costs
21
A
23
24
25
26
27
28
29
B
C
Beg. WIP End. WIP
2,000
Ending WIP Units were not given,
100%
100%
so they must be calculated:
80%
25%
Beginning WIP
18,000
Units started
14,800
Total to account for
Transferred out*
1,000
Normal spoilage
1,000
Abnormal spoilage
Ending WIP
D
* Note: Only good units
are transferred out
$4,000
$3,200
$36,000
$32,000
E
F
G
H
1. Summarize Total Costs to Account For
Beginning WIP
Current period costs
Total costs to account for
2,000
18,000
20,000
-14,800
-1,000
-1,000
3,200
Direct
Conversion
Materials
Costs
$4,000
$3,200
$36,000
$32,000
$40,000
$35,200
Total
Costs
$7,200
$68,000
$75,200
I
J
To download more slides, ebook, solutions and test bank, visit
Chapter 6: Process Costing 6-21
A
B
C
D
E
F
30
31
32
33
34
35
36
37
38
39
40
41
42
43
44
2. Summarize Physical and Equivalent Units
45
46
47
48
49
50
51
52
53
54
3. Calculate Cost Per Equivalent Unit
55
56
57
58
59
60
61
62
63
64
65
66
67
68
69
70
71
72
4. Weighted Average Process Cost Report for January
G
H
Work Performed This Period
Beginning Complete
Start
Start
Total Work
WIP
Beg. WIP
and
End. WIP Performed
80%
20%
Complete
25%
This Period
2,000
0
14,800
3,200
18,000
Physical Units
Equivalent Units:
Direct Materials
Conversion Costs
2,000
1,600
0
400
14,800
14,800
3,200
800
18,000
16,000
I
Total
Units to
Acct for
20,000
Spoiled
Units
100%
(2,000)
20,000
17,600
(2,000)
(2,000)
Total Spoilage
Less Normal Spoilage
Abnormal Spoilage
A
B
C
2,000
1,000
1,000
D
E
F
G
Weighted Average:
H
I
J
Direct Materials:
Total
Cost
$40,000
Total
Units
20,000
$2.0000
Conversion Costs:
$35,200
17,600
$2.0000
Total Cost Per Equivalent Unit
A
J
B
C
$4.0000
D
E
F
Cost Per
Unit
G
H
I
J
Equivalent
Units
Spoiled
Units
Good
Units
Total
Total units completed and transferred out:
Good units
Normal spoilage
Total transferred out
$4.0000
$4.0000
1,000
$59,200
$4,000
$63,200
Abnormal spoilage
$4.0000
1,000
$4,000
Ending WIP:
Direct materials
Conversion costs
Total ending WIP cost
$2.0000
$2.0000
Total Good Units Accounted For
Total Accounted For
14,800
3,200
3,200
800
_____
(Total to account for - Total spoiled)
$6,400
$1,600
$8,000
18,000
$75,200
B. Journal entries for weighted average method:
Work in process inventory
$36,000
Raw materials inventory
To record the cost of raw materials used in production during July.
$36,000
Work in process inventory
$32,000
Wages and accounts payable
To record the conversion costs incurred in production during July.
$32,000
To download more slides, ebook, solutions and test bank, visit
6-22 Cost Management
Finished goods
$63,200
Work in process inventory
$63,200
To record the cost of 14,800 units transferred to finished goods during July
(includes the cost of normal spoilage).
Abnormal spoilage loss
Work in process inventory
To record the cost of abnormal spoilage during July.
$4,000
$4,000
C. FIFO: Following are excerpts from the sample spreadsheet for this problem.
The input section and the sections for steps 1 and 2 are identical to the spreadsheet shown
in Part A above. Therefore, only the sections for steps 3 and 4 are shown below.
3. Calculate Cost Per Equivalent Unit
FIFO:
Direct Materials:
Current
Cost
$36,000
Current
Units
18,000
$2.0000
Conversion Costs:
$32,000
16,000
$2.0000
Total Cost Per Equivalent Unit
$4.0000
4. FIFO Process Cost Report for January
Beginning WIP
Costs to complete beginning WIP:
Direct materials
Conversion costs
Total costs added this period
Cost Per
Unit
Equivalent
Units
$2.0000
$2.0000
0
400
Spoiled
Units
Total cost of beginning WIP transferred out
Good units started, completed, and trans. out
$4.0000
Normal spoilage
$4.0000
1,000
Total units completed and transferred out
Abnormal spoilage
$4.0000
Ending WIP:
Direct materials
Conversion costs
Total ending WIP cost
$2.0000
$2.0000
Total Good Units Accounted For
Total Accounted For
Good
Units
2,000
Total
$7,200
_____
$0
$800
$800
2,000
$8,000
12,800
$51,200
_____
$4,000
14,800
$63,200
1,000
$4,000
3,200
3,200
800
_____
(Total to account for - Total spoiled)
$6,400
$1,600
$8,000
18,000
$75,200
D. Several factors affect accountants’ choices of costing systems. For process costing, the
two main factors are ease of calculations (although with spreadsheets and software
To download more slides, ebook, solutions and test bank, visit
Chapter 6: Process Costing 6-23
programs that currently of little concern) and the usefulness of more current cost
information. If costs do not change rapidly and there is no need for the most current cost
information, then weighted average is easier to calculate and understand. However, if
managers want to monitor current period costs more closely, then FIFO is a better
method because it better reflects the most current costs.
It appears that Rally’s costs did not change from last period to this period. If costs
change slowly, the weighted average method would be the easiest report to prepare.
6.33 Toddler Toys
Solutions below are provided first for the weighted average method. Then solutions for the FIFO
method are presented.
WEIGHTED AVERAGE SOLUTION
A. If a student chose the weighted average method, its main advantage is that it is a little less
complex to calculate. The disadvantage is that the cost information is not as current as
FIFO information.
B. Here is a cost report using the weighted average method.
1. Summarize Total Costs to Account For
Beginning WIP
Current period costs
Total costs to account for
Transferred-in Direct Materials Conversion Costs Total Cost
$ 4,000
$ 2,000
$ 1,600
$ 7,600
36,000
18,000
16,000
70,000
$40,000
$20,000
$17,600
$77,600
2. Summarize Physical and Equivalent Units
Physical Units
Complete
Beginning Beginning
WIP (80%) WIP (20%)
2,000
0
Equivalent Units:
Transferred in
Direct Materials
Conversion Costs
Normal spoilage
Abnormal Spoilage
Total spoilage
2,000
2,000
1,600
0
0
400
Work Performed This Period
Start
Start
Total Work
and
Ending
Performed
Complete WIP (25%) This Period
14,800
3,200
18,000
14,800
14,800
14,800
3,200
0
800
18,000
14,800
16,000
Total
Spoiled
Units to
Units
Account for
(100%)
20,000 (2,000)
Total Work
20,000
16,800
17,600
(2,000)
(2,000)
1,000
1,000
2,000
To download more slides, ebook, solutions and test bank, visit
6-24 Cost Management
3. Calculate Cost Per Equivalent Unit (Weighted Average)
Transferred-in:
Beginning WIP + Transferred-in costs
Equivalent units for total work
=
$40,000 =$ 2.0000
20,000
Direct materials:
Beginning WIP + Direct materials cost
Equivalent units for total work
=
$20,000 =1.1905
16,800
Conversion costs: Beginning WIP + Direct materials cost
Equivalent units for total work
=
$17,600 = 1.0000
17,600
______
Total cost per equivalent unit:
$4.1905
4. Process Cost Reports for Assembly Department in August (Weighted Average)
Computation
Units
Units completed and transferred out
14,800*$4.1905
14,800
Normal spoilage
1,000 x $4.1905
Total cost transferred out
Abnormal spoilage
Ending work in process:
Transferred-in
Direct materials
Conversion costs
Total ending WIP cost
Total Accounted For
Costs
$62,020
4,190
66,210
1,000 x $4.1905
4,190
3,200
3,200 x $2.0
0 x $1.1905
800 x $1.00
_____
18,000
6,400
0
800
7,200
$77,600
C. Journal entries:
Work in process inventory-Assembly Dept.
$36,000
Work in process inventory-Plastics Dept.
$36,000
To record the cost of units transferred from the plastics department during
August.
Work in process inventory-Assembly Dept.
$18,000
Raw materials inventory
$18,000
To record the cost of raw materials used in production during August.
Work in process inventory-Assembly Dept.
$16,000
Wages and accounts payable
$16,000
To record the conversion costs incurred in production during August.
Finished goods inventory
$66,210
Work in process inventory-Assembly Dept.
$66,210
To record the cost of 14,800 units transferred to finished goods during August
(includes the cost of normal spoilage).
To download more slides, ebook, solutions and test bank, visit
Chapter 6: Process Costing 6-25
Abnormal spoilage loss
$4,190
Work in process inventory-Assembly Dept.
To record the cost of abnormal spoilage during August.
$4,190
FIFO SOLUTION
A. If a student chose FIFO, its main advantage is that the costs are more current, the
disadvantage is that it is a bit more complex to calculate.
B. Here is a cost report using the FIFO method. Notice that the first two parts are identical
to the report under the weighted average method.
1. Summarize Total Costs to Account For
Beginning WIP
Current period costs
Total costs to account for
Transferred-in Direct Materials Conversion Costs Total Cost
$ 4,000
$ 2,000
$ 1,600
$ 7,600
36,000
18,000
16,000
70,000
$40,000
$20,000
$17,600
$77,600
2. Summarize Physical and Equivalent Units
Physical Units
Complete
Beginning Beginning
WIP (80%) WIP (20%)
2,000
0
Equivalent Units:
Transferred in
Direct Materials
Conversion Costs
2,000
2,000
1,600
0
0
400
Work Performed This Period
Start
Start
Total Work
and
Ending
Performed
Complete WIP (25%) This Period
14,800
3,200
18,000
14,800
14,800
14,800
3,200
0
800
18,000
14,800
16,000
Total
Spoiled
Units to
Units
Account for
(100%)
20,000 (2,000)
Total Work
20,000
16,800
17,600
Normal spoilage
Abnormal Spoilage
Total spoilage
(2,000)
(2,000)
1,000
1,000
2,000
3. Calculate Cost Per Equivalent Unit (FIFO)
Transferred-in: _________Transferred-in costs__________ =
Equiv. units for work performed this period
$36,000
18,000
=$2.0000
Direct materials: __________Direct materials cost_________ =
Equiv. units for work performed this period
$18,000
14,800
=1.2162
Conversion costs:___________Conversion costs__________ =
Equiv. units for work performed this period
$16,000
16,000
= 1.0000
______
Total cost per equivalent unit:
$4.2162