Solution manual intermediate accounting 13e kieso ch09
Bạn đang xem bản rút gọn của tài liệu. Xem và tải ngay bản đầy đủ của tài liệu tại đây (850.59 KB, 80 trang )
To download more slides, ebook, solutions and test bank, visit
CHAPTER 9
Inventories: Additional Valuation Issues
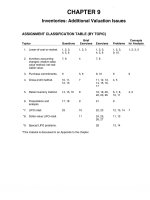
ASSIGNMENT CLASSIFICATION TABLE (BY TOPIC)
Topics
Questions
Brief
Exercises
Problems
1, 2, 3,
9, 10
1, 2, 3, 5
6
1. Lower-of-cost-or-market.
1, 2, 3,
4, 5, 6
1, 2, 3
1, 2, 3,
4, 5, 6
2. Inventory accounting
changes; relative sales
value method; net realizable value.
7, 8
4
7, 8
3. Purchase commitments.
9
5, 6
9, 10
9
4. Gross profit method.
10, 11,
12, 13
7
11, 12, 13,
14, 15, 16,
17
4, 5
5. Retail inventory method.
14, 15, 16
8
18, 19, 20,
22, 23, 26
6, 7, 8,
10, 11
6. Presentation and
analysis.
17, 18
9
21
9
23
10
22, 23
12, 13, 14
11
24, 25,
26, 27
11, 13
28
13, 14
*7. LIFO retail.
*8. Dollar-value LIFO retail.
*9. Special LIFO problems.
Concepts
for Analysis
Exercises
4, 5
7
*This material is discussed in an Appendix to the chapter.
Copyright © 2010 John Wiley & Sons, Inc.
Kieso, Intermediate Accounting, 13/e, Solutions Manual
(For Instructor Use Only)
9-1
To download more slides, ebook, solutions and test bank, visit
ASSIGNMENT CLASSIFICATION TABLE (BY LEARNING OBJECTIVE)
Brief
Exercises
Learning Objectives
Exercises
Problems
1.
Describe and apply the lower-of-cost-or-market rule.
1, 2, 3
1, 2, 3,
4, 5, 6
1, 2, 3,
9, 10
2.
Explain when companies value inventories at net
realizable value.
1, 2, 3
1, 2, 3,
4, 5, 6
1, 2, 3,
9, 10
3.
Explain when companies use the relative sales value
method to value inventories.
4
7, 8
4.
Discuss accounting issues related to purchase
commitments.
5, 6
9, 10
9
5.
Determine ending inventory by applying the gross
profit method.
7
11, 12, 13,
14, 15, 16,
17
4, 5
6.
Determine ending inventory by applying the retail
inventory method.
8
18, 19, 20
6, 7, 8
7.
Explain how to report and analyze inventory.
9
21
9
Determine ending inventory by applying the LIFO
retail methods.
10, 11
22, 23, 24,
25, 26, 27,
28
11, 12,
13, 14
*8.
*This material is discussed in an Appendix to the chapter.
9-2
Copyright © 2010 John Wiley & Sons, Inc.
Kieso, Intermediate Accounting, 13/e, Solutions Manual
(For Instructor Use Only)
To download more slides, ebook, solutions and test bank, visit
ASSIGNMENT CHARACTERISTICS TABLE
Item
Description
Level of
Difficulty
E9-1
E9-2
E9-3
E9-4
E9-5
E9-6
E9-7
E9-8
E9-9
E9-10
E9-11
E9-12
E9-13
E9-14
E9-15
E9-16
E9-17
E9-18
E9-19
E9-20
E9-21
*E9-22
*E9-23
*E9-24
*E9-25
*E9-26
*E9-27
*E9-28
Lower-of-cost-or-market.
Lower-of-cost-or-market.
Lower-of-cost-or-market.
Lower-of-cost-or-market—journal entries.
Lower-of-cost-or-market—valuation account.
Lower-of-cost-or-market—error effect.
Relative sales value method.
Relative sales value method.
Purchase commitments.
Purchase commitments.
Gross profit method.
Gross profit method.
Gross profit method.
Gross profit method.
Gross profit method.
Gross profit method.
Gross profit method.
Retail inventory method.
Retail inventory method.
Retail inventory method.
Analysis of inventories.
Retail inventory method—conventional and LIFO.
Retail inventory method—conventional and LIFO.
Dollar-value LIFO retail.
Dollar-value LIFO retail.
Conventional retail and dollar-value LIFO retail.
Dollar-value LIFO retail.
Change to LIFO retail.
Simple
Simple
Simple
Simple
Moderate
Simple
Simple
Simple
Simple
Simple
Simple
Simple
Simple
Moderate
Simple
Simple
Moderate
Moderate
Simple
Simple
Simple
Moderate
Moderate
Simple
Simple
Moderate
Moderate
Simple
15–20
10–15
15–20
10–15
20–25
10–15
15–20
12–17
05–10
15–20
8–13
10–15
15–20
15–20
10–15
15–20
20–25
20–25
12–17
20–25
10–15
25–35
15–20
10–15
5–10
20–25
20–25
10–15
P9-1
P9-2
P9-3
Lower-of-cost-or-market.
Lower-of-cost-or-market.
Entries for lower-of-cost-or-market—direct
and allowance.
Gross profit method.
Gross profit method.
Retail inventory method.
Retail inventory method.
Simple
Moderate
Moderate
10–15
25–30
30–35
Moderate
Complex
Moderate
Moderate
20–30
40–45
20–30
20–30
P9-4
P9-5
P9-6
P9-7
Copyright © 2010 John Wiley & Sons, Inc.
Kieso, Intermediate Accounting, 13/e, Solutions Manual
Time
(minutes)
(For Instructor Use Only)
9-3
To download more slides, ebook, solutions and test bank, visit
ASSIGNMENT CHARACTERISTICS TABLE (Continued)
Level of
Difficulty
Time
(minutes)
Moderate
Moderate
20–30
30–40
P9-10
*P9-11
*P9-12
*P9-13
*P9-14
Retail inventory method.
Statement and note disclosure, LCM, and purchase
commitment.
Lower-of-cost-or-market.
Conventional and dollar-value LIFO retail.
Retail, LIFO retail, and inventory shortage.
Change to LIFO retail.
Change to LIFO retail; dollar-value LIFO retail.
Moderate
Moderate
Moderate
Moderate
Complex
30–40
30–35
30–40
30–40
40–50
CA9-1
CA9-2
CA9-3
CA9-4
CA9-5
CA9-6
*CA9-7
Lower-of-cost-or-market.
Lower-of-cost-or-market.
Lower-of-cost-or-market.
Retail inventory method.
Cost determination, LCM, retail method.
Purchase commitments.
Retail inventory method and LIFO retail.
Moderate
Moderate
Moderate
Moderate
Moderate
Moderate
Simple
15–25
20–30
15–20
25–30
15–25
20–25
10–15
Item
P9-8
P9-9
9-4
Description
Copyright © 2010 John Wiley & Sons, Inc.
Kieso, Intermediate Accounting, 13/e, Solutions Manual
(For Instructor Use Only)
To download more slides, ebook, solutions and test bank, visit
SOLUTIONS TO CODIFICATION EXERCISES
CE9-1
(a)
According to the Master Glossary, Inventory is defined as the aggregate of those items of tangible
personal property that have any of the following characteristics:
1. Held for sale in the ordinary course of business
2. In process of production for such sale
3. To be currently consumed in the production of goods or services to be available for sale.
The term inventory embraces goods awaiting sale (the merchandise of a trading concern and the
finished goods of a manufacturer), goods in the course of production (work in process), and goods
to be consumed directly or indirectly in production (raw materials and supplies). This definition of
inventories excludes long-term assets subject to depreciation accounting, or goods which, when
put into use, will be so classified. The fact that a depreciable asset is retired from regular use and
held for sale does not indicate that the item should be classified as part of the inventory. Raw
materials and supplies purchased for production may be used or consumed for the construction of
long-term assets or other purposes not related to production, but the fact that inventory items
representing a small portion of the total may not be absorbed ultimately in the production process
does not require separate classification. By trade practice, operating materials and supplies of
certain types of entities such as oil producers are usually treated as inventory.
(b)
According to the Master Glossary, the phrase lower-of-cost-or-market, the term market means
current replacement cost (by purchase or by reproduction, as the case may be) provided that it
meets both of the following conditions.
1. Market shall not exceed the net realizable value
2. Market shall not be less than net realizable value reduced by an allowance for an approximately normal profit margin.
(c)
According to the Master Glossary, two definitions are provided for the phrase Net Realizable
Value
1. Estimated selling price in the ordinary course of business less reasonably predictable costs of
completion and disposal.
2. Valuation of inventories at estimated selling prices in the ordinary course of business, less
reasonably predictable costs of completion, disposal, and transportation.
The second definition provides a link to guidance for lower-of-cost-or-market in the agricultural industry
(FASB ASC 905-330-35)
Growing Crops
35-1
Costs of growing crops shall be accumulated until the time of harvest. Growing crops shall be
reported at the lower-of-cost-or-market.
> Developing Animals
35-2
Developing animals to be held for sale shall be valued at the lower-of-cost-or-market.
Copyright © 2010 John Wiley & Sons, Inc.
Kieso, Intermediate Accounting, 13/e, Solutions Manual
(For Instructor Use Only)
9-5
To download more slides, ebook, solutions and test bank, visit
CE9-1 (Continued)
> Animals Available and Held for Sale
35-3
Animals held for sale shall be valued at either of the following:
(a) The lower-of-cost-or-market
(b) At sales price less estimated costs of disposal, if all the following conditions exist:
1. The product has a reliable, readily determinable, and realizable market price.
2. The product has relatively insignificant and predictable costs of disposal.
3. The product is available for immediate delivery.
Inventories of harvested crops and livestock held for sale and commonly referred to as valued at
market are actually valued at net realizable value.
> Harvested Crops
35-4
Inventories of harvested crops shall be valued using the same criteria as animals held for sale in
the preceding paragraph.
CE9-2
According to FASB ASC 330-10-35-1 through 5: Adjustments to Lower-of-Cost-or-Market
A departure from the cost basis of pricing the inventory is required when the utility of the goods is no
longer as great as their cost. Where there is evidence that the utility of goods, in their disposal in the
ordinary course of business, will be less than cost, whether due to physical deterioration, obsolescence,
changes in price levels, or other causes, the difference shall be recognized as a loss of the current
period. This is generally accomplished by stating such goods at a lower level commonly designated as
market. Thus, in accounting for inventories, a loss shall be recognized whenever the utility of goods is
impaired by damage, deterioration, obsolescence, changes in price levels, or other causes.
The measurement of such losses shall be accomplished by applying the rule of pricing inventories at
the lower-of-cost-or-market. This provides a practical means of measuring utility and thereby determining the amount of the loss to be recognized and accounted for in the current period. However, utility
is indicated primarily by the current cost of replacement of the goods as they would be obtained by
purchase or reproduction. In applying the rule, however, judgment must always be exercised and no
loss shall be recognized unless the evidence indicates clearly that a loss has been sustained.
Replacement or reproduction prices would not be appropriate as a measure of utility when the estimated sales value, reduced by the costs of completion and disposal, is lower, in which case the realizable
value so determined more appropriately measures utility.
In addition, when the evidence indicates that cost will be recovered with an approximately normal profit
upon sale in the ordinary course of business, no loss shall be recognized even though replacement or
reproduction costs are lower. This might be true, for example, in the case of production under firm sales
contracts at fixed prices, or when a reasonable volume of future orders is assured at stable selling prices.
In summary, the determination of the amount of the write-off should be based on factors that relate to
the net realizable value of the inventory, not the amount that will maximize the loss in the current
period. Note that the sale manager’s proposed accounting is an example of “cookie jar” reserves, as
discussed in Chapter 4. By writing the inventory down to an unsupported low value, the company can
report higher gross profit and net income in subsequent periods when the inventory is sold.
9-6
Copyright © 2010 John Wiley & Sons, Inc.
Kieso, Intermediate Accounting, 13/e, Solutions Manual
(For Instructor Use Only)
To download more slides, ebook, solutions and test bank, visit
CE9-3
According to FASB ASC 330-10-35-6, if inventory has been the hedged item in a fair value hedge, the
inventory’s cost basis used in the lower-of-cost-or-market accounting shall reflect the effect of the
adjustments of its carrying amount made pursuant to paragraph 815-25-35-1(b). And, according to 8152-35-1(b), gains and losses on a qualifying fair value hedge shall be accounted for as follows: The gain
or loss (that is, the change in fair value) on the hedged item attributable to the hedged risk shall adjust
the carrying amount of the hedged item and be recognized currently in earnings.
CE9-4
See FASB ASC 210-10-S99—Regulation S-X Rule 5-02, Balance Sheets
S99-1 The following is the text of Regulation S-X Rule 5-02, Balance Sheets.
The purpose of this rule is to indicate the various line items and certain additional disclosures
which, if applicable, and except as otherwise permitted by the Commission, should appear on
the face of the balance sheets or related notes filed for the persons to whom this article pertains
(see § 210.4–01(a)).
• ASSETS AND OTHER DEBITS
• Current Assets, when appropriate
• [See § 210.4–05]
• 6. Inventories.
– (a) State separately in the balance sheet or in a note thereto, if practicable, the amounts of
major classes of inventory such as:
• 1. Finished goods;
• 2. inventoried cost relating to long-term contracts or programs (see (d) below and §
210.4–05);
• 3. work in process (see § 210.4–05);
• 4. raw materials; and
• 5. supplies.
– If the method of calculating a LIFO inventory does not allow for the practical determination of
amounts assigned to major classes of inventory, the amounts of those classes may be stated
under cost flow assumptions other that LIFO with the excess of such total amount over the
aggregate LIFO amount shown as a deduction to arrive at the amount of the LIFO inventory.
– (b) The basis of determining the amounts shall be stated.
If cost is used to determine any portion of the inventory amounts, the description of this method
shall include the nature of the cost elements included in inventory. Elements of cost include,
among other items, retained costs representing the excess of manufacturing or production costs
over the amounts charged to cost of sales or delivered or in-process units, initial tooling or other
deferred startup costs, or general and administrative costs.
– The method by which amounts are removed from inventory (e.g., average cost, first-in, firstout, last-in, first-out, estimated average cost per unit) shall be described. If the estimated
average cost per unit is used as a basis to determine amounts removed from inventory under
a total program or similar basis of accounting, the principal assumptions (including, where
meaningful, the aggregate number of units expected to be delivered under the program, the
number of units delivered to date and the number of units on order) shall be disclosed.
Copyright © 2010 John Wiley & Sons, Inc.
Kieso, Intermediate Accounting, 13/e, Solutions Manual
(For Instructor Use Only)
9-7
To download more slides, ebook, solutions and test bank, visit
CE9-4 (Continued)
– If any general and administrative costs are charged to inventory, state in a note to the
financial statements the aggregate amount of the general and administrative costs incurred in
each period and the actual or estimated amount remaining in inventory at the date of each
balance sheet.
– (c)
If the LIFO inventory method is used, the excess of replacement or current cost over
stated LIFO value shall, if material, be stated parenthetically or in a note to the financial
statements.
– (d) For purposes of §§ 210.5–02.3 and 210.5–02.6, long-term contracts or programs include
• 1. all contracts or programs for which gross profits are recognized on a percentageof-completion method of accounting or any variant thereof (e.g., delivered unit,
cost to cost, physical completion), and
• 2. any contracts or programs accounted for on a completed contract basis of
accounting where, in either case, the contracts or programs have associated with
them material amounts of inventories or unbilled receivables and where such
contracts or programs have been or are expected to be performed over a period
of more than twelve months. Contracts or programs of shorter duration may also
be included, if deemed appropriate.
– For all long-term contracts or programs, the following information, if applicable, shall be stated
in a note to the financial statements:
(i) The aggregate amount of manufacturing or production costs and any related deferred
costs (e.g., initial tooling costs) which exceeds the aggregate estimated cost of all inprocess and delivered units on the basis of the estimated average cost of all units
expected to be produced under long-term contracts and programs not yet complete, as
well as that portion of such amount which would not be absorbed in cost of sales on
existing firm orders at the latest balance sheet date. In addition, if practicable, disclose the
amount of deferred costs by type of cost (e.g., initial tooling, deferred production, etc.)
(ii) The aggregate amount representing claims or other similar items subject to uncertainty
concerning their determination or ultimate realization, and include a description of the
nature and status of the principal items comprising such aggregate amount.
(iii) The amount of progress payments netted against inventory at the date of the balance
sheet.
9-8
Copyright © 2010 John Wiley & Sons, Inc.
Kieso, Intermediate Accounting, 13/e, Solutions Manual
(For Instructor Use Only)
To download more slides, ebook, solutions and test bank, visit
ANSWERS TO QUESTIONS
1. Where there is evidence that the utility of goods to be disposed of in the ordinary course of business will be less than cost, the difference should be recognized as a loss in the current period, and
the inventory should be stated at market value in the financial statements.
2. The upper (ceiling) and lower (floor) limits for the value of the inventory are intended to prevent the
inventory from being reported at an amount in excess of the net realizable value or at an amount
less than the net realizable value less a normal profit margin. The maximum limitation, not to
exceed the net realizable value (ceiling) covers obsolete, damaged, or shopworn material and
prevents overstatement of inventories and understatement of the loss in the current period. The
minimum limitation deters understatement of inventory and overstatement of the loss in the current
period.
3. The usual basis for carrying forward the inventory to the next period is cost. Departure from cost is
required, however, when the utility of the goods included in the inventory is less than their cost.
This loss in utility should be recognized as a loss of the current period, the period in which it
occurred. Furthermore, the subsequent period should be charged for goods at an amount that
measures their expected contribution to that period. In other words, the subsequent period should
be charged for inventory at prices no higher than those which would have been paid if the
inventory had been obtained at the beginning of that period. (Historically, the lower-of-cost-ormarket rule arose from the accounting convention of providing for all losses and anticipating no
profits.)
In accordance with the foregoing reasoning, the rule of “cost or market, whichever is lower” may
be applied to each item in the inventory, to the total of the components of each major category, or
to the total of the inventory, whichever most clearly reflects operations. The rule is usually applied
to each item, but if individual inventory items enter into the same category or categories of finished
product, alternative procedures are suitable.
The arguments against the use of the lower-of-cost-or-market method of valuing inventories
include the following:
(a) The method requires the reporting of estimated losses (all or a portion of the excess of actual
cost over replacement cost) as definite income charges even though the losses have not been
sustained to date and may never be sustained. Under a consistent criterion of realization a
drop in replacement cost below original cost is no more a sustained loss than a rise above
cost is a realized gain.
(b) A price shrinkage is brought into the income statement before the loss has been sustained
through sale. Furthermore, if the charge for the inventory write-downs is not made to a special
loss account, the cost figure for goods actually sold is inflated by the amount of the estimated
shrinkage in price of the unsold goods. The title “Cost of Goods Sold” therefore becomes a
misnomer.
(c) The method is inconsistent in application in a given year because it recognizes the propriety
of implied price reductions but gives no recognition in the accounts or financial statements to
the effect of the price increases.
(d) The method is also inconsistent in application in one year as opposed to another because the
inventory of a company may be valued at cost in one year and at market in the next year.
(e) The lower-of-cost-or-market method values the inventory in the balance sheet conservatively.
Its effect on the income statement, however, may be the opposite. Although the income
statement for the year in which the unsustained loss is taken is stated conservatively, the net
income on the income statement of the subsequent period may be distorted if the expected
reductions in sales prices do not materialize.
Copyright © 2010 John Wiley & Sons, Inc.
Kieso, Intermediate Accounting, 13/e, Solutions Manual
(For Instructor Use Only)
9-9
To download more slides, ebook, solutions and test bank, visit
Questions Chapter 9 (Continued)
(f)
In the application of the lower-of-cost-or-market rule a prospective “normal profit” is used in
determining inventory values in certain cases. Since “normal profit” is an estimated figure
based upon past experiences (and might not be attained in the future), it is not objective in
nature and presents an opportunity for manipulation of the results of operations.
4. The lower-of-cost-or-market rule may be applied directly to each item or to the total of the inventory (or in some cases, to the total of the components of each major category). The method
should be the one that most clearly reflects income. The most common practice is to price the
inventory on an item-by-item basis. Companies favor the individual item approach because tax
requirements require that an individual item basis be used unless it involves practical difficulties. In
addition, the individual item approach gives the most conservative valuation for balance sheet
purposes.
5. (1)
(2)
(3)
(4)
(5)
$14.50.
$16.10.
$13.75.
$9.70.
$15.90.
6. One approach is to record the inventory at cost and then reduce it to market, thereby reflecting a
loss in the current period (often referred to as the indirect method). The loss would then be shown
as a separate item in the income statement and the cost of goods sold for the year would not be
distorted by its inclusion. An objection to this method of valuation is that an inconsistency is
created between the income statement and balance sheet. In attempting to meet this inconsistency
some have advocated the use of a special account to receive the credit for such an inventory
write-down, such as Allowance to Reduce Inventory to Market which is a contra account against
inventory on the balance sheet. It should be noted that the disposition of this account presents
problems to accountants.
Another approach is merely to substitute market for cost when pricing the new inventory (often
referred to as the direct method). Such a procedure increases cost of goods sold by the amount of
the loss and fails to reflect this loss separately. For this reason, many theoretical objections can be
raised against this procedure.
7. An exception to the normal recognition rule occurs where (1) there is a controlled market with a
quoted price applicable to specific commodities and (2) no significant costs of disposal are
involved. Certain agricultural products and precious metals which are immediately marketable at
quoted prices are often valued at net realizable value (market price).
8. Relative sales value is an appropriate basis for pricing inventory when a group of varying units is
purchased at a single lump-sum price (basket purchase). The purchase price must be allocated in
some manner or on some basis among the various units. When the units vary in size, character,
and attractiveness, the basis for allocation must reflect both quantitative and qualitative aspects. A
suitable basis then is the relative sales value of the units that comprise the inventory.
9. The drop in the market price of the commitment should be charged to operations in the current year
if it is material in amount. The following entry would be made [($6.20 – $5.90) X 150,000] = $45,000:
Unrealized Holding Gain or Loss—Income (Purchase Commitments) ...........
Estimated Liability on Purchase Commitments ......................................
45,000
45,000
The entry is made because a loss in utility has occurred during the period in which the market
decline took place. The account credited in the above entry should be included among the current
liabilities on the balance sheet with an appropriate note indicating the nature and extent of the
commitment. This liability indicates the minimum obligation on the commitment contract at the
present time—the amount that would have to be forfeited in case of breach of contract.
9-10
Copyright © 2010 John Wiley & Sons, Inc.
Kieso, Intermediate Accounting, 13/e, Solutions Manual
(For Instructor Use Only)
To download more slides, ebook, solutions and test bank, visit
Questions Chapter 9 (Continued)
10. The major uses of the gross profit method are: (1) it provides an approximation of the ending inventory which the auditor might use for testing validity of physical inventory count; (2) it means that
a physical count need not be taken every month or quarter; and (3) it helps in determining
damages caused by casualty when inventory cannot be counted.
11. Gross profit as a percentage of sales indicates that the margin is based on selling price rather than
cost; for this reason the gross profit as a percentage of selling price will always be lower than if
based on cost. Conversions are as follows:
25% on cost =
33 1/3% on cost =
33 1/3% on selling price =
60% on selling price =
20% on selling price
25% on selling price
50% on cost
150% on cost
12. A markup of 25% on cost equals a 20% markup on selling price; therefore, gross profit equals
$1,000,000 ($5 million X 20%) and net income equals $250,000 [$1,000,000 – (15% X $5 million)].
The following formula was used to compute the 20% markup on selling price:
Gross profit on selling price =
Percentage markup on cost
.25
=
= 20%
100% + Percentage markup on cost
1 + .25
13. Inventory, January 1, 2011...................................................................................
Purchases to February 10, 2011.........................................................................
Freight-in to February 10, 2011...........................................................................
Merchandise available .................................................................................
Sales to February 10, 2011..................................................................................
Less gross profit at 40% ..............................................................................
Sales at cost..............................................................................................
Inventory (approximately) at February 10, 2011 ......................
$ 400,000
$1,140,000
60,000
1,200,000
1,600,000
1,950,000
780,000
1,170,000
$ 430,000
14. The validity of the retail inventory method is dependent upon (1) the composition of the inventory
remaining approximately the same at the end of the period as it was during the period, and
(2) there being approximately the same rate of markup at the end of the year as was used
throughout the period.
The retail method, though ordinarily applied on a departmental basis, may be appropriate for the
business as a unit if the above conditions are met.
15. The conventional retail method is a statistical procedure based on averages whereby inventory
figures at retail are reduced to an inventory valuation figure by multiplying the retail figures by a
percentage which is the complement of the markup percent.
To determine the markup percent, original markups and additional net markups are related to the
original cost. The complement of the markup percent so determined is then applied to the inventory
at retail after the latter has been reduced by net markdowns, thus in effect achieving a lower-ofcost-or-market valuation.
An example of reduction to market follows:
Assume purchase of 100 items at $1 each, marked to sell at $1.50 each, at which price 80 were
sold. The remaining 20 are marked down to $1.15 each.
The inventory at $15.33 is $4.67 below original cost and is valued at an amount which will produce
the “normal” 33 1/3% gross profit if sold at the present retail price of $23.00.
Copyright © 2010 John Wiley & Sons, Inc.
Kieso, Intermediate Accounting, 13/e, Solutions Manual
(For Instructor Use Only)
9-11
To download more slides, ebook, solutions and test bank, visit
Questions Chapter 9 (Continued)
Computation of Inventory
Purchases
Sales
Markdowns (20 X $.35)
Inventory at retail
Inventory at lower-of-cost-or-market $23 X 66 2/3% = $15.33
16. (a)
Cost
Retail
Ratio
$100
$150
(120)
(7)
$ 23
66 2/3%
Ending inventory:
Cost
Beginning inventory ......................................................................... $ 149,000
Purchases.......................................................................................... 1,400,000
Freight-in............................................................................................
70,000
Totals ........................................................................................ 1,619,000
Add net markups .............................................................................. _________
$1,619,000
Deduct net markdowns ...................................................................
Deduct sales .....................................................................................
Ending inventory, at retail...............................................................
Ratio of cost to selling price
$1,619,000
$2,535,500
Retail
$
283,500
2,160,000
2,443,500
92,000
2,535,500
48,000
2,487,500
2,175,000
$ 312,500
= 64%.
Ending inventory estimated at cost = 64% X $312,500 = $200,000.
(b)
The retail method, above, showed an ending inventory at retail of $312,500; therefore, merchandise not accounted for amounts to $17,500 ($312,500 – $295,000) at retail and $11,200
($17,500 X .64) at cost.
17. Information relative to the composition of the inventory (i.e., raw material, work-in-process, and
finished goods); the inventory financing where significant or unusual (transactions with related
parties, product financing arrangements, firm purchase commitments, involuntary liquidations of
LIFO inventories, pledging inventories as collateral); and the inventory costing methods employed
(lower-of-cost-or-market, FIFO, LIFO, average cost) should be disclosed. If Deere Company uses
LIFO, it should also report the LIFO reserve.
18. Inventory turnover measures how quickly inventory is sold. Generally, the higher the inventory
turnover, the better the enterprise is performing. The more times the inventory turns over, the
smaller the net margin can be to earn an appropriate total profit and return on assets. For
example, a company can price its goods lower if it has a high inventory turnover. A company with
a low profit margin, such as 2%, can earn as much as a company with a high net profit margin,
such as 40%, if its inventory turnover is often enough. To illustrate, a grocery store with a 2% profit
margin can earn as much as a jewelry store with a 40% profit margin and an inventory turnover of
1 if its turnover is more than 20 times.
19. The major iGAAP requirements related to accounting and reporting for inventories is found in IAS
2 (Inventories), IAS 18 (Revenue) and IAS 41 (Agriculture).
9-12
Copyright © 2010 John Wiley & Sons, Inc.
Kieso, Intermediate Accounting, 13/e, Solutions Manual
(For Instructor Use Only)
To download more slides, ebook, solutions and test bank, visit
Questions Chapter 9 (Continued)
20. Key Similarities are (1) the guidelines on who owns the goods—goods in transit, consigned
goods, special sales agreements, and the costs to include in inventory are essentially accounted
for the same under iGAAP and U.S. GAAP; (2) use of specific identification cost flow assumption,
where appropriate; (3) unlike property plant and equipment, iGAAP does not permit the option of
valuing inventories at fair value. As indicated above, iGAAP requires inventory to be written down,
but inventory cannot be written up above its original cost; (4) certain agricultural products and
minerals and mineral products can be reported at net realizable value using iGAAP.
Key differences are related to (1) the LIFO cost flow assumption—U.S. GAAP permits the use of
LIFO for inventory valuation. iGAAP prohibits its use. FIFO and average-cost are the only two
acceptable cost flow assumptions permitted under iGAAP; (2) lower-of-cost-or-market test for
inventory valuation—iGAAP defines market as net realizable value. U.S. GAAP on the other hand
defines market as replacement cost subject to the constraints of net realizable value (the ceiling) and
net realizable value less a normal markup (the floor). That is, iGAAP does not use a ceiling or a
floor to determine market; (3) inventory write-downs—under U.S. GAAP, if inventory is written down
under the lower-of-cost-or-market valuation, the new basis is now considered its cost. As a result,
the inventory may not be written back up to its original cost in a subsequent period. Under iGAAP, the
write-down may be reversed in a subsequent period up to the amount of the previous write-down.
Both the write-down and any subsequent reversal should be reported on the income statement;
(4) The requirements for accounting and reporting for inventories are more principles-based under
iGAAP. That is, U.S. GAAP provides more detailed guidelines in inventory accounting.
21. As shown in the analysis below, under iGAAP, LaTour’s inventory turnover ratio is computed as
follows:
Cost of Goods Sold €578
=
= 3.75 or approximately 97 days (365 ÷ 3.75).
Average Inventory €154
Difficulties in comparison to a company using U.S. GAAP could arise if the U.S. company uses the
LIFO cost flow assumption, which is prohibited under iGAAP. Generally in times of rising prices,
LIFO results in lower inventory balance reported on the balance sheet (assume more recently
purchased items are sold first). Thus, the U.S. GAAP company will report higher inventory turnover
ratios. The LIFO reserve can be used to adjust the reported LIFO numbers to FIFO and to permit
an “apples to apples” comparison.
22. Reed must not be aware the important convergence issue arising from the use of the LIFO cost
flow assumption; iGAAP specifically prohibits its use. Conversely, the LIFO cost flow assumption is
widely used in the United States because of its favorable tax advantages. In addition, many argue
that LIFO from a financial reporting point of view provides a better matching of current costs
against revenue and therefore a more realistic income is computed.
The problem is compounded in the United States because LIFO cannot be used for tax purposes
unless it is used for financial reporting purposes. As a result, unless the tax law is changed, it is
unlikely that U.S. GAAP will eliminate the use of the LIFO cost flow assumption because of its
substantial tax advantages for many companies.
Also, U.S. GAAP has more detailed rules related to accounting and reporting of inventories than
iGAAP. We expect that these more detailed rules will be used internationally because they provide
practical guidance for some inventory accounting and reporting issues.
*23. Two major modifications are necessary. First, the beginning inventory should be excluded from the
numerator and denominator of the cost-to-retail percentage and second, markdowns should be
included in the denominator of the cost-to-retail percentage.
Copyright © 2010 John Wiley & Sons, Inc.
Kieso, Intermediate Accounting, 13/e, Solutions Manual
(For Instructor Use Only)
9-13
To download more slides, ebook, solutions and test bank, visit
SOLUTIONS TO BRIEF EXERCISES
BRIEF EXERCISE 9-1
(a)
Ceiling
$193.00 ($212 – $19)
Floor
$161.00 ($212 – $19 – $32)
(b)
$106.00
(c)
$51.00
BRIEF EXERCISE 9-2
Designated
Item
Cost
Market
LCM
$2,000
$2,050
$2,000
Penguins
5,000
4,950
4,950
Riddlers
Scarecrows
4,400
3,200
4,550
3,070
4,400
3,070
Jokers
BRIEF EXERCISE 9-3
(a)
Direct method
Cost of Goods Sold ...........................................................
Inventory.....................................................................
(b)
21,000
21,000
Indirect method
Loss Due to Market Decline of Inventory ...................
21,000
Allowance to Reduce Inventory to Market ......
9-14
Copyright © 2010 John Wiley & Sons, Inc.
Kieso, Intermediate Accounting, 13/e, Solutions Manual
21,000
(For Instructor Use Only)
To download more slides, ebook, solutions and test bank, visit
BRIEF EXERCISE 9-4
Group
Number
of CDs
Sales
Price
per CD
1
2
3
100
800
100
$ 5
$10
$15
*$500/$10,000 = 5/100
Total
Sales
Price
$
500
8,000
1,500
$10,000
Relative
Sales
Price
Cost
Allocated
to CDs
Total
Cost
5/100* X $8,000 =
80/100 X $8,000 =
15/100 X $8,000 =
Cost
per CD
$ 400
6,400
1,200
$8,000
$ 4**
$ 8
$12
**$400/100 = $4
BRIEF EXERCISE 9-5
Unrealized Holding Loss—Income (Purchase
Commitments).....................................................................
Estimated Liability on Purchase
Commitments............................................................
50,000
50,000
BRIEF EXERCISE 9-6
Purchases (Inventory)..........................................................
Estimated Liability on Purchase Commitments ..........
Cash ................................................................................
950,000
50,000
1,000,000
BRIEF EXERCISE 9-7
Beginning inventory .............................................................
Purchases ................................................................................
Cost of goods available.......................................................
Sales...........................................................................................
Less gross profit (35% X 700,000)....................................
Estimated cost of goods sold............................................
Estimated ending inventory destroyed in fire..............
Copyright © 2010 John Wiley & Sons, Inc.
Kieso, Intermediate Accounting, 13/e, Solutions Manual
$150,000
500,000
650,000
$700,000
245,000
455,000
$195,000
(For Instructor Use Only)
9-15
To download more slides, ebook, solutions and test bank, visit
BRIEF EXERCISE 9-8
Cost
Retail
Beginning inventory.....................................................
$ 12,000
$ 20,000
Net purchases ................................................................
Net markups....................................................................
120,000
170,000
10,000
Totals.................................................................................
$132,000
200,000
Deduct:
Net markdowns..............................................................
7,000
Sales..................................................................................
147,000
Ending inventory at retail ...........................................
$ 46,000
Cost-to-retail ratio: $132,000 ÷ $200,000 = 66%
Ending inventory at lower-of cost-or-market (66% X $46,000) = $30,360
BRIEF EXERCISE 9-9
Inventory turnover:
$264,152
$33,685 + $31,910
= 8.05 times
2
Average days to sell inventory:
365 ÷ 8.05 = 45.3 days
9-16
Copyright © 2010 John Wiley & Sons, Inc.
Kieso, Intermediate Accounting, 13/e, Solutions Manual
(For Instructor Use Only)
To download more slides, ebook, solutions and test bank, visit
*BRIEF EXERCISE 9-10
Beginning inventory ......................................................
Net purchases..................................................................
Net markups .....................................................................
Net markdowns ...............................................................
Total (excluding beginning inventory) ....................
Total (including beginning inventory) .....................
Cost
Retail
$ 12,000
120,000
$ 20,000
170,000
10,000
(7,000)
173,000
193,000
120,000
$132,000
Deduct: Sales..................................................................
Ending inventory at retail.............................................
147,000
$ 46,000
Cost-to-retail ratio: $120,000 ÷ $173,000 = 69.4%
Ending inventory at cost
$20,000 X 60% ($12,000/$20,000) = $12,000
26,000 X 69.4%
= 18,044
$46,000
$30,044
*BRIEF EXERCISE 9-11
Cost
Beginning inventory ....................................................... $ 12,000
Net purchases................................................................... 120,000
Net markups ......................................................................
Net markdowns ................................................................
Total (excluding beginning inventory) ..................... 120,000
Total (including beginning inventory) ...................... $132,000
Deduct: Sales...................................................................
Ending inventory at retail..............................................
Copyright © 2010 John Wiley & Sons, Inc.
Kieso, Intermediate Accounting, 13/e, Solutions Manual
Retail
$ 20,000
170,000
10,000
(7,000)
173,000
193,000
147,000
$ 46,000
(For Instructor Use Only)
9-17
To download more slides, ebook, solutions and test bank, visit
*BRIEF EXERCISE 9-11 (Continued)
Cost-to-retail ratio: $120,000 ÷ $173,000 = 69.4%
Ending inventory at retail deflated to base year prices
$46,000 ÷ 1.15 = $40,000
Ending inventory at cost
$20,000 X 100% X 60% = $12,000
20,000 X 115% X 69.4% = 15,962
$27,962
9-18
Copyright © 2010 John Wiley & Sons, Inc.
Kieso, Intermediate Accounting, 13/e, Solutions Manual
(For Instructor Use Only)
To download more slides, ebook, solutions and test bank, visit
SOLUTIONS TO EXERCISES
EXERCISE 9-1 (15–20 minutes)
Per Unit
Part No.
110
111
112
113
120
121
122
Totals
Quantity
600
1,000
500
200
400
1,600
300
(a)
$334,300.
(b)
$340,500.
Cost
$ 95
60
80
170
205
16
240
Market
$100.00
52.00
76.00
180.00
208.00
0.50
235.00
Total
Cost
$ 57,000
60,000
40,000
34,000
82,000
25,600
72,000
$370,600
Total
Market
$ 60,000
52,000
38,000
36,000
83,200
800
70,500
$340,500
Lower-ofCost-orMarket
$ 57,000
52,000
38,000
34,000
82,000
800
70,500
$334,300
EXERCISE 9-2 (10–15 minutes)
Item
D
E
F
G
H
I
Net
Realizable
Value
(Ceiling)
$90*
80
60
55
80
60
Net
Realizable
Value
Less
Normal
Profit
(Floor)
$70**
60
40
35
60
40
Replacement
Cost
$120
72
70
30
70
30
Designated
Market
$90
72
60
35
70
40
Cost
$75
80
80
80
50
36
LCM
$75
72
60
35
50
36
*Estimated selling price – Estimated selling expense = $120 – $30 = $90.
**Net realizable value – Normal profit margin = $90 – $20 = $70.
Copyright © 2010 John Wiley & Sons, Inc.
Kieso, Intermediate Accounting, 13/e, Solutions Manual
(For Instructor Use Only)
9-19
To download more slides, ebook, solutions and test bank, visit
EXERCISE 9-3 (15–20 minutes)
Net Real.
Value
Net
Less
Designated
Replacement Realizable Normal
Market
Item
Cost
per
Final
Inventory
No.
Unit
Cost
Value
Profit
Value
LCM
Quantity
Value
1320
1333
1426
1437
1510
1522
1573
1626
$3.20
2.70
4.50
3.60
2.25
3.00
1.80
4.70
$3.00
2.30
3.70
3.10
2.00
2.70
1.60
5.20
$4.15*
2.90
4.60
2.75
2.45
3.50
1.75
5.50
$2.90**
2.40
3.60
1.85
1.85
3.00
1.25
4.50
$3.00
2.40
3.70
2.75
2.00
3.00
1.60
5.20
$3.00
2.40
3.70
2.75
2.00
3.00
1.60
4.70
1,200
900
800
1,000
700
500
3,000
1,000
$ 3,600
2,160
2,960
2,750
1,400
1,500
4,800
4,700***
$23,870
*$4.50 – $.35 = $4.15.
**$4.15 – $1.25 = $2.90.
***Cost is used because it is lower than designated market value.
EXERCISE 9-4 (10–15 minutes)
(a)
12/31/10
12/31/11
(b)
12/31/10
12/31/11
9-20
Cost of Goods Sold ....................................
Inventory .............................................
24,000
Cost of Goods Sold ....................................
Inventory .............................................
20,000
Loss Due to Market Decline of
Inventory.....................................................
Allowance to Reduce Inventory
to Market ..........................................
Allowance to Reduce Inventory
to Market.....................................................
Recovery of Loss Due to
Market Decline of Inventory ......
Copyright © 2010 John Wiley & Sons, Inc.
24,000
20,000
24,000
24,000
4,000*
Kieso, Intermediate Accounting, 13/e, Solutions Manual
4,000
(For Instructor Use Only)
To download more slides, ebook, solutions and test bank, visit
EXERCISE 9-4 (Continued)
*Cost of inventory at 12/31/10............................................
Lower-of-cost-or-market at 12/31/10 .............................
Allowance amount needed to reduce inventory
to market (a).......................................................................
$346,000
(322,000)
Cost of inventory at 12/31/11...........................................
Lower-of-cost-or-market at 12/31/11 .............................
Allowance amount needed to reduce inventory
to market (b) ......................................................................
$410,000
(390,000)
Recovery of previously recognized loss
(c)
$ 24,000
$ 20,000
= (a) – (b)
= $24,000 – $20,000
= $4,000.
Both methods of recording lower-of-cost-or-market adjustments have
the same effect on net income.
EXERCISE 9-5 (20–25 minutes)
(a)
Sales
Cost of goods sold
Inventory, beginning
Purchases
Cost of goods available
Inventory, ending
Cost of goods sold
Gross profit
Gain (loss) due to market
fluctuations of inventory*
Copyright © 2010 John Wiley & Sons, Inc.
February
March
April
$29,000
$35,000
$40,000
15,000
17,000
32,000
15,100
16,900
12,100
15,100
24,000
39,100
17,000
22,100
12,900
17,000
26,500
43,500
14,000
29,500
10,500
(2,000)
$10,100
1,100
$14,000
700
$11,200
Kieso, Intermediate Accounting, 13/e, Solutions Manual
(For Instructor Use Only)
9-21
To download more slides, ebook, solutions and test bank, visit
EXERCISE 9-5 (Continued)
*
Jan. 31
Feb. 28
Mar. 31
Apr. 30
Inventory at cost
Inventory at the lower-of-costor-market
Allowance amount needed to
reduce inventory to market
Gain (loss) due to market
fluctuations of inventory**
$15,000
$15,100
$17,000
$14,000
14,500
12,600
15,600
13,300
500
$ 2,500
$ 1,400
$
700
$ (2,000)
$ 1,100
$
700
$
**$500 – $2,500 = $(2,000)
$2,500 – $1,400 = $1,100
$1,400 – $700 = $700
(b)
Jan. 31
Feb. 28
Mar. 31
Apr. 30
9-22
Loss Due to Market Decline of Inventory.......
Allowance to Reduce Inventory
to Market .....................................................
500
Loss Due to Market Decline of Inventory.......
Allowance to Reduce Inventory
to Market .....................................................
2,000
Allowance to Reduce Inventory to Market........
Recovery of Loss Due to Market
Decline of Inventory................................
1,100
Allowance to Reduce Inventory to Market........
Recovery of Loss Due to Market
Decline of Inventory................................
700
Copyright © 2010 John Wiley & Sons, Inc.
Kieso, Intermediate Accounting, 13/e, Solutions Manual
500
2,000
1,100
700
(For Instructor Use Only)
To download more slides, ebook, solutions and test bank, visit
EXERCISE 9-6
Net realizable value (ceiling)
Net realizable value less normal profit (floor)
Replacement cost
Designated market
Cost
Lower-of-cost-or-market
$50 – $14 = $36
$36 – $ 9 = $27
$38
$36 Ceiling
$40
$36
$38 figure used – $36 correct value per unit = $2 per unit.
$2 X 1,000 units = $2,000.
If ending inventory is overstated, net income will be overstated.
If beginning inventory is overstated, net income will be understated.
Therefore, net income for 2010 was overstated by $2,000 and net income
for 2011 was understated by $2,000.
Copyright © 2010 John Wiley & Sons, Inc.
Kieso, Intermediate Accounting, 13/e, Solutions Manual
(For Instructor Use Only)
9-23
9-24
15
19
Group 2
Group 3
Copyright © 2010 John Wiley & Sons, Inc.
$78,000
$38,000/$125,000 X
$60,000/$125,000 X
Kieso, Intermediate Accounting, 13/e, Solutions Manual
23,120
1,360
17
29
Group 3
Total
19 – 2 = 17
15 – 7 = 8
* 9–5=4
21,760
2,720
8
Group 2
$53,040
$ 8,160
$2,040
4
Group 1
$78,000
34,000
32,000
$12,000
$ 6,760
Net income
$24,960
10,880
10,240
$ 3,840
Gross
Profit
18,200
Operating expenses
Cost of
Lots
Sold
24,960
Number Cost
of Lots
Per
Sold*
Lot
Total
Cost
85,000
85,000
$27,000/$125,000 X $85,000
Relative Sales
Price
Gross profit
Sales
$125,000
38,000
60,000
$ 27,000
Total
Sales
Price
53,040
2,000
4,000
$3,000
Sales
Price Per Lot
Cost of goods sold (see schedule)
Sales (see schedule)
9
Group 1
No. of
Lots
$85,000
25,840
40,800
$18,360
Cost
Allocated
to Lots
1,360
2,720
$2,040
Cost Per Lot
(Cost Allocated/
No. of Lots)
To download more slides, ebook, solutions and test bank, visit
EXERCISE 9-7 (15–20 minutes)
(For Instructor Use Only)
Copyright © 2010 John Wiley & Sons, Inc.
300
800
Armchairs
Straight chairs
100
120
Armchairs
Straight chairs
(800 – 120) X $30 = $20,400
Inventory of straight chairs
200
Lounge chairs
Chairs
400
Lounge chairs
Number
of Chairs
Sold
No. of
Chairs
Chairs
30
48
$54
Cost
per
Chair
50
80
$90
Sales
Price per
Chain
Total
Cost
6,000
$32,000
$19,200
8,000
$18,000
Sales
$40,000/$100,000 X
$24,000/$100,000 X
$12,800
2,400
3,200
$ 7,200
Gross
Profit
60,000
60,000
$36,000/$100,000 X $60,000
Relative Sales
Price
3,600
4,800
$10,800
Cost of
Chairs
Sold
$100,000
40,000
24,000
$36,000
Total
Sales
Price
$60,000
24,000
14,400
$21,600
Cost
Allocated
to Chairs
30
48
$54
Cost per
Chair
To download more slides, ebook, solutions and test bank, visit
EXERCISE 9-8 (12–17 minutes)
Kieso, Intermediate Accounting, 13/e, Solutions Manual
(For Instructor Use Only)
9-25