Solution manual introduction to management accounting 14e by horngren ch03
Bạn đang xem bản rút gọn của tài liệu. Xem và tải ngay bản đầy đủ của tài liệu tại đây (582.45 KB, 70 trang )
To download more slides, ebook, solutions and test bank, visit
CHAPTER 3
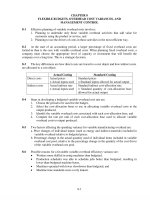
COVERAGE OF LEARNING OBJECTIVES
LEARNING
OBJECTIVE
FUNDAMENTAL
ASSIGNMENT
MATERIAL
LO1: Explain step- A1,B1
and mixed-cost
behavior.
LO2: Explain
management
influences on cost
behavior.
LO3: Measure and
mathematically
express cost
functions and use
them to predict
costs.
LO4: Describe the A2,B2
importance of
activity analysis
for measuring cost
functions.
LO5: Measure cost A3,B3
behavior using the
engineering
analysis, account
analysis, high-low,
visual-fit, and
least-squares
regression
methods.
CRITICAL
THINKING
EXERCISE
S AND
EXERCISE
S
26, 30, 31,
32
CASES,
NIKE 10K,
EXCEL,
COLLAB.,
PROBLEM
&
S
INTERNET
EXERCISES
43,44,48,55 59, 61, 62
27, 37
43
56, 60
28, 33, 34,
35, 38
39, 40, 41
42
43, 45, 50
52, 54, 55
60, 62
46,49
57, 59
47, 50, 51
52, 53, 55
58, 62
29, 33, 34,
38, 39
40, 41, 42
105
To download more slides, ebook, solutions and test bank, visit
CHAPTER 3
Measurement of Cost Behavior
3-A1 (20-25 min.)
Some of these answers are controversial, and reasonable cases
can be built for alternative classifications. Class discussion of these
answers should lead to worthwhile disagreements about anticipated
cost behavior with regard to alternative cost drivers.
1.
2.
3.
4.
5.
6.
7.
8.
9.
10.
11.
(b) Discretionary fixed cost.
(e) Step cost.
(a) Purely variable cost with respect to revenue.
(a) Purely variable cost with respect to miles flown.
(d) Mixed cost with respect to miles driven.
(c) Committed fixed cost.
(b) Discretionary fixed cost.
(c) Committed fixed cost.
(a) Purely variable cost with respect to cases of CocaCola.
(b) Discretionary fixed cost.
(b) Discretionary fixed cost.
106
To download more slides, ebook, solutions and test bank, visit
3-A2 (25-30 min.)
1.
Support costs based on 60% of the cost of materials:
Sign A
Sign B
Direct materials cost
$300
$150
Support cost (60% of materials cost) $180
$ 90
Support costs based on $40 per power tool operation:
Sign A
Sign B
Power tool operations
2
6
Support cost
$80
$240
2.
If the activity analysis is reliable, by using the current method,
Evergreen Signs is predicting too much cost for signs that use
few power tool operations and is predicting too little cost for
signs that use many power tool operations. As a result she
could be losing jobs that require few power tool operations
because her bids are too high -- she could afford to bid less on
these jobs. Conversely, she could be getting too many jobs
that require many power tool operations, because her bids are
too low -- given what her "true" costs will be, she cannot
afford these jobs at those prices. Either way, her sign business
could be more profitable if she better understood and used
activity analysis. Evergreen Signs would be advised to adopt
the activity analysis recommendation, but also to closely
monitor costs to see if the activity analysis predictions of
support costs are accurate.
107
To download more slides, ebook, solutions and test bank, visit
3-A3 (25-30 min.)
1.
High-Low Method:
Support Cost Machine Hours
$13,500
1,750
9,000
850
$ 4,500
900
High month = September
Low month = May
Difference
Variable cost per machine hour =
=
Change in cost
Change in cost driver
$4,500
= $5.00
900
Fixed support cost per month = Total support cost - Variable
support cost
At the high point:
= $13,500 - $5.00 x 1,750
= $13,500 - $8,750
= $ 4,750
or at the low point:
2.
= $ 9,000 - $5.00 x 850
= $ 9,000 - $4,250
= $ 4,750
The high-low method uses the high and low activity levels to
determine the cost function. Since the new October data for
machine hours does not change either the high or low level
there would be no change in the analysis.
108
To download more slides, ebook, solutions and test bank, visit
3.
The regression analysis results are somewhat different from
the results of the high-low method. As a result, estimates of
total support cost may differ considerably depending on the
expected machine hour usage. For example, consider the
following support cost estimates at three levels of machine
hour usage (all within the relevant range):
Machine Hour Usage
950 Hours 1,200 Hours 1,450 Hours
High-Low:
Fixed
Variable: $5.00 x 950
$5.00 x 1,200
$5.00 x 1,450
Total
$4,750
4,750
$ 4,750
$ 4,750
6,000
Regression:
Fixed
Variable: $6.10 x 950
$6.10 x 1,200
$6.10 x 1,450
Total
$9,500
$10,750
7,250
$12,000
$3,355
5,795
$ 3,355
$ 3,355
7,320
$9,150
$ 10,675
8,845
$12,200
Because the high-low approach has a lower variable cost
estimate, the regression-based predictions exceed the highlow-based predictions at higher levels of machine usage, while
the high-low estimates are greater at lower levels of usage.
The high-low method used only two data points, so the results
may not be reliable. Evert would be advised to use the
regression results, which are based on all relevant data.
109
To download more slides, ebook, solutions and test bank, visit
3-B1 (20-25 min.) The following classifications are open to debate.
With appropriate assumptions, other answers could be equally
supportable. For example, in #2, the health insurance would be a
committed fixed cost if the number of employees will not change.
This problem provides an opportunity to discuss various aspects of
cost behavior. Students should make an assumption regarding the
time period involved. For example, if the time period is short, say
one month, more costs tend to be fixed. Over longer periods, more
costs are variable. They also must assume something about the
nature of the cost. For example, consider #4. Repairs and
maintenance are often thought of as a single cost. However, repairs
are more likely to vary with the amount of usage, making them
variable, while maintenance is often on a fixed schedule regardless
of activity, making them fixed.
Another important point to make is the cost/benefit criterion
applied to determining “true” cost behavior. A manager may accept
a cost driver that is plausible but may have less reliability than an
alternative due to the cost associated with maintaining data for the
more reliable cost driver.
Cost
Cost Behavior
Likely Cost Driver(s)
1. X-ray operating cost Mixed
Number of x-rays
2. Insurance
Step (or variable)
Number of employees
3. Cancer research
Discretionary fixed
4. Repairs
Variable
5. Training cost
Discretionary fixed
6. Depreciation
Committed fixed
7. Consulting
Discretionary fixed
Number of patients
8. Nursing supervisors Step
Number of nurses,
patient-days
110
To download more slides, ebook, solutions and test bank, visit
3-B2 (25-30 min.)
Board Z15 Board Q52
Mark-up method:
Material cost
Support costs (100%)
$30
$30
$55
$55
Activity analysis method:
Manual operations
Support costs (@$4)
16
$64
6
$24
The support costs are different because different cost behavior is
assumed by the two methods. If the activity analyses are reliable,
then boards with few manual operations are overcosted with the
markup method, and boards with many manual operations are
undercosted with the markup method.
111
To download more slides, ebook, solutions and test bank, visit
3-B3 (25-30 min.)
Variable cost per machine hour =
=
Change in Repair Cost
Change in Machine Hours
(P260,000,000 - P200,000,000)
(12,000 - 8,000)
= $15,000 per machine hour
Fixed cost per month
= total cost - variable cost
= P260,000,000 - P15,000 x 12,000
= P260,000,000 - P180,000,000
= P 80,000,000 per month
or
= P200,000,000 - P15,000 x 8,000
= P200,000,000 - P120,000,000
= P 80,000,000 per month
3-1
A cost driver is any output measure that is believed to cause
costs to fluctuate in a predictable manner. For example,
direct labor costs are probably driven by direct labor hours;
materials costs are probably driven by levels of product
output; and support costs may be driven by a variety of
drivers, such as output levels, product complexity, number of
different products and/or parts, and so on.
3-2
Linear cost behavior assumes that costs behave as a straight
line. This line is anchored by an intercept, or fixed cost
estimate, and total costs increase proportionately as cost
driver activity increases. The slope of the line is the estimate
of variable cost per unit of cost driver activity.
112
To download more slides, ebook, solutions and test bank, visit
3-3
Whether to categorize a step cost either as a fixed cost or as a
variable cost depends on the "size" of the steps (height and
width) and on the desired accuracy of the description of step
cost behavior. If the steps are wide, covering a wide range of
cost driver activity, then within each range the cost may be
regarded as fixed. If the steps are narrow and not too high,
with small changes in cost, then the cost may be regarded as
variable over a wide range of activity level, with little error. If
the steps are narrow and high, covering big changes in cost,
then the cost probably should not be regarded as variable,
since small changes in activity level can result in large changes
in cost.
3-4
Mixed costs are costs that contain both fixed and variable
elements. A mixed cost has a fixed portion that is usually a
cost per time period. This is the minimum mixed cost per
period. A mixed cost also has a variable portion that is a cost
per unit of cost driver activity. The variable portion of a
mixed cost increases proportionately with increases in the cost
driver.
3-5
In order to achieve the goals set for the organization,
management makes critical choices -- choices that guide the
future activities of the organization. These choices include
decisions about locations, products, services, organization
structure, and so on. Choices about product or service
attributes (mix, quality, features, performance, etc.), capacity
(committed and discretionary fixed costs), technology
(capital/labor considerations, alternative technologies), and
incentives (standard-based performance evaluation) can
greatly affect cost behavior.
113
To download more slides, ebook, solutions and test bank, visit
3-6
Some fixed costs are called capacity costs because the levels of
these fixed costs are determined by management's strategic
decisions about the organization's expected levels of activities,
or capacity.
3-7
Committed fixed costs are costs that are often driven by the
planned scale of operations. These costs typically cannot be
changed easily or quickly without drastically changing the
operations of the organization. Typical committed fixed costs
include lease or mortgage payments, property taxes, and longterm management compensation. Discretionary fixed costs
are costs that may be necessary to achieve certain operational
goals, but there are no contractual obligations to continue
these payments. Typical discretionary fixed costs include
advertising, research and development, and employee training
programs. The distinction between committed and
discretionary fixed costs is that discretionary fixed costs are
flexible and could be increased or eliminated entirely on short
notice if necessary, but committed fixed costs usually must be
incurred for some time -- greater effort is needed to change or
eliminate them.
3-8
Committed fixed costs are the most difficult to change because
long-term commitments generally have been made. These
long-term commitments may involve legal contracts that
would be costly to renegotiate or dissolve. Committed fixed
costs also are difficult to change, because doing so may mean
greatly changing the way the organization conducts its
activities. Changing these committed fixed costs may also
mean changing organization structure, location, employment
levels, and products or services.
114
To download more slides, ebook, solutions and test bank, visit
3-9
An organization’s capacity is the primary determinant of
committed fixed costs. Management’s choice is the main
influence on discretionary fixed costs. The determinants of
both committed and discretionary fixed costs are elements of
the organization's strategy relating to capacity, product
attributes, and technology. These elements will determine
long-term cost commitments (committed costs) and flexible
spending responses to changes in the environment
(discretionary costs).
3-10 Both planning for and controlling discretionary costs are
important. It is hard to say that one is more important than
the other, but certainly effective use of discretionary costs
requires prior planning. One would not know, however, if
these costs had been effective in meeting goals unless the
organization has a reliable and timely control system -- a
means of checking accomplishments against goals.
3-11 High technology production systems often mean higher fixed
costs and lower variable costs.
3-12 Incentives to control costs are means of making cost control in
the best interests of the people responsible for making cost
expenditures. A simple example will illustrate the use of
incentives to control costs. Assume that you are an executive
who travels for business, purchases professional literature,
and keeps current with personal computer technology. Under
one incentive system, you simply bill the organization for all
your travel and professional expenses. Under another system,
you are given an annual budget for travel and professional
needs. Which system do you think would cause you to be
more careful how you spend money for travel and professional
needs? Most likely, the latter system would be more effective
in controlling costs. Usually these incentives are economic, but
other non-financial incentives may also be effective.
115
To download more slides, ebook, solutions and test bank, visit
3-13 Use of cost functions, or algebraic representations of cost
behavior, allows cost analysts or management to build models
of the organization's cost behavior. These models can be used
to aid planning and control activities. One common use of
cost functions is in financial planning models, which are
algebraic models of the cost and revenue behavior of the firm,
essentially extended C-V-P models similar to those discussed
in Chapter 2. Understanding relationships between costs and
cost drivers allows managers to make better decisions.
3-14 A "plausible" cost function is one that is intuitively sound. A
cost function is plausible if a knowledgeable analyst can make
sound economic justifications why a particular cost driver
could cause the cost in question. A "reliable" cost function is
one that accurately and consistently describes actual cost
behavior, past and future. Both plausibility and reliability are
essential to useful cost functions. It is difficult to say that one
is more important than the other, but one would not have
much confidence in the future use of a cost function that is not
plausible, even if past reliability (e.g., based on statistical
measures) has been high. Likewise, one would not be
confident using a cost function that is highly plausible, but
that has not been shown to be reliable. The cost analyst
should strive for plausible and reliable cost functions.
3-15 Activity analysis identifies underlying causes of cost behavior
(appropriate cost drivers) and measures the relationships of
costs to their cost drivers. A variety of methods may be used
to measure cost functions, including engineering analysis and
account analysis.
116
To download more slides, ebook, solutions and test bank, visit
3-16 Engineering analysis is a method of identifying and measuring
cost and cost driver relationships that does not require the use
of historical data. Engineering analysis proceeds by the use of
interviews, experimentation, and observation of current cost
generating activities. Engineering analysis will be more
reliable if the organization has had past experience with the
activities.
Account analysis is a method of identifying and measuring
costs and cost driver relationships that depend explicitly on
historical cost data. An analyst selects a single cost driver and
classifies each cost account as fixed or variable with respect to
that cost driver. Account analysis will be reliable if the
analyst is skilled and if the data are relevant to future uses of
the derived cost function.
3-17 There are four general methods covered in this text to
measure mixed costs using historical data: (1) account
analysis, (2) high-low, (3) visual fit, and (4) regression.
• Account analysis looks to the organization's cost accounts
and classifies each cost as either fixed, variable, or mixed with
regard to an appropriate cost driver.
• High-low analysis algebraically measures mixed cost
behavior by constructing a straight line between the cost at
the highest activity level and that at the lowest activity level.
• Visual-fit analysis seeks to place a straight line among data
points on a plot of each cost and its appropriate cost driver.
• Regression analysis fits a straight line to cost and activity
data according to statistical criteria.
117
To download more slides, ebook, solutions and test bank, visit
3-18 Engineering analysis and account analysis often are combined.
One of the problems of account analysis is that historical data
may contain past inefficiencies. Therefore, account analysis
measures what costs were, not necessarily what they should
be. Differences in future costs may be desired and/or
anticipated, and account analysis alone usually will not
account for these differences. Engineering analysis may be
combined with account analysis to revise account-based
measures for desired improvements in efficiency and/or
planned changes in inputs or processes.
3-19 The strengths of the high-low method are also its weaknesses - the method is simple to apply since it does not require
extensive data or statistical sophistication. This simplicity also
means that the method may not be reliable because it may not
use all the relevant data that are available, and choice of the
two points to measure the linear cost relationship is subjective.
The method itself also does not give any measures of
reliability.
The visual-fit method is an improvement over the high-low
method because it uses all the available (relevant) data.
However, this method, too, may not be reliable since it relies
on the analyst's judgment on where to place the line.
3-20 The cost-driver level should be used to determine the two data
points to be used to determine the cost function. Why?
Because the high- and low-cost points are more likely to have
measurement errors, an unusually high cost at the high-cost
point and an unusually low cost at the low-cost point.
118
To download more slides, ebook, solutions and test bank, visit
3-21 Regression analysis is usually preferred to the high-low
method (and the visual-fit method) because regression analysis
uses all the relevant data and because easy-to-use computer
software does the analysis and provides useful measures of
cost function reliability. The major disadvantage of
regression analysis is that it requires statistical sophistication
to use properly. Because the software is easy to use, many
users of regression analysis may not be able to critically
evaluate the output and may be misled to believe that they
have developed a reliable cost function when they have not.
3-22 This is a deceptive statement, because it is true on the face of
it, but regression also has many pitfalls for the unwary. Yes,
regression software provides useful output that can be used to
evaluate the reliability of the measured cost function. If one
understands the assumptions of least-squares regression, this
output can be used to critically evaluate the measured
function. However, the regression software cannot evaluate
the relevance or accuracy of the data that are used. Even
though regression analysis is statistically objective, irrelevant
or inaccurate data used as input will lead to unreliable cost
functions, regardless of the strength of the statistical
indicators of reliability.
3-23 Plotting data helps to identify outliers, that is, observations
that are unusual and may indicate a situation that is not
representative of the environment for which cost predictions
are being made. It can also show nonlinear cost behavior that
can lead to transformations of the data before applying linear
regression methods.
3-24 R2 is a goodness-of-fit test. It tells us the percentage of
variation in cost that is associated with changes in the cost
driver.
119
To download more slides, ebook, solutions and test bank, visit
3-25 Control of costs does require measurement of cost behavior,
either what costs have been or what costs should be. Problems
of work rules and the like may make changing cost behavior
difficult. There are tradeoffs, of course, and the instructor
should expect that students could get into an impassioned
debate over where the balance lies -- union job protection
versus improved efficiency. This debate gets to one of the
major roles of accounting in organizations, and it is important
that students realize that accounting does matter greatly to
individuals, and, ultimately, to society.
3-26 The fixed salary portion of the compensation is a fixed cost. It
is independent of how much is sold. In contrast, the 5%
commission is a variable cost. It varies directly with the
amount of sales. Because the compensation is part fixed cost
and part variable cost, it is considered a mixed cost.
3-27 Both depreciation and research and development costs are
fixed costs because they are independent of the volume of
operations. Depreciation is generally a committed fixed cost.
Managers have little discretion over the amount of the cost. In
contrast, research and development costs are discretionary
fixed costs because their size is often the result of
management’s judgment.
3-28 Decision makers should know a product’s cost function if their
decisions affect the amount of product produced. To know the
cost impact of their decisions, decision makers apply the cost
function to each possible volume of production. This is
important in many decisions, such as pricing decisions,
promotion and advertising decisions, sales staff deployment
decisions, and many more decisions that affect the volume of
product that the company produces.
120
To download more slides, ebook, solutions and test bank, visit
3-29 Regression analysis is a statistical method of fitting a costfunction line to observed costs. It is not subjective; that is,
each cost analyst would come up with the same regression line,
but different analysts might have different cost functions
when using a visual fit method. In addition, regression
analysis provides measures of how well the cost-function line
fits the data, so that managers know how much reliance they
can put on cost predictions that use the cost function.
3-30 (5 min.) Only (b) is a step cost.
(a) This is a fixed cost. The same cost applies to all volumes in the
relevant range.
(b) This is a true step cost. Each time 15 students are added, the
cost increases by the amount of one teacher’s salary.
(c) This is a variable cost that may be different per unit at different
levels of volume. It is not a step cost. Why? Because each
unit of product requires a particular amount of steel,
regardless of the form in which the steel is purchased.
3-31 (5 min.) The $5,000 is a fixed cost and the $45 per unit is a
variable cost. By definition, adding a fixed cost and a variable cost
together produces a mixed cost.
121
To download more slides, ebook, solutions and test bank, visit
3-32 (10-15 min.)
1.
Machining labor: G, number of units completed or labor hours
2.
Raw material: B, units produced
3.
Annual wage: C or E (depending on work levels), labor hours
4.
Water bill: H, gallons used
5.
Quantity discounts: A, amount purchased
6.
Depreciation: E, capacity
7.
Sheet steel: D, number of implements
8.
Salaries: F, number of solicitors
9.
Natural gas bill: C, energy usage
3-33 (15 min.)
The analysis is faulty because of the following errors.
1. The scales used for both axes are incorrect. The space between
equal intervals in number of orders and order-department costs
should be the same.
2. The visual-fit line is too high, and the slope is too steep. It appears
that the line has been purposely drawn to pass through the (100,450)
data point and the $200 point on the y-axis to simplify the analysis.
A visual-fit line most often will not pass through any one data point.
Choosing one point (any point) or a data point and the Y-intercept
makes this similar to the high-low method, ignoring much of the
information contained in the rest of the data.
3. The total cost for 90 orders is wrong. Either the fixed costs
should be expressed in thousands of dollars or the unit variable
costs should be $2,000 per order. Even if the derived total cost
function was accurate, the resulting cost prediction is incorrect. The
formula should be expressed as
122
To download more slides, ebook, solutions and test bank, visit
Total cost (thousands of dollars) = $200 + $2.50 x Number of orders
processed, or
Total cost = $200,000 + $2,500 x Number of orders processed
This would result in a predicted total cost for 90 orders of
Total cost (thousands of dollars) = $200 + $2.50 x 90 = $425, or
Total cost = $200,000 + $2,500 x 90 = $425,000.
Correct Analysis
The following graph has correctly constructed scales. The visual fit
line shown indicates that fixed costs are $200,000 and variable cost
is $2,250 – a lower slope than that shown in the text.
Order Department Costs
$500
80, 420
Order Department Costs
(Thousands)
$450
100, 450
$400
$350
20, 280
10, 240
$300
$250
70, 320
$180
40, 240
$200
$150
$100
$50
$0
20
40
60
80
Orders Processed
123
100
120
To download more slides, ebook, solutions and test bank, visit
The total cost function is
Total cost (thousands of dollars) = $200 + $2.25 x Number of orders,
or
Total cost = $200,000 + $2,250 x Number of orders
Variable cost (thousands of dollars) $180 ÷ 80 orders = $2.25
The predicted total cost for 90 orders is
Total cost = $200,000 + $2,250 x 90 = $200,000 + $202,500 =
$402,500.
124
To download more slides, ebook, solutions and test bank, visit
3-34 (15-20 min.)
Amounts are in millions.
1.
Sales revenues
Less: Operating income (loss)
Operating expenses
2001 2002
$57 $116
(19)
18
$76 $ 98
2.
Change in operating expenses ÷ Change in revenues = Variable
cost percentage
($98 - $76) ÷ ($116 - $57) = $22 ÷ $59 = .37 or 37%
Fixed cost = Total cost – Variable cost
= $76 - .37 x $57
= $55
or
= $98 - .37 x $116
= $55
Cost function = $55 + .37 x Sales revenue
3. Because fixed costs to not change, the entire additional total
contribution margin is added to operating income. The $57 sales
revenue in 2001 generated a total contribution margin of $57 x (1 .37) = $36, which was $19 short of covering the $55 of fixed cost.
But the additional $59 of sales revenue in 2002 generated a total
contribution margin of $59 x (1 - .37) = $37 that could go directly to
operating income because there was no increase in fixed costs. It
wiped out the $19 operating loss and left $18 of operating income.
125
To download more slides, ebook, solutions and test bank, visit
3-35 (10-15 min.)
1.
Fuel costs: $.20 x 17,000 miles per month = $3,400 per month.
2.
Equipment rental: $6,000 x 7 x 3 = $126,000 for seven pieces
of equipment for three months
3.
Ambulance and EMT cost: $1,200 x (2,400/250) = $1,200 x 10
= $12,000 (must round up from 9.6 to 10)
4.
Purchasing: $7,500 + $4 x 4,000 = $23,500 for the month.
3-36 (10-15 min.) There may be some disagreement about these
classifications, but reasons for alternative classifications should be
explored.
Cost
Discretionary
Advertising
$19,000
Depreciation
Company health insurance
Management salaries
Payment of long-term debt
Property tax
Grounds maintenance
9,000
Office remodeling
21,000
Research and development
36,000
Totals
$85,000
126
Committed
$ 47,000
15,000
85,000
50,000
32,000
$229,000
To download more slides, ebook, solutions and test bank, visit
3-37 (15-20 min.)
This problem extends the chapter analysis to preview shortrun decision making and capital budgeting. This problem ignores
taxes, investment cost, and the time value of money, which are
covered in Chapter 11.
Alternative 1 Alternative 2
Variable cost per order
$8.00
$4.00
Expected number of orders
70,000
70,000
Annual variable costs
$560,000
$280,000
Annual fixed cost
200,000
400,000
Annual total costs
$760,000
$680,000
Therefore, Alternative 2 is less costly than Alternative 1 by $80,000.
Let X = the break-even number of orders, the level at which
expected costs are equal.
Costs for Alternative 1 = Costs for Alternative 2
$200,000 + $8X = $400,000 + $4X
$4X = $200,000
X = 50,000 orders
At 50,000 orders, the alternatives are equivalent. If order
levels are expected to be below 50,000 orders, then Alternative 1
would have lower costs because fixed costs are lower. If orders are
expected to be greater than 50,000, then Alternative 2 would have
lower costs because variable costs are lower.
127
To download more slides, ebook, solutions and test bank, visit
3-38 (20-25 min.) A master of the scatter-diagrams with leastsquare regression lines and high-low lines appears in Exhibit 3-38
on the following page.
This exercise enables a comparison of the high-low and visualfit methods of decomposing mixed-costs into fixed and variable
parts. Students find it interesting to compare their best guesses to
the least-squares regression results. They find it interesting that a
fairly complete and accurate analysis is possible based on a scatterdiagram and a little common sense. We normally have the class
determine a “class best guess” before showing the transparency of
the regression results.
The exercise also introduces students to the concept of a
hierarchy of activity levels, although this topic is not covered in the
text. The literature contains discussions of four general levels of
activities. Recognizing each of these levels can be an aid in choosing
appropriate cost drivers. These levels and example cost drivers are:
a.
Unit-level activities -- performed each time a unit is produced
(units of product, machine hours, labor hours).
b.
Batch-level activities -- performed each time a batch of goods
is processed or handled (number of orders processed, number
of setups, number of material moves).
c.
Product-level activities -- performed as needed to support the
production of each different type of product (number of tests,
number of parts, number of engineering change notices, hours
of design time, number of inspections).
d.
Facility-level activities -- sustain a facility’s general
manufacturing process (square footage, number of employees,
hours of training).
In this exercise, a batch-level activity is involved -- setups.
128
To download more slides, ebook, solutions and test bank, visit
Exhibit 3-38 – Maintenance Costs (Thousands)
$30
$25
$20
$15
$10
$5
$0
1
2
3
4
5
Units Produced (Thousands)
$30
$25
High-Low
$20
$15
Regression
Line
$10
Outlier
$5
$0
5
10
15
20
Number of Setups
129
25
30