Solution manual introduction to management accounting 14e by horngren ch12
Bạn đang xem bản rút gọn của tài liệu. Xem và tải ngay bản đầy đủ của tài liệu tại đây (671 KB, 72 trang )
To download more slides, ebook, solutions and test bank, visit
CHAPTER 13
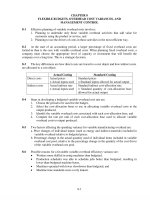
COVERAGE OF LEARNING OBJECTIVES
LEARNING OBJECTIVE
LO1: Compute budgeted
factory-overhead rates
and apply factory
overhead to production.
LO2: Determine and use
appropriate costallocation bases for
overhead application to
products and services.
LO3: Identify the meaning
and purpose of
normalized overhead
rates.
LO4: Construct an income
statement using the
variable-costing
approach.
LO5: Construct an income
statement using the
absorption-costing
approach.
LO6: Compute the
production-volume
variance and show how it
should appear in the
income statement.
LO7: Explain why a
company might prefer to
use a variable-costing
approach.
FUNDAMENTAL
ASSIGNMENT
MATERIAL
A1,B2
CRITICAL
THINKING
EXERCISES
AND
EXERCISES
33,34,38,39,
40
PROBLEMS
50,51,52,53,
60,63
CASES,
NIKE 10K,
EXCEL,
COLLAB. &
INTERNET
EXERCISES
69,73,74
32,40,41
50,51,52,53,
60
42
63
B4
43
55,56,57,58,
59,64,65
70
A4,B4
43
55,56,57,58,
59,64,65
70
37,46,47,48,
49
60,61,62,67,
68
71
55,56,61,64
70
770
69,74
To download more slides, ebook, solutions and test bank, visit
CHAPTER 13
ACCOUNTING FOR OVERHEAD COSTS
13-A1 (15-20 min.)
This is a solid basic problem concerning overhead application.
1.
2.
Overhead rate = Error!
Department A =
$1,820,000
= $5.20 per machine hour
350,000
Department B =
$1,000,000
= $8.00 per direct-labor hour
125,000
Department A = $5.20 x 3,500
Department B = $8.00 x 1,250
Total applied overhead
3.
$18,200
10,000
$28,200
Dept. A
Direct material
Direct labor
Applied factory overhead
Totals
Dept. B
$12,000
10,800
18,200
$41,000
Unit cost, $93,000 ÷ 120
Total
$32,000
10,000
10,000
$52,000
$
771
$44,000
20,800
28,200
$93,000
775
To download more slides, ebook, solutions and test bank, visit
4.
Students must be on guard to get their definitions clear.
"Overapplied" essentially means that "actual" overhead is
less than that absorbed by (applied to) the products worked
on during the period.
Computations follow:
Dept. A
Actual
Dept. B
Factory as
a Whole
$1,300,000 $1,200,000
$2,500,000
Applied, 300,000 x $5.20
and 120,000 x $8.00
2,520,000
Underapplied (overapplied)
20,000)
1,560,000
960,000
$ (260,000) $ 240,000
($
13-A2 (15 min.) Note that the direct materials inventory is
irrelevant.
1.
Underapplied overhead = $134,000 - $126,000 = $8,000
2.
Adjusted gross profit = $60,000 - $8,000 = $52,000
3.
Proration schedule:
(in thousands)
Unadjusted
Proration of
Balances Underapplied Overhead
Work in process $ 75,000
Finished goods
150,000
Cost of goods sold 525,000
Totals
$750,000
Adjusted
Balances
75/750 x $8,000 = $ 800 $ 75,800
150/750 x $8,000 = 1,600 151,600
525/750 x $8,000 = 5,600 530,600
$8,000 $758,000
Adjusted gross profit = $60,000 - 5,600 = $54,400
4.
Overapplied overhead = $124,000 - $126,000 = $2,000
772
To download more slides, ebook, solutions and test bank, visit
Adjusted gross profit = $60,000 + $2,000 = $62,000
773
To download more slides, ebook, solutions and test bank, visit
13-A3
(15-20 min.) Gross margin and ending direct-materials
inventories are irrelevant.
1,2.
Direct materials used
Direct labor
Variable manufacturing overhead
Fixed manufacturing overhead
Total production costs
Ending inventories are ¼ * of total
production costs
(1)
(2)
Variable Absorption
Costing
Costing
$ 3,000
$ 3,000
4,500
4,500
2,500
2,500
-4,000
$10,000
$14,000
$ 2,500
$ 3,500
* (3,000 – 2,250) ÷ 3,000 = ¼
3.
The $1,000 difference in ending inventories is accounted for
by 1/4 of the $4,000 fixed manufacturing overhead that is
lodged in ending inventory under absorption costing.
Operating income would be $1,000 lower under variable
costing because all of the fixed manufacturing overhead is
released to expense in the current period. (That is why the
fixed cost is sometimes called a "period cost" by variable
costers; period costs are those that are totally released to
expense in the current period rather than being inventoried.)
Note also that the difference in operating income is a function
of the change in inventory levels, which happened to be zero at
the beginning of the year. It is not a function of the ending
inventories alone. See the next problem.
774
To download more slides, ebook, solutions and test bank, visit
13-A4 (20-30 min.)
1.
TRAHN COMPANY
Absorption Costing Income Statement
For the Year Ended December 31, 20X8
Sales
Deduct cost of goods sold:
Beginning inventory, 110 @ $10*
$ 1,100
Add: Absorption cost of goods
manufactured, 1,200 units @ $10
12,000
Cost of goods available for sale
$13,100
Ending inventory, 30 @ $10
(300)
Cost of goods sold -- at standard
$12,800
Production volume variance (unfavorable)
600**
Adjusted cost of goods sold
Gross margin
Selling and administrative expenses ($600 + $350)
Operating income
*Fixed overhead rate: $4,200 ÷ 1,400 units = $3 per unit.
Unit production cost: $7 + $3 = $10
**(1,400 - 1,200) x $3 = $600 underapplied
2. Change in inventory units 110 - 30 = 80 decrease
Fixed factory overhead rate is $3
Difference in operating income: 80 x $3 = $240 less under
absorption costing
775
$15,360
(13,400)
1,960
(950)
$ 1,010
To download more slides, ebook, solutions and test bank, visit
13-B1 (10-15 min.) Note that the direct materials inventory is
irrelevant.
1.
Adjusted cost of goods sold is $250,000 less $20,000 or
$230,000.
2.
Unadjusted
(in thousands)
Balances
Work in process
$100
Finished goods
150
Cost of goods sold
250
Totals
$500
Proration of Adjusted
Overapplied OverheadBalances
100/500 x $20 = 4
$ 96
150/500 x $20 = 6
144
250/500 x $20 = 10
240
$20
$480
Gross profit would be lower in requirement 2 by $20,000 $10,000, or $10,000. Adjusted cost of goods sold would be
$250,000 - $10,000 = $240,000 in requirement 2 but $250,000 $20,000 = $230,000 in requirement 1. The higher cost of goods
sold in requirement 2 would make gross profit lower.
776
To download more slides, ebook, solutions and test bank, visit
13-B2
1.
(15-20 min.)
Overhead rate =
Pharmacy =
Budgeted overhead
Budgeted cost driver level
$225,000
= $2.50 per prescription
90,000
Medical Records =
$300,000
= $5.00 per patient visit
60,000
2.
Pharmacy = $2.50 x 4
Medical records = $5.00 x 2
Total applied overhead
$ 10.00
10.00
$20.00
3.
Students must be on guard to get their definitions clear.
"Overapplied" essentially means that "actual" overhead is
less than that absorbed by (applied to) the products worked
on during the period.
Computations follow:
Medical
Pharmacy Records
Actual
Applied, 85,000 x $2.50
and 63,000 x $5.00
Underapplied
Total
$217,000 $325,000
$542,000
212,500 315,000
$ 4,500 $ 10,000
527,500
$ 14,500
777
To download more slides, ebook, solutions and test bank, visit
13-B3(10 min.)
(1)
(2)
Absorption Variable
Costing Costing
Production costs:
Direct materials used
Direct labor
Variable manufacturing overhead
Fixed manufacturing overhead
Total
Ending inventories, 1/8 of total production costs
$3,500 $3,500
4,200
4,200
300
300
2,200
$10,200 $8,000
$1,275 $1,000
13-B4(30-40 min.)
1.
DESK PC DIVISION
Income Statement (Variable Costing)
For the Year 20X8
(in thousands of dollars)
Sales (15,000 x $500)
$7,500
Opening inventory, at variable
standard cost of $300
$ 900
Add: Variable cost of goods manufactured
4,650
Available for sale
5,550
Deduct: Ending inventory, at variable
standard cost of $300
1,050
Variable cost of goods sold, at standard
$4,500
Net variances for all variable costs, unfavorable
18
Variable cost of goods sold, at actual
4,518
Variable selling expenses, at 5% of dollar sales
375
Total variable costs charged against sales
4,893
Contribution margin
2,607
Fixed factory overhead
1,560*
Fixed selling and administrative expenses
650
Total fixed expenses
2,210
Operating income
$ 397
*This can be shown in two lines, $1,500 budget plus $600 variance.
778
To download more slides, ebook, solutions and test bank, visit
DESK PC DIVISION
Income Statement (Absorption Costing)
For the Year 20X8
(in thousands of dollars)
Sales
Opening inventory, at standard cost of $400
Add: Cost of goods manufactured, at standard
Available for sale
Deduct: Ending inventory, at standard
Cost of goods sold, at standard
Net variances for variable manufacturing
costs, unfavorable
$18
Fixed factory overhead budget variance,
unfavorable
60
Production-volume variance, favorable
(50)*
Total variances
Cost of goods sold, at actual
Gross profit, at "actual"
Selling and administrative expenses:
Variable
Fixed
Operating income
$7,500
$1,200
6,200
7,400
1,400
6,000
28
6,028
1,472
375
650
1,025
$ 447
* Production-volume variance is $100 x (15,000 expected production volume
– 15,500 actual production).
2.
The $50,000 difference in operating income is attributable to
the 500-unit increase in inventory levels. This means that
$50,000 of fixed factory overhead (500 units x fixed rate of
$100) was held back in inventory under absorption costing,
whereas all fixed overhead was released as expense under
variable costing.
779
To download more slides, ebook, solutions and test bank, visit
13-1 The budgeted overhead application rate is the predicted
factory overhead for the budget period divided by the predicted
machine hours for that period. The amount of factory overhead
applied to a job is the budgeted overhead application rate times the
actual machine hours used on that job.
13-2 No. In the past, most organizations have used only one costallocation base per department. However, the trend is toward using
multiple cost-allocation bases. Whether more than one costallocation base is used is a cost/benefit issue. If most overhead costs
are caused by a single cost driver, using that one cost driver for cost
application is logical. If overhead costs are caused by multiple cost
drivers, managers must compare the value of more accurate
product costs versus the cost of a complex accounting system that
uses multiple cost-allocation bases for overhead application.
13-3 Yes. Direct-labor cost may be the best cost-allocation base for
overhead allocation even if wage rages vary within a department.
For example, higher skilled labor (with higher wage rates) may
require more overhead because it may use more costly equipment
and have more indirect labor support. Moreover, many factory
overhead costs include costly labor fringe benefits such as pensions
and payroll taxes, which are higher for more highly paid employees.
13-4 Cost-allocation bases might include direct labor cost, direct
labor hours, direct material cost, total direct cost, machine hours,
number of batches, number of engineering hours used, number of
change orders, etc.
13-5 The comparison of actual overhead costs to budgeted
overhead costs is part of the control process. It tells managers when
the actual results differ from what was expected.
780
To download more slides, ebook, solutions and test bank, visit
13-6 Incurred overhead will differ from applied overhead in much
the same way as any estimate will differ from actual experience.
Specific causes might be: variations in suppliers' prices;
inefficiencies in production (excessive down-time, for example);
failure of sales to materialize; failure to meet production quotas;
and unexpected increases in fixed overhead (increase in insurance
rates, for example). They also can arise because of inaccurate
overhead cost predictions.
13-7 No. Using "actual" overhead rates, unit costs will be lower as
production volume increases and higher with low volume. The
variable overhead rate will be approximately constant; the fixed
overhead rate will vary inversely with volume. The two rates
together form the total overhead rate.
13-8 Normal costing is the product-costing method whereby
inventory is carried at actual direct-material costs plus actual
direct-labor costs plus applied factory overhead at a budgeted rate.
13-9 The best theoretical method of allocating underapplied or
overapplied overhead is to disregard it completely and recompute
an actual overhead rate based on actual costs incurred allocated
over actual production units. Proration is usually a reasonable
approximation to this theoretical ideal.
13-10 The following are examples of costs that are now classified as
direct costs in many service industries: secretarial; photocopies;
phone calls; power; and costs of computer time.
13-11 Variable costing expenses fixed manufacturing overhead
immediately. Absorption costing applies fixed manufacturing
overhead to inventory as a product cost until the goods are sold.
Then the fixed manufacturing overhead is expensed as cost of goods
sold.
781
To download more slides, ebook, solutions and test bank, visit
13-12 The production-volume variance appears only on an
absorption-costing income statement.
13-13 For external reporting purposes, companies must report
actual production costs on the income statement. When variable
costing is used as a starting point, two types of adjustments are
required – production-volume variance adjustment and the
adjustment for the change in fixed overhead cost absorbed in
beginning and ending inventories.
13-14 No. Variable costing means that all variable costs of
manufacturing are inventoried. These include direct material,
direct labor, and the overhead costs that are incurred in direct
proportion to the volume of production, even though these costs may
only indirectly affect the production process and thus are
categorized as "overhead."
13-15 Fixed manufacturing overhead is considered a
noninventoriable or period cost under variable costing but a
product cost under absorption costing.
13-16 No. Variable costing is not acceptable for external reporting.
However, an increasing number of firms are using variable costing
for internal reporting. This is especially true for companies that
implement multi-stage activity-based costing systems (as described
in Chapter 4). These costing systems make heavy use of cost
behavior for planning and control purposes.
13-17 The tax authorities and those in charge of the rules for
financial reporting do not allow use of variable costing. Why? They
believe it violates the matching principle.
782
To download more slides, ebook, solutions and test bank, visit
13-18
The contribution margin is revenue less variable costs
(including both variable manufacturing costs and variable selling
and administrative costs). In contrast, gross margin is revenue less
manufacturing costs (including both variable manufacturing costs
and fixed manufacturing costs).
13-19 Fixed overhead is applied to product via a budgeted unit
overhead rate multiplied by an actual cost-allocation base activity
level such as machine hours or production units.
13-20 First, the unit product cost in absorption costing includes an
allocation of fixed costs, while in variable costing it consists of only
variable manufacturing costs. Second, fixed costs appear as a single
line in a variable-costing statement, but they are in two places (part
of product cost and as a production volume variance) in an
absorption-costing statement. Finally, a variable-costing statement
separates costs into fixed and variable components, while
absorption-costing statements separate them into manufacturing
and nonmanufacturing components.
13-21 This statement describes the treatment of fixed costs in an
absorption-costing system. Production volume does not affect total
fixed costs, but it does affect applied fixed costs, which are
proportional to the units of production.
13-22 Variable costing and cost-volume-profit analysis are both
based on separate measurements of fixed and variable costs. Both
focus on computation of the contribution margin, the difference
between revenue and all variable costs.
13-23 Yes. Only when actual production volume exactly equals the
expected volume is the applied fixed manufacturing overhead equal
to that budgeted. Although the exact equality is rare, most of the
time the difference will not be great.
783
To download more slides, ebook, solutions and test bank, visit
13-24 The production-volume variance depends on the expected
volume of production used as the denominator in setting the fixedoverhead rate. The higher the level chosen, the lower the rate. The
total amount of the variance is a function of the rate and the
deviation of actual volume from the volume used to set the rate.
13-25 Direct labor is a variable cost. The expected amount (i.e.,
flexible-budget amount) for a variable cost is the same as the
amount allocated (or applied) to the product. There is no conflict
between the budgeting and control purpose and the product-costing
purpose. Therefore, no variance is caused by production volume
differing from an expected volume.
13-26 No. Production-volume variances provide no information
about the control of fixed manufacturing costs. Such variances arise
solely because the actual production volume differs from the
expected volume.
13-27 Yes. The unit fixed cost is inversely proportional to the
denominator, expected units of production.
13-28 No. When the number of units sold exceeds the number
produced, that is, when inventory decreases, variable-costing
income exceeds absorption-costing income.
13-29 The manager might produce extra units even if they will not
be sold. Each unit produced will increase operating income by the
amount of the fixed manufacturing overhead per unit. By
producing enough units, the manager can assure that the operating
income budget is met and the bonus received.
784
To download more slides, ebook, solutions and test bank, visit
13-30 Variable- and absorption-costing incomes differ only when the
level of inventory changes. Furthermore, the amount of the
difference in income is proportional to the change in inventory.
When inventories are small, changes in inventory are also generally
small. Therefore, companies without much inventory will report
nearly the same operating income with variable costing as with
absorption costing.
13-31 No. Only the overhead production-volume variance is unique
to an absorption-costing system. All other overhead variances occur
in both variable- and absorption-costing systems.
13-32 A strong relationship between the factory overhead incurred
and the cost-allocation base is the best available indication of a
cause-and-effect relationship. That is, the more of the costallocation base that is used, the higher the actual overhead incurred.
It is important to consider the time period involved. Some overhead
costs, equipment for example, have a weak or no relationship to
machine hours used in the short run but a strong relationship to
providing the capability to operate machines over extended time
periods. Such costs are often called capacity costs.
13-33 No. Some service firms trace only direct-labor costs to
individual jobs. However, with advances in computer technology
and because competition causes a need for better cost information
about specific services, jobs, or customers, more service firms are
tracing additional costs to jobs. The more costs that are traced to
jobs instead of being allocated, the more accurate are the job costs.
785
To download more slides, ebook, solutions and test bank, visit
13-34 Fixed costs are difficult to deal with because revenue must be
enough to cover fixed as well as variable costs before a company
makes a profit, but fixed costs do not change with variations in
volume of production. Suppose that a company views a product cost
as the amount that needs to be received in revenue in the long-run to
be profitable. Such companies often want to assign fixed costs to the
products. Remember that the separation of fixed and variable costs
is inherently a short-run phenomenon. In the long run, where
capacity can be altered and all commitments can be renegotiated,
nearly all costs are variable. Thus, knowing the long-run product
cost can be important for strategic decisions. However, the long-run
product cost may differ from the accounting cost that includes an
allocation of fixed costs, because many fixed costs (for example,
depreciation) represent historical costs that may differ significantly
from the future cost needed to provide the same services. Thus, it
makes sense to include fixed costs in a prediction of long-run
product costs, but measuring those fixed costs by allocating fixed
historical costs to the products may not provide an accurate
measure. Yet, it may be better than the alternatives.
13-35 Most pricing and promotion decisions are short-run decisions.
They can be easily reversed if conditions in the marketplace change.
Thus, the decisions are unlikely to affect fixed costs unless they
increase or decrease demand enough that the volume moves outside
the relevant range. The immediate effect on the company’s profits
is measured by the revenue less the variable cost – that is, the
contribution margin. If the pricing or promotion decision has longtern effects as well, for example provides a level of market
penetration that will affect future sales levels, then the short-term
impact must be compared to the long-term effects. Separating longterm effects from short-term effects is often useful. We can predict
short-term effects from current accounting data, while the longterm effects are often poorly measured by data directly from the
accounting system. Allocation of fixed costs to products may give
786
To download more slides, ebook, solutions and test bank, visit
some information about long-term effects, but it is usually better to
separately estimate these effects.
13-36 A production-volume variance arises when production
exceeds or falls short of the volume used to set the fixed overhead
rate, often the expected volume. However, unlike the sales-volume
variance, the production-volume variance does not directly measure
the economic consequences of the production volume. If production
falls 10% short of the predicted volume, the production-volume
variance merely indicates that 10% of the fixed costs were not
applied to the products produced. It does not indicate that the
company incurs 10% more fixed costs than planned. A salesvolume variance of $10,000 means that if sales had met the target,
the company would have been $10,000 better off. If the productionvolume variance was $10,000, it does not mean that production of
the additional products would have generated $10,000 of benefit to
the company.
13-37 Some companies apply all costs from various stages of the
value chain to their products or services. This gives a measure of all
of the costs that have to be covered by revenues during the
product’s life cycle. It is most useful for strategic decisions –
decisions relating to long-run commitments to product lines and
facilities and establishing product mix and pricing policies. Such
allocations are less useful for tactical decisions – those relating to
short-term sales and production effects. There is no single measure
of cost that is appropriate for all decisions. Rather, cost measures
must be tailored to reflect the decisions for which they are being
used.
787
To download more slides, ebook, solutions and test bank, visit
13-38 (10-15 min.)
$312,000
$6
= 52,000 machine hours
Total budgeted amount of cost-allocation base =
Total applied overhead = $6 x 68,000 machine hours = $408,000
Underapplied overhead = actual overhead incurred – applied overhead
= $439,000 - $408,000
= $31,000
Actual costs must be reported in the income statement. So the
$31,000 underapplied overhead must be added to cost of goods sold.
13-39 (10-15 min.)
Budgeted overhead application rate:
$505,000
total budgeted factory overhead
=
= 10.1/DLH
total budgeted amount of cost driver 50,000 lab. hours
Applied overhead = overhead rate x actual number of driver units
Actual number of direct labor hours = $616,100 ÷ $10.10 = 61,000 direct labor
hours.
Actual costs must be reported in the income statement. So the $616,100 $577,000 = $39,100 overapplied overhead must be deducted from cost of goods
sold.
788
To download more slides, ebook, solutions and test bank, visit
13-40 (15-20 min.)
A major lesson of this exercise is the distinction between
budgeted, actual, and applied overhead. Case 2 is more challenging,
but it forces the student to learn basic relationships.
1.
c. $600,000 ÷ $400,000 = 150% of direct-labor cost
f. 1.50 x $570,000 = $855,000
g. $830,000 - $855,000 = $25,000 overapplied
2.
b. $420,000 ÷ 1.20 = $350,000
d. $390,000 ÷ 1.20 = $325,000
f. $425,000 - $35,000 = $390,000
789
To download more slides, ebook, solutions and test bank, visit
13-41 (10-15 min.)
(in thousands)
Case 1 Case 2
1.
2.
3.
Applied overhead: 30 x $8.50 =
36 x $8.50 =
Overhead incurred:
$32 + $22 + $35 + $138 =
$40 + $32 + $47 + $204 =
$255
$306
227
323
Overapplied overhead: $255 - $227 =
Underapplied overhead: $323 - $306 =
28
17
Note the irrelevant items:
Sales commissions are selling expenses.
Depreciation of finished goods warehouse is also a selling
expense because the manufacturing processing has been
completed.
Cost of goods sold is an overall figure of no use in this
problem.
Direct-labor cost and direct-material cost are not
pertinent either.
790
To download more slides, ebook, solutions and test bank, visit
13-42 (10-15 min.)
Overhead is overapplied by $453,000 - $409,000 = $44,000.
First Way
Unadjusted cost of goods sold
Deduct: Overapplied overhead
Adjusted cost of goods sold
$400,000
44,000
$356,000
Factory department overhead control
Cost of goods sold
44,000
Proration of
Second Way
Unadjusted Overapplied Overhead
Cost of goods sold $400,000 400/800 x $44,000 = $22,000
Work in process 200,000 200/800 x 44,000 = 11,000
Finished goods
200,000 200/800 x 44,000 = 11,000
Totals
$800,000
$44,000
Factory department overhead control
Cost of goods sold
Work in process
Finished goods
44,000
Adjusted
$378,000
189,000
189,000
$756,000
44,000
Cost of Goods Sold with Proration:
Unadjusted cost of goods sold
Deduct: Overapplied overhead for cost of goods sold
Adjusted cost of goods sold
22,000
11,000
11,000
$400,000
22,000
$378,000
Cost of goods sold would be $378,000 - $356,000 (or $44,000 $22,000) = $22,000 lower (and gross profit higher) under the first
way (no proration).
791
To download more slides, ebook, solutions and test bank, visit
13-43 (20 min.)
1.
This exercise helps students obtain a fundamental look at the
essential conceptual differences between the two inventory methods.
Amounts are in thousands of dollars.
Absorption Costing
Balance Sheets
January 1, 20X7
Cash
150 Capital Stock
December 31, 20X7
Cash, 150-60
90 Capital stock
Inventory, +60
60
150
Income Statements
150
Year 20X7
150 None
December 31, 20X8
Year 20X8
Cash, 90+43
133 Capital stock
150 Revenue
43
Inventory, 60-30 30 Retained earn., +13 13 Cost of Gds. Sold 30
163
163 Net income
13
December 31, 20X9
Cash, 133+43
176 Capital stock
150
Inventory, 30-30
0 Retained earn., 13+13 26
176
176
792
Year 20X9
Revenue
43
Cost of Gds. Sold 30
Net income
13
To download more slides, ebook, solutions and test bank, visit
2.
Variable (Direct) Costing
Balance Sheets
Income Statements
January 1, 20X7
Cash
150 Capital Stock
150
December 31, 20X7
Cash, 150-60
90 Capital stock
Inventory, +44
44 Retained earn., -16
134
Year 20X7
150 Revenue
0
- 16 Cost of Gds. Sold 16
134 Net loss
-16
December 31, 20X8
Cash, 90+43
133 Capital stock
150
Inventory, 44-22 22 Retained earn.,-16+21 5
155
155
Year 20X8
Revenue
43
Cost of Gds. Sold 22
Net income
21
December 31, 20X9
Year 20X9
Cash, 133+43
176 Capital stock
150 Revenue
43
Inventory, 22-22
0 Retained earn., 5+21 26 Cost of Gds. Sold 22
176
176 Net income
21
Ask the students to ponder how the income statements differ
for each year. As inventory levels build (20X7), the fixed overhead
is charged to expense under variable costing and lodged in inventory
under absorption costing, so income under variable costing is less.
But, as inventory levels decline, that fixed overhead is released
under absorption costing so that income under absorption costing is
less than that under variable costing in such years.
793
To download more slides, ebook, solutions and test bank, visit
13-44 (15 min.)
1.
Variable-costing operating income equals absorption-costing
operating income whenever the inventory level is unchanged
(beginning inventory equals ending inventory). No change in
inventory level implies that units produced equals units sold,
as in 20X8
2.
Absorption-costing operating income exceeds variable-costing
operating income when inventory levels increase, because
(under absorption costing) some fixed costs are applied to the
units in the enlarged inventory. Units produced exceed units
sold in 20X6 and 20X7.
3.
Repeat the idea in part (1), now considering the four-year
total operating income, which is the same ($240,000) under
both variable and absorption costing. Thus beginning
inventory in 20X6 (0 units) equals ending inventory in 20X9 (0
units), or $0.
4.
20X9's variable-costing operating income exceeds the
absorption-costing operating income by the amount of fixed
costs borne by the decreased inventory ($30,000). At $3.00 per
unit, units sold exceeds units produced by 10,000 units.
794