Instructor solution manual to accompany physical chemistry 7th ed by peter atkins chap08
Bạn đang xem bản rút gọn của tài liệu. Xem và tải ngay bản đầy đủ của tài liệu tại đây (764.93 KB, 15 trang )
8
Phase diagrams
Solutions to exercises
Discussion questions
E8.1(b)
What factors determine the number of theoretical plates required to achieve a desired degree of
separation in fractional distillation?
The principal factor is the shape of the two-phase liquid-vapor region in the phase diagram (usually
a temperature-composition diagram). The closer the liquid and vapour lines are to each other, the more
theoretical plates needed. See Fig. 8.15 of the text. But the presence of an azeotrope could prevent
the desired degree of separation from being achieved. Incomplete miscibility of the components at
specific concentrations could also affect the number of plates required.
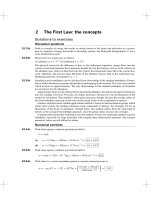
E8.2(b)
See Figs 8.1(a) and 8.1(b).
Liquid A and B
Liquid
A&B
Liquid
A&B
Solid B
Solid B
and
Solid AB2
Liquid A & B
Solid AB2
Solid A
Eutectic
Solid AB2 and Solid A
0.33
Figure 8.1(a)
B
an
d li
or
r an
qui
Va
p
Vap
o
dl
iqu
id
Vapor
d
Liquid
0.67
Figure 8.1(b)
PHASE DIAGRAMS
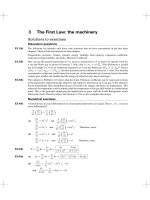
E8.3(b)
113
See Fig. 8.2.
Liquid
A&B
Liquid (A & B)
Solid B
Liquid
(A & B)
Solid A
Liquid
(A & B)
Liquid
Liquid (A & B)
(A & B) Solid
A2B
Solid
A2B
Solid A
Solid B
Solid B2A
Solid B2A
Two solid phases
Solid A2B
Solid A2B
Solid B2A
Two solid phases
Two solid phases
0.333
0.666
Figure 8.2
Numerical exercises
E8.4(b)
∗
∗
p = pA + pB = xA pA
+ (1 − xA )pB
xA =
∗
p − pB
∗ − p∗
pA
B
xA =
19 kPa − 18 kPa
= 0.5
20 kPa − 18 kPa
yA =
∗
x A pA
(0.5) × (20 kPa)
=
= 0.526 ≈ 0.5
∗
∗
∗
pB + (pA − pB )xA
18 kPa + (20 kPa − 18 kPa)0.5
A is 1,2-dimethylbenzene
yB = 1 − 0.526 = 0.474 ≈ 0.5
E8.5(b)
∗
pA = yA p = 0.612p = xA pA
= xA (68.8 kPa)
∗
pB = yB p = (1 − yA )p = 0.388p = xB pB
= (1 − xA ) × 82.1 kPa
∗
xA pA
yA p
=
∗
yB p
xB p B
and
68.8xA
0.612
=
0.388
82.1(1 − xA )
(0.388) × (68.8)xA = (0.612) × (82.1) − (0.612) × (82.1)xA
26.694xA = 50.245 − 50.245xA
xA =
50.245
26.694 + 50.245
= 0.653
xB = 1 − 0.653 = 0.347
∗
∗
p = xA pA
+ x B pB
= (0.653) × (68.8 kPa) + (0.347) × (82.1 kPa) = 73.4 kPa
INSTRUCTOR’S MANUAL
114
E8.6(b)
(a) If Raoult’s law holds, the solution is ideal.
∗
= (0.4217) × (110.1 kPa) = 46.43 kPa
pA = xA pA
∗
pB = xB pB
= (1 − 0.4217) × (94.93 kPa) = 54.90 kPa
p = pA + pB = (46.43 + 54.90) kPa = 101.33 kPa = 1.000 atm
Therefore, Raoult’s law correctly predicts the pressure of the boiling liquid and
the solution is ideal .
46.43 kPa
pA
(b)
yA =
=
= 0.4582
p
101.33 kPa
yB = 1 − yA = 1.000 − 0.4582 = 0.5418
E8.7(b)
Let B = benzene and T = toluene. Since the solution is equimolar zB = zT = 0.500
(a) Initially xB = zB and xT = zT ; thus
∗
+ xT pT∗ [8.3] = (0.500) × (74 Torr) + (0.500) × (22 Torr)
p = xB pB
= 37 Torr + 11 Torr = 48 Torr
pB
37 Torr
= 0.77
(b)
yB =
[4] =
48 Torr
p
(c) Near the end of the distillation
yB = zB = 0.500
y T = 1 − 0.77 = 0.23
and y T = zT = 0.500
Equation 5 may be solved for xA [A = benzene = B here]
xB =
yB pT∗
(0.500) × (22 Torr)
=
= 0.23
∗
∗
∗
pB + (pT − pB )yB
(75 Torr) + (22 − 74) Torr × (0.500)
xT = 1 − 0.23 = 0.77
This result for the special case of zB = zT = 0.500 could have been obtained directly by realizing
that
yB (initial) = xT (final)
yT (initial) = xB (final)
∗
+ xT pT∗ = (0.23) × (74 Torr) + (0.77) × (22 Torr) = 34 Torr
p(final) = xB pB
Thus in the course of the distillation the vapour pressure fell from 48 Torr to 34 Torr.
E8.8(b)
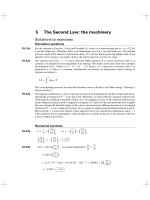
E8.9(b)
See the phase diagram in Fig. 8.3.
(a)
yA = 0.81
(b)
xA = 0.67
yA = 0.925
Al3+ , H+ , AlCl3 , Al(OH)3 , OH− , Cl− , H2 O giving seven species. There are also three equilibria
AlCl3 + 3H2 O
AlCl3
H2 O
Al
3+
Al(OH)3 + 3HCl
+ 3Cl−
H+ + OH−
and one condition of electrical neutrality
[H+ ] + 3[Al3+ ] = [OH− ] + [Cl− ]
Hence, the number of independent components is
C = 7 − (3 + 1) = 3
PHASE DIAGRAMS
115
155
150
145
140
135
130
125
120
0
0.2
0.4
0.6
0.8
1.0
Figure 8.3
E8.10(b)
NH4 Cl(s)
NH3 (g) + HCl(g)
(a) For this system C = 1 [Example 8.1] and P = 2 (s and g).
(b) If ammonia is added before heating, C = 2 (because NH4 Cl, NH3 are now independent) and
P = 2 (s and g).
E8.11(b)
(a) Still C = 2 (Na2 SO4 , H2 O), but now there is no solid phase present, so P = 2 (liquid solution,
vapour).
(b) The variance is F = 2 − 2 + 2 = 2 . We are free to change any two of the three variables,
amount of dissolved salt, pressure, or temperature, but not the third. If we change the amount
of dissolved salt and the pressure, the temperature is fixed by the equilibrium condition between
the two phases.
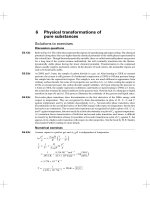
E8.12(b)
See Fig. 8.4.
E8.13(b)
See Fig. 8.5. The phase diagram should be labelled as in Fig. 8.5. (a) Solid Ag with dissolved Sn
begins to precipitate at a1 , and the sample solidifies completely at a2 . (b) Solid Ag with dissolved Sn
begins to precipitate at b1 , and the liquid becomes richer in Sn. The peritectic reaction occurs at b2 ,
and as cooling continues Ag3 Sn is precipitated and the liquid becomes richer in Sn. At b3 the system
has its eutectic composition (e) and freezes without further change.
E8.14(b)
See Fig. 8.6. The feature denoting incongruent melting is circled. Arrows on the tie line indicate
the decomposition products. There are two eutectics: one at xB = 0.53 , T = T2 ; another at
xB = 0.82 , T = T3 .
E8.15(b)
The cooling curves corresponding to the phase diagram in Fig. 8.7(a) are shown in Fig. 8.7(b). Note the
breaks (abrupt change in slope) at temperatures corresponding to points a1 , b1 , and b2 . Also note the
eutectic halts at a2 and b3 .
INSTRUCTOR’S MANUAL
116
Figure 8.4
(b)
(a)
800
460
e
200
Figure 8.5
0
0.33
0.67
Figure 8.6
PHASE DIAGRAMS
117
(b)
(a)
0
0.67
0.33
1
Figure 8.7
E8.16(b)
Rough estimates based on Fig. 8.37 of the text are
(a) xB ≈ 0.75
E8.17(b)
(b) xAB2 ≈ 0.8
(c) xAB2 ≈ 0.6
The phase diagram is shown in Fig. 8.8. The given data points are circled. The lines are schematic
at best.
1000
900
800
700
0
0.2
0.4
0.6
0.8
Figure 8.8
A solid solution with x(ZrF4 ) = 0.24 appears at 855◦ C. The solid solution continues to form, and
its ZrF4 content increases until it reaches x(ZrF4 ) = 0.40 and 820◦ C. At that temperature, the entire
sample is solid.
INSTRUCTOR’S MANUAL
118
E8.18(b)
The phase diagram for this system (Fig. 8.9) is very similar to that for the system methyl ethyl ether
and diborane of Exercise 8.12(a). (See the Student’s Solutions Manual.) The regions of the diagram
contain analogous substances. The solid compound begins to crystallize at 120 K. The liquid becomes
progressively richer in diborane until the liquid composition reaches 0.90 at 104 K. At that point the
liquid disappears as heat is removed. Below 104 K the system is a mixture of solid compound and
solid diborane.
140
130
120
110
100
90
0
E8.19
1
Figure 8.9
Refer to the phase diagram in the solution to Exercise 8.17(a). (See the Student’s Solutions Manual.)
The cooling curves are sketched in Fig. 8.10.
95
93
91
89
87
85
83
E8.20
Figure 8.10
(a) When xA falls to 0.47, a second liquid phase appears. The amount of new phase increases as xA
falls and the amount of original phase decreases until, at xA = 0.314, only one liquid remains.
(b) The mixture has a single liquid phase at all compositions.
The phase diagram is sketched in Fig. 8.11.
Solutions to problems
Solutions to numerical problems
P8.2
(a) The phase diagram is shown in Fig. 8.12.
(b) We need not interpolate data, for 296.0 K is a temperature for which we have experimental data.
The mole fraction of N, N-dimethylacetamide in the heptane-rich phase (α, at the left of the phase
diagram) is 0.168 and in the acetamide-rich phase (β, at right) 0.804. The proportions of the two
PHASE DIAGRAMS
119
54
52
50
48
46
44
42
40
38
0.1
0.2
0.3
0.4
0.5
0.6
0.7
0.8
0.9
1.0
Figure 8.11
310
305
300
295
290
0.0
0.2
0.4
0.6
0.8
1.0
Figure 8.12
phases are in an inverse ratio of the distance their mole fractions are from the composition point
in question, according to the lever rule. That is
nα /nβ = lβ / lα = (0.804 − 0.750)/(0.750 − 0.168) = 0.093
The smooth curve through the data crosses x = 0.750 at 302.5 K , the temperature point at which
the heptane-rich phase will vanish.
P8.6
See Fig. 8.13(a). The number of distinct chemical species (as opposed to components) and phases
present at the indicated points are, respectively
b(3, 2), d(2, 2), e(4, 3), f (4, 3), g(4, 3), k(2, 2)
[Liquid A and solid A are here considered distinct species.]
The cooling curves are shown in Fig. 8.13(b).
P8.8
The information has been used to construct the phase diagram in Fig. 8.14(a). In MgCu2 the mass
24.3
48.6
= 16 , and in Mg2 Cu it is (100) ×
= 43 .
percentage of Mg is (100) ×
24.3 + 127
48.6 + 63.5
◦
The initial point is a1 , corresponding to a liquid single-phase system. At a2 (at 720 C) MgCu2 begins
to come out of solution and the liquid becomes richer in Mg, moving toward e2 . At a3 there is solid
INSTRUCTOR’S MANUAL
120
Liquid A & B
Liquid A & B
Solid B
b
g
f
Liquid A & B
Solid A
Liquid A & B
Solid AB2
c
e
d
k
Solid A
and
Solid AB2
Solid AB2
and
Solid B
B
A
16%
23%
57%
67%
84%
xB
0.16
0.23
0.57
0.67
Figure 8.13(a)
0.84
Figure 8.13(b)
MgCu2 + liquid of composition e2 (33 per cent by mass of Mg). This solution freezes without further
change. The cooling curve will resemble that shown in Fig. 8.14(b).
P8.10
(a) eutectic: 40.2 at % Si at 1268◦ C
eutectic: 69.4 at % Si at 1030◦ C
congruent melting compounds: Ca2 Si mp = 1314◦ C
CaSi mp = 1324◦ C
incongruent melting compound: CaSi2
(68 at % Si)
mp = 1040◦ C
[8.6]
[8.7]
melts into CaSi(s) and liquid
PHASE DIAGRAMS
121
(a)
(b)
1200
a
a1
a2
800
e1
a3
e2
400
e3
Figure 8.14
(b) At 1000◦ C the phases at equilibrium will be Ca(s) and liquid (13 at % Si). The lever rule
gives the relative amounts:
lliq
0.2 − 0
nCa
= 2.86
=
=
nliq
lCa
0.2 − 0.13
(c) When an 80 at % Si melt it cooled in a manner that maintains equilibrium, Si(s) begins to appear
at about 1250◦ C. Further cooling causes more Si(s) to freeze out of the melt so that the melt
becomes more concentrated in Ca. There is a 69.4 at % Si eutectic at 1030◦ C. Just before the
eutectic is reached, the lever rule says that the relative amounts of the Si(s) and liquid (69.4%
Si) phases are:
lliq
0.80 − 0.694
nSi
=
= 0.53 = relative amounts at T slightly higher than 1030◦ C
=
nliq
lSi
1.0 − 0.80
Just before 1030◦ C, the Si(s) is 34.6 mol% of the total heterogeneous mixture; the eutectic
liquid is 65.4 mol%.
At the eutectic temperature a third phase appears - CaSi2 (s). As the melt cools at this temperature
both Si(s) and CaSi2 (s) freeze out of the melt while the concentration of the melt remains constant.
At a temperature slightly below 1030◦ C all the melt will have frozen to Si(s) and CaSi2 (s) with
the relative amounts:
lCaSi2
0.80 − 0.667
nsi
=
=
nCaSi2
1.0 − 0.80
lSi
= 0.665 = relative amounts at T slightly higher than 1030◦ C
Just under 1030◦ C, the Si(s) is 39.9 mol% of the total heterogeneous mixture; the CaSi2 (s) is
60.1 mol%.
A graph of mol% Si(s) and mol% CaSi2 (s) vs. mol% eutectic liquid is a convenient way to show
relative amounts of the three phases as the eutectic liquid freezes. Equations for the graph are
derived with the law of conservation of mass. For the silicon mass,
n · zSi = nliq · wSi + nSi · xSi + nCaSi2 · ySi
where
n = total number of moles.
INSTRUCTOR’S MANUAL
122
wSi = Si fraction in eutectic liquid = 0.694
xSi = Si fraction in Si(s) = 1.000
ySi = Si fraction in CaSi2 (s) = 0.667
zSi = Si fraction in melt = 0.800
This equation may be rewritten in mole fractions of each phase by dividing by n:
zSi = (mol fraction liq) · wSi + (mol fraction Si) · xSi + (mol fraction CaSi2 ) · ySi
Since, (mol fraction liq) + (mol fraction Si) + (mol fraction CaSi2 ) = 1
or (mol fraction CaSi2 ) = 1 − (mol fraction liq + mol fraction Si), we may write :
zSi = (mol fraction liq) · wSi + (mol fraction Si) · xSi
+[1 − (mol fraction liq + mol fraction Si)] · ySi
Solving for mol fraction Si:
(zSi − ySi ) − (wSi − ySi )(mol fraction liq)
xSi − ySi
mol fraction CaSi2 := 1 − (mol fraction liq + mol fraction Si)
mol fraction Si :=
These two eqns are used to prepare plots of the mol fraction of Si and the mol fraction of CaSi2
against the mol fraction of the melt in the range 0–0.65.
Freezing of Eutectic Melt at 1030°C
0.7
0.6
0.5
0.4
mol fraction CaSi2
mol fraction Si
0.3
0.2
0.1
0
0
0.1
0.2
0.3
0.4
0.5
0.6
0.7
mol fraction liq
Freezing Proceeds toward Left
Figure 8.15
Solutions to theoretical problems
P8.12
The general condition of equilibrium in an isolated system is dS = 0. Hence, if α and β constitute
an isolated system, which are in thermal contact with each other
dS = dSα + dSβ = 0
(a)
PHASE DIAGRAMS
123
Entropy is an additive property and may be expressed in terms of U and V .
S = S(U, V )
The implication of this problem is that energy in the form of heat may be transferred from one phase
to another, but that the phases are mechanically rigid, and hence their volumes are constant. Thus,
dV = 0, and
dS =
∂Sα
dUα +
∂Uα V
But, dUα = −dUβ ; therefore
∂Sβ
1
1
dUβ =
dUα +
dUβ [5.4]
∂Uβ V
Tα
Tβ
1
1
=
or Tα = Tβ
Tα
Tβ
Solutions to applications
P8.14
C = 1;
hence,
F =C−P +2=3−P
Since the tube is sealed there will always be some gaseous compound in equilibrium with the condensed phases. Thus when liquid begins to form upon melting, P = 3 (s, l, and g) and F = 0,
corresponding to a definite melting temperature. At the transition to a normal liquid, P = 3 (l, l ,
and g) as well, so again F = 0.
P8.16
The temperature-composition lines can be calculated from the formula for the depression of freezing
point [7.33].
T ≈
RT ∗2 xB
fus H
For bismuth
(8.314 J K−1 mol−1 ) × (544.5 K)2
RT ∗2
= 227 K
=
10.88 × 10³ J mol−1
fus H
For cadmium
(8.314 J K−1 mol−1 ) × (594 K)2
RT ∗2
=
= 483 K
6.07 × 10³ J mol−1
fus H
We can use these constants to construct the following tables
x(Cd)
T /K
Tf /K
0.1
22.7
522
0.2
45.4
499
0.3
68.1
476
0.4
90.8
454
x(Bi)
T /K
Tf /K
0.1
48.3
546
0.2
96.6
497
0.3
145
449
0.4
193
401
( T = x(Cd) × 227 K)
(Tf = Tf∗ − T )
( T = x(Bi) × 483 K)
(Tf = Tf∗ − T )
These points are plotted in Fig. 8.16(a).
The eutectic temperature and concentration are located by extrapolation of the plotted freezing
point lines until they intersect at e, which corresponds to TE ≈ 400 K and xE (Cd) ≈ 0.60.
Liquid at a cools without separation of a solid until a is reached (at 476 K). Solid Bi then seperates,
and the liquid becomes richer in Cd. At a (400 K) the composition is pure solid Bi + liquid of
composition x(Bi) = 0.4. The whole mass then solidfies to solid Bi + solid Cd.
INSTRUCTOR’S MANUAL
124
(a)
600
(b)
500
l
s
Solid
precipitates
Eutectic halt
400
1
0
(a) At 460 K (point a ),
Time
Figure 8.16
l(s)
n(l)
=
≈ 5 by the lever rule.
n(s)
l(l)
(b) At 375 K (point a ) there is no liquid . The cooling curve is shown in Fig. 8.16(b).
Comment. The experimental values of TE and xE (Cd) are 417 K and 0.55. The extrapolated
values can be considered to be remarkably close to the experimental ones when one considers
that the formulas employed apply only to dilute (ideal) solutions.
P8.17
(a) The data are plotted in Fig. 8.17.
10
8
6
4
2
0
0.2
0.4
0.6
0.8
1.0
Figure 8.17
(b) We need not interpolate data, for 6.02 MPa is a pressure for which we have experimental data.
The mole fraction of CO2 in the liquid phase is 0.4541 and in the vapour phase 0.9980. The
proportions of the two phases are in an inverse ratio of the distance their mole fractions are from
the composition point in question, according to the lever rule. That is
nliq
v
0.9980 − 0.5000
= =
= 10.85
nvap
l
0.5000 − 0.4541
P8.19
(a) As the solutions become either pure methanol (xmethanol = 1) or pure TAME (xmethanol = 0),
the activity coefficients should become equal to 1 (Table 7.3). This means that the extremes in
the range of ln γ (x) curves should approach zero as they do in the above plot (Fig. 8.18(a)).
PHASE DIAGRAMS
125
2
1.5
methanol
ln
1
TAME
0.5
0
0.2
0
0.4
0.6
0.8
1
xmethanol
Figure 8.18(a)
1000
GE / J mol–1
800
600
400
200
0
0
0.2
0.4
0.6
xmethanol
0.8
1
Figure 8.18(b)
(b) The large positive deviation of GE from the ideal mixture (GEideal = 0, Section 7.4) indicates
that the mixing process is unfavorable. This may originate from the breakage of relatively strong
methanol hydrogen bonding upon solution formation.
GE for a regular solution is expected to be symmetrical about the point xmethanol = 0.5. Visual
inspection of the GE (xmethanol ) plot reveals that methanol/TAME solutions are approximately
“regular”. The symmetry expectation can be demonstrated by remembering that HmE = W xA xB
and S E = 0 for a regular solution (Section 7.4b). Then, for a regular solution GEm = HmE −TS Em =
H E = W xA xB , which is symmetrical about x = 0.5 in the sense that GEm at x = 0.5 − δ equals
GEm at x = 0.5 + δ.
(c) Azeotrope composition and vapor pressure:
xmethanol = ymethanol = 0.682
P = 11.59 kPa
when xmethanol = 0.2, P = 10.00 kPa.
(d) The vapor pressure plot shows positive deviations from ideality. The escaping tendency is stronger
than that of an ideal solution.
To get the Henry’s law constants, estimate values for the targets of Pmethanol at xmethanol = 0
and PTAME at xmethanol = 1.
INSTRUCTOR’S MANUAL
126
Total Vapor Pressure / kPa
12
Soln composition (xmethanol)
10
Vapor composition (ymethanol)
8
6
0
0.2
0.4
0.6
0.8
1
Methanol Mole Fraction (xmethanol or ymethanol)
Figure 8.18(c)
15
P = Pmethanol + PTAME
Vapor Pressure / kPa
10
Pmethanol
5
PTAME
0
0
0.2
0.4
0.6
xmethanol
0.8
1
Figure 8.18(d)
For methanol in TAME (eqn 7.26):
dPmethanol
= 45.1 kPa
dxmethanol xmethanol =0
Kmethanol =
For TAME in methanol:
KTAME =
dPTAME
dPTAME
=−
= 25.3 kPa
dxTAME xTAME =0
dxmethanol xmethanol =1
(e) According to eqn 6.3, the vapor pressure should increase when the applied pressure is increased.
For TAME:
P = P ∗ eVm P /RT
✘
✘
−1
−1
−1 ✘
✟3 ✘
✟3 ✟
✟
✟✟
cm
mol✘
)(2.0 ✟
bar)/[(83.1451
cm
bar
K✟
mol✘
)(288.15✚
K)]
✟
= (6.09 kPa) e(131.78 ✟
= 6.16 kPa
The applied pressure increases the vapor pressure by about 1%, molecules have been “squeezed”
out of the liquid phase and into the gas phase but only to a slight extent.