macroeconomic mcgrowhill macro ch 13 19e use this one
Bạn đang xem bản rút gọn của tài liệu. Xem và tải ngay bản đầy đủ của tài liệu tại đây (283.47 KB, 33 trang )
13
Fiscal Policy, Deficits, and
Debt
McGraw-Hill/Irwin
Copyright © 2012 by The McGraw-Hill Companies, Inc. All rights reserved.
Chapter Objectives
• Purposes, Tools, and
Limitations of Fiscal Policy
• Role of Built-In Stabilizers in
Moderating Business Cycles
• How the Standardized Budget
Reveals the Status of U.S.
Fiscal Policy
• The Size, Composition, and
Consequences of the U.S.
Public Debt
30-2
Fiscal Policy
• Council of Economic Advisers
(CEA)
• Discretionary fiscal policy
– Eliminate recessionary or
inflationary gap
– Countercyclical
• Nondiscretionary fiscal policy
– Passive or automatic
30-3
Fiscal Policy and the
AD-AS Model or AE Model
• Expansionary Fiscal Policy
– Increased Government Spending
– Tax Reductions
– Some Combination of the Two
– Political considerations
• Budget Deficit
30-4
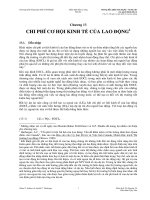
Expansionary Fiscal Policy
Recessions
Decrease
Aggregate
Demand
Price Level
$5 Billion
Additional
Spending
AS
Full $20 Billion
Increase in
Aggregate Demand
P1
AD1
AD2
$490
$510
Real Domestic Output, GDP
30-5
Equilibrium Versus
Full-Employment GDP
Recessionary Expenditure Gap
Aggregate Expenditures
(billions of dollars)
550
530
510
AE0
AE1
$5 Billion
Gap Yields
$20 Billion
GDP
Change
Recessionary
Expenditure
Gap = $5 Billion
490
470
Full
Employment
45°
490
510
530
Real GDP (billions of dollars)
30-6
Fiscal Policy and the
AD-AS Model
• Contractionary Fiscal Policy
– Decreased Government Spending
– Increased Taxes
– Some Combination of the Two
• Budget Surplus
• Policy Options: G or T?
• Political considerations
G 11.1
30-7
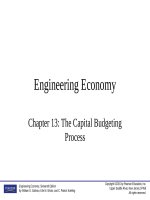
Contractionary Fiscal Policy
Reduce
Demand Pull
Inflation
$5 Billion
Initial Decrease
In Spending
Price Level
AS
Full $20 Billion
Decrease in
Aggregate Demand
P1
AD4
AD3
$510
$522
Real Domestic Output, GDP
30-8
Equilibrium Versus
Full-Employment GDP
Inflationary Expenditure Gap
AE2
Aggregate Expenditures
(billions of dollars)
550
530
AE0
Inflationary
Expenditure
Gap = $5 Billion
$5 Billion
Gap Yields
$20 Billion
GDP
Change
510
490
470
Full
Employment
45°
490
510
530
Real GDP (billions of dollars)
30-9
Built-In Stability
• Automatic stabilizers
– Taxes and transfers
• Economic importance
• Tax progressivity
– Progressive tax system
– Proportional tax system
– Regressive tax system
30-10
Built-In Stability
Government Expenses, G
and Tax Revenues, T
T
Surplus
G
Deficit
GDP1
GDP2
GDP3
Real Domestic Output, GDP
30-11
Evaluating Fiscal Policy
• Standardized budget
– Full-employment budget
•
•
•
•
Cyclical deficit
Recent U.S. fiscal policy
Budget deficits and projections
Social security considerations
30-12
Evaluating Fiscal Policy
• Is the fiscal policy…
• Expansionary?
• Neutral?
• Contractionary?
• Use the cyclically adjusted budget to
evaluate
LO3
13-13
Government Expenses, G
and Tax Revenues, T
Evaluating Fiscal Policy
T
Cyclical deficit
Fiscal policy
neutral
$500
$450
a
b
G
c
GDP2
(Year 2)
GDP1
(Year 1)
Real Domestic Output, GDP
30-14
Government Expenses, G
and Tax Revenues, T
Evaluating Fiscal Policy
Standardized deficit
Expansionary fiscal
policy
$500
d
e
$475
$450
$425
T1
T2
G
h
f
g
GDP4
(Year 4)
GDP3
(Year 3)
Real Domestic Output, GDP
30-15
Budget Balances as % of GDP
(1)
Year
(2)
Actual
Deficit (-) or
Surplus (+)
(3)
Standardized
Deficit (-) or
Surplus (+)
1992
1993
1994
1995
1996
1997
1998
1999
2000
2001
2002
2003
2004
2005
2006
2007
-4.5%
-3.8%
-2.9%
-2.2%
-1.4%
-0.3%
+0.8%
+1.4%
+2.5%
+1.3%
-1.5%
-3.4%
-3.5%
-2.6%
-1.9%
-1.3%
-2.9%
-2.9%
-2.1%
-2.0%
-1.2%
-1.0%
-0.4%
+0.1%
+1.1%
+1.0%
-1.2%
-2.5%
-2.4%
-1.9%
-1.8%
-1.4%
Source: Congressional Budget Office
30-16
Recent U.S. Fiscal Policy
Federal Deficits (-) and Surpluses (+) as Percentages of GDP, 2000-2009
(1)
Year
(2)
Actual
Deficit – or
Surplus +
(3)
Cyclically
Adjusted
Deficit – or
Surplus +*
2000
+2.4
+1.1
2001
+1.3
+0.5
2002
-1.5
-1.3
2003
-3.4
-2.7
2004
-3.5
-3.2
2005
-2.6
-2.5
2006
-1.9
-2.0
2007
-1.2
-1.2
2008
-3.2
-2.8
2009
-9.9
-7.3
•As a percentage of potential GDP
Source: Congressional Budget Office, .
LO3
13-17
Fiscal Policy: The Great Recession
• Financial market problems began in
•
•
•
LO4
2007
Credit market freeze
Pessimism spreads to the overall
economy
Recession officially began December
2007 and lasted 18 months
13-18
Global Perspective
LO4
13-19
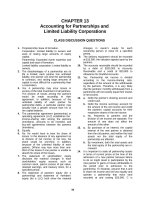
Budget Deficits and Projections
Actual
Projected
(as of March 2010)
Budget Deficit (-) or Surplus, Billions
$200
0
-200
-400
-600
-800
-1000
-1200
-1400
-1600
1994 1996 1998 2000 2002 2004 2006 2008 2010 2012 2014
Source: Congressional Budget Office, .
LO4
13-20
Fiscal
Policy
Issues
Problems, Criticisms, and Complications
• Problems of timing
– Recognition lag
– Administrative lag
– Operational lag
• Political considerations
– Political Business Cycle
– Annual balanced budgets
– Cyclically balanced budgets
• Future policy reversals
• Offsetting state and local finance
• Crowding-out effect
30-21
Current Thinking on Fiscal Policy
• Let the Federal Reserve handle short•
•
•
LO4
term fluctuations
Fiscal policy should be evaluated in
terms of long-term effects
Use tax cuts to enhance work effort,
investment, and innovation
Use government spending on public
capital projects
13-22
The U.S. Public Debt
•
•
LO4
$11.9 trillion in 2009 ($9.01 Trillion 2007
and $7.96 Trillion in 2005)
• The accumulation of years of federal
deficits and surpluses
Owed to the holders of U.S. securities
• Treasury bills
• Treasury notes
• Treasury bonds
• U.S. savings bonds
13-23
The U.S. Public Debt
Debt held
outside
the Federal
government
and the
Federal
Reserve:
57%
LO4
Debt held by
the Federal
government
and the
Federal
Reserve:
43%
13-24
The U.S. Public Debt
LO4
13-25