The problems of control account receivables turnover and ineffective finance leverage of minh phu seafood joint stock company
Bạn đang xem bản rút gọn của tài liệu. Xem và tải ngay bản đầy đủ của tài liệu tại đây (939.84 KB, 47 trang )
TABLE OF CONTENTS
Executive Summary .................................................................................................................................... 5
CHAPTER 1: INDUSTRIAL OVERVIEW AND COMPANY BACKGROUND ............................... 6
1.1. Industry overview ............................................................................................................................ 6
1.2. Company background ..................................................................................................................... 7
CHAPTER 2: IDENTIFICATION AND DEFINITION OF THE PROBLEM .................................. 11
2.1. Problems finding process .............................................................................................................. 11
2.2. Company’ symptoms ..................................................................................................................... 11
2.2.1. The significant decrement of profitability in 2015 ................................................................... 11
2.2.2. The remarkable much lower of profitability compared with average industry’s ratio in 2015. 13
2.3. Possible reasons behind the circumstance ................................................................................... 14
2.4. Actual reasons behind the circumstance ...................................................................................... 16
2.4.1. Bad management of gross margin, operating expense, interest and taxes resulted in the lower
profit margin ....................................................................................................................................... 16
2.4.2. Ineffective control accounts receivable days, inventory days and fixed-asset turnover resulted
in the lower asset turnover .................................................................................................................. 18
2.4.3. Ineffective financial leverage .................................................................................................... 21
CHAPTER 3: DESIGN SOLUTIONS AND SUGGESTIONS ............................................................. 26
3.1. Possible solution to improve efficiency in asset turnover and use effective finance leverage . 26
3.2 Suitable solutions to improve efficiency in asset turnover and use effective finance leverage in
Company’s circumstance ..................................................................................................................... 28
3.2.1. Revise credit collections ........................................................................................................... 29
3.2.2. Increase collect efficiency ......................................................................................................... 30
3.2.3. Manage inventory effectively ................................................................................................... 30
3.2.4. Using finance leverage in appropriate time .............................................................................. 31
CHAPTER 4: ACTION PLAN ................................................................................................................ 32
Reference ................................................................................................................................................... 35
Appendix .................................................................................................................................................... 37
2
UNIVERSITY OF ECONOMICS HO CHI MINH CITY
International School of Business
------------------------------
Nguyen Trang Kieu Diem
THE PROBLEMS OF CONTROL
ACCOUNT RECEIVABLES
TURNOVER AND INEFFECTIVE
FINANCE LEVERAGE OF MINH PHU
SEAFOOD JOINT STOCK COMPANY
MASTER OF BUSINESS ADMINISTRATION
SUPERVISOR: Dr. PHAM PHU QUOC
Ho Chi Minh City – Year 2018
1
LIST OF FIGURES
Figure 1. Minh Phu Seafood Join Stock Company structure
Figure 2. Minh Phu’s profitability ratios in the period 2013-2015
Figure 3. Minh Phu’s ROA, ROE compared with industry’s ratio over the period 2013-2015
Figure 4. Financial ratios linked to return on equity
Figure 5. Possible solutions of Minh Phu’s case
Figure 6. Minh Phu Seafood Joint Stock Company Action Plan
3
LIST OF TABLES
Table 1. Minh Phu’s profitability ratios in the period 2013-2015
Table 2. Minh Phu’s ROA, ROE compared with industry’s ratio over the period 2013-2015
Table 3. Minh Phu’s gross profit from 2013 to 2015
Table 4. Minh Phu’s portion of each components in income statement from 2013 to 2015
Table 5. Minh Phu’s account receivable and account payable turnover over the period 2013 – 2015
Table 6. Minh Phu’s inventory day over the period 2013 - 2015
Table 7. Indicators reflecting the asset structure of Minh Phu over the period 2013 - 2015
Table 8. Minh Phu’s indicators reflecting the resource structure
Table 9. Effects of some factors to Return on equity of the Company
Table 10. Analysis the possible solutions of Minh Phu
Table 11. Minh Phu Seafood Joint Stock Company Action Plan
4
CHAPTER 1: INDUSTRIAL OVERVIEW AND COMPANY BACKGROUND
1.1. Industry overview
Even Vietnam has a great potential for marine aquaculture, the sector also faces many
challenges. According to some reports, the country is blessed with nearly 250,000 hectares of
total area of marine and island aquaculture, of which the aquaculture area is over 150,000
hectares, the lagoon, hinterlands and islands are nearly 80,000 hectares, and the rest is open sea.
This area can be used to develop marine aquaculture including bays, coastal tidal areas and parts
of islands and open seas. Additionally, Vietnamese sea houses many species of fish that can be
naturally distributed into the sea such as grouper, snapper, orange fish, sea bass, cobia, sea bass.
In fact, in a brief report presenting in Norway in August 2016, the emerging East Asia economy
was stated to have an estimated seafood production of 6.55 million tons, making the country the
4th largest seafood producer, the 8th largest fishing nations, and 3rd world largest exporter of fish
and fisheries products. Furthermore, Vietnam is also the 3rd largest in the world in breeding,
raising, and selling Tiger Prawns, and Shrimps. Most recently, in 2017, with export growth of
more than 10% in the second quarter, total seafood export value of Vietnam in the first half of
2017 was about USD 3.6 billion, up 14.6 percent over the same period last year. Such explosive
growth and potential has made marine aquaculture a key industry in the development of Vietnam
economy.
Beside the geographical advantages mentioned above, Vietnam also faces many
challenges and difficulties. Most companies in the country remains small scale both in capital
and modern technologies. The lack in capital and technologies hinder the sector’s ability to enter
into the developed market with high requirement in quality. For instance, the Europe is the
largest importer of agricultural, forest and food products in the world. But the European market
6
Executive Summary
Minh Phu Seafood Joint Stock Company (Minh Phu), the largest shrimp processor in
Vietnam and was known as the shrimp king of Vietnam had always operated at high profit since
2012. However, the Company’s performance faced a significant down trend, even made loss in
2015. After a thorough investigation on the case, the circumstance was found there are two main
problems related to control over account receivables turnover and ineffective finance leverage of
the Company. In detail, the accounts receivable turnover in 2013 was 13.27 and 13.02 in 2014,
while the figure decrease 10.28 in 2015 which show that management of account receivable has
the problem. About the using finance leverage, the debt ratio in the period from 2013 to 2015
always high and maintain at 74% - 75% while the aquatic economic face many challenges and
difficulties in 2015. In the bad economic times, the high financial leverage made the profitability
worse. In addition, the interest rate is higher than the return on equity before tax and interest
means that the Company use the loan will decline return on equity. Financial leverage to amplify
reduce return on equity and financial risk of the company in 2015 increased.
As for solution, the author recommends on improving the problems through improve
account receivable turnover and the efficiency of finance leverage. Firstly, Minh Phu can
improve account receivables turnover through revise credit term, tight control the account
receivables and increase collection efficiency. Secondly, Minh Phu can use the finance leverage
effectively by reduce financing the debt, increase equity and use finance leverage in appropriate
time based on the economic status.
5
requires high quality of goods to ensure the safety for local consumers. In an interview with Ms.
Miriam Garcia - Ferrer, First Counselor, Delegation of the European Union in Vietnam, the lady
representative of the Europe has expressed great concern on the capability to ascertain marine
products’ quality of Vietnam. She even presented the case of Vietnam's bivalve molluscs has
been approved by the EU on the list of Vietnamese exporters, but now banned by the European
Union because of the problematic inspection by the EU as an example. In another example,
Vietnamese pangasius have also been stopped recently by some French super markets not
because of food safety but also environment problems. Nonetheless, with such geographical and
weather advantages, Vietnam marine aquaculture has great future and potential to be tapped into.
1.2. Company background
Minh Phu’s precursor was a private enterprise. It was established on 14th December 1992.
After over 20 years of continuous development, so far Minh Phu has become one of leading
seafood corporations with largest seafood export revenue nationwide as well as in the region and
all over the world.
The principal activities of the Company are to process and trade in aquatic products,
aquatic breeds and aquatic foods, machinery and equipment for aquaculture. The structure of
Group was showed in the charge below:
7
Figure 1: Minh Phu Seafood Join Stock Company structure
8
Principal targets of the corporation:
-
Focus on its main business production lines in 2011, which are producing disease-free
and clean baby shrimp, expanding areas for raising commercial shrimp, producing
biological products for the aquaculture industry, producing and processing shrimp for
export.
-
Make best efforts to maintain its role as one of Vietnam’s leading seafood exporters.
-
Maintain current export markets, continuously develop new export market and
especially build Minh Phu as strong brand.
-
Continuously expand areas for disease-free and industrial shrimp and associate with
forestry and fishery farms in Ca Mau to raise shrimp in large scale in other to provide
raw materials of clean shrimp to Minh Phu’s processing factories.
-
Enhance the tasks of business administration, personnel organization and payment
policy, consistently give training, attract excellent employees, have good incentive
policies to the company’s leading officers, management personal and workers.
Medium and long-term development strategy:
-
Associate with Vietnam’s leading producers of shrimp feed to invest in building
factories producing feed for shrimp to supply the feed to Minh Phu’ shrimp raising
enterprises, forming a full circle process from producing feed and disease-free shrimp
babies, raising clean shrimp to processing for export. Our target is for Minh Phu to
feed 5.000ha of industrial shrimp and make improvement to over 70% of whole
shrimp needs of the Corporation by 2015.
9
-
Invest strongly in science and technology to study and select the line of chemical
treatments of shrimp. Breeding white leg shrimp for desirable general characteristics
such as fast growth and adaptability to changes in climate and weather.
-
Research and build a modern model, which achieves high rates, low prices and
ensures safety in the biological work to foster sustainable and profitable shrimp
production.
-
Associate with manufacturers of carton packaging, coated PA/PE, plastic trays, tray
soap, flour production as well as the leading manufacturers of sauce in Vietnam and
the world to build packaging, supplies, materials, etc. factories to create a system of
surrounding factories around Minh Phu – Hau Giang factory to provide for factories
of Minh Phu Seafood Joint Stock Company.
-
Join with local and foreign partners to build the Container Port on Hau Giang.
-
Establish shrimp distribution companies in EU, Russia and China, etc. in order to
increase export profits and enhance the efficiency of producing, processing, exporting
and distributing shrimp globally.
10
CHAPTER 2: IDENTIFICATION AND DEFINITION OF THE PROBLEM
2.1. Problems finding process
In order to identify the company’s problems, these following steps will be executed:
- Analysis the financial statement, finance ratio and compare with the industry to identify
the symptoms;
- Review the literature related to the symptoms;
- Further study of the company financial, accounting data and the industry;
- Interview with management personnel, Board of Management of the Company, for
further information.
2.2. Company’ symptoms
After deep analysed the financial statement and investigated the financial ratios, the
symptoms of the problem had revealed as following:
- The significant decrement of profitability in 2015 and ;
- The remarkable much lower of profitability compared with average industry’s ratio in
2015.
2.2.1. The significant decrement of profitability in 2015
Minh Phu experienced the toughest year 2015 in the last decade with the loss of VND 6.9
billion even though it was the largest shrimp processor in Vietnam and was known as the shrimp
king of Vietnam, it had always operated at high profit since 2012. The table 1 below shows the
profitability ratios over the period from 2013 to 2015:
11
2015
Net operating profit
Profit before tax
Profit/(loss) after tax
Basic EPS
Return on asset
Return on equity
2014
7,740 1,052,7
12,136 1,047,5
(6,946) 921,048
474
10,930
-0.08% 10.89%
-0.31% 42.88%
2013
375,906
365,756
293,834
3,882
4.23%
17.28%
2015 against
2014 against
Amount
%
Amount
%
(1,044,97 -99% 676,80
180%
(1,035,40 -99% 681,78
186%
(927,994) -101% 627,21
213%
(10,456) -96%
7,048
182%
6.66%
25.60
Table 1. Minh Phu’s profitability ratios in the period 2013-2015
The table shows that the profit decreased significantly, even loss in 2015. Profit after tax
was reach VND 921 billion in 2014 while it was negative VND 6.9 billion in 2015, that
decreased by 101%, equivalent to 928 billion VND. Return on assets rose sharply from 4.23% in
2013 to 10.89% in 2014 and went down significantly to -0.08% in 2015. In 2014, the ROA of
10.89% means that every 100 VND capital of the enterprise will generate after-tax profit of
10.89 VND. While every 100 VND capital in 2015 made a loss 0.08 VND. In addition, it can be
seen that the return on equity increased from 17.28% in 2013 to 42.88% in 2014 and decreased
noticeably to -0.31% in 2015. The indicator show that while each 100 VND of equity generated
17.28 VND and 42.88 VND of profit-after tax respectively in 2013 and 2014, each 100 VND of
equity in 2015 made loss of 0.31 VND. The EPS showed the noticeable down-ward trend in
2015. From 2013 to 2014, the EPS increased steadily from VND3,882 per share and got the peak
at VND10,930 per share in 2014. However, in 2015, the EPS went down steeply and reached the
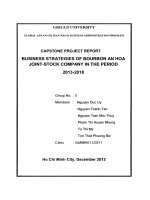
lowest point was VND474 per share. The figure below show the overall picture of decrease of
profitability from 2013 to 2015:
12
1200000
1000000
2015
800000
600000
2014
400000
200000
2013
0
-200000
2013
2014
2015
Net operating profit
Profit before tax
Profit/(loss) after tax
Basic EPS
-0.1
0
0.1
0.2
Return on equity
0.3
0.4
0.5
Return on asset
Figure 2. Minh Phu’s profitability ratios in the period 2013-2015
2.2.2. The remarkable much lower of profitability compared with average industry’s ratio
in 2015
2015
Return On Assets (ROA)
Average ROA of aquatic industry in Vietnam
Return On Equity (ROE)
Average ROE of aquatic industry in Vietnam
2014
2013
-0.08%
10.89%
4.23%
1%
2%
3%
-0.31%
42.88%
17.28%
4%
4%
7%
Table 2. Minh Phu’s ROA, ROE compared with industry’s ratio over the period 2013-2015
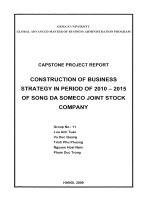
The table 2 shows that the average ROA of aquatic industry also experienced the downtrend, ROA decreased from 3% in 2013 to 2% in 2014 and 1% in 2015. However, it can be seen
that the ROA of Minh Phu went down noticeably from 10.89% in 2014 to negative 0.08% in
2015. The much lower ROA compared with average one of aquatic industry in Vietnam
demonstrates the lower efficient of using assets of the Company.
The return on equity increased from 17.28% in 2013 to 42.88% in 2014 and decreased
noticeably to -0.31% in 2015. When compared with the average ratios of the same industry in
Vietnam, it showed the significant lower of ROE of the Company.
13
0.5
0.4
0.3
0.2
0.1
0
2013
2014
2015
-0.1
ROA
Industry's ROA
ROE
Industry's ROE
Figure 3. Minh Phu’s ROA, ROE compared with industry’s ratio over the period 2013-2015
2.3. Possible reasons behind the circumstance
Kostini el at (1) measured the profitability based on analysis of Return on Asset (ROA),
Kostini states that ROA is the effective profitability measurement used to assess the
effectiveness in generating profit of the company’s assets.
Collier (2) presents financial analysis of a bank by DuPont analysis which based on
analysis of return on equity which is disaggregated into net profit margin, total asset turnover and
the equity multiplier.
Isberg (3) carried out a study to get insight of the firm’s performance, liquidity, leverage,
operating efficiency and profitability used the DuPont ratio. The formula is defined clearly as:
Net Income/Total Equity = (Net Income/Net Sales) x (Net Sales/Total Asset) x (Total
Asset/ Total Equity); or it can be rewritten as
Net Income/Total Equity = (Net Income/Net Sales) x (Net Sales/Total Asset) x (Total
Asset/Total debt) x (Total debt/ Total Equity).
14
Kieu Minh Nguyen (4) stated that profitability is affected by profit margin, asset turnover
and financial leverage and impacted by below factors:
Figure 4. Financial ratios linked to return on equity
The figure 4 provides the quick insight into factors affecting the profitability including:
gross margin, operating expense, interest, taxes, accounts receivable days, inventory days, fixedasset turnover, leverage and coverage.
Therefore, there are 3 possible problems below can cause the decline of ROE:
-
Bad management of gross margin, operating expense, interest and taxes resulted in
the lower profit margin;
-
Ineffective control accounts receivable days, inventory days and fixed-asset turnover
resulted in the lower asset turnover;
-
Ineffective financial leverage.
15
2.4. Actual reasons behind the circumstance
The author performed deep analysis on financial statement by measure all factors showed
in Figure 4 to investigate the real problem of the Company in 2015 and found that there are 2
actual reasons cause the problems:
- Ineffective control accounts receivable days;
- Ineffective financial leverage
2.4.1. Bad management of gross margin, operating expense, interest and taxes resulted in
the lower profit margin
2.4.1.2. Analysing gross margin over the period from 2013 to 2015
2015
2014
2013
Revenue from sales of goods 12,472,342,348,524 15,224,802,761,482 11,206,430,460,422
Revenue deductions
185,717,938,569
130,061,808,523
-94,480,405,091
Net revenue
12,286,624,409,955 15,094,740,952,959 11,111,950,055,331
Cost of sales
11,214,768,939,264 13,078,415,992,602 9,955,628,683,286
Gross profit
1,071,855,470,691 2,016,324,960,357 1,156,321,372,045
Table 3. Minh Phu’s gross profit from 2013 to 2015
The gross profit from VND2,016 billion in 2014 to VND1,072 billion in 2015, decreased
by VND944 billion, approximate 47%. This is the problem of not only Minh Phu but also of
whole aquatic industry in Vietnam in 2015. Vietnam Association of Seafood Exporters and
Producers reported that global shrimp industry during 2015 was not facing trouble relating to
EMS syndrome, diseases that lead to the significant increase in globally source of materials as
well as processed shrimp while consumption demand decreased. That resulted in the significant
decrease in unit price during 2015 and lost some foreign customers, as Vietnamese companies
had to experience the competition for foreign company offering the competitive price. The
decrease of selling price, loss market and the competition with foreign competitors resulted in
the total cost divide total revenue was high are the common problems of whole aquatic industry
16
in Vietnam. Therefore, the decrement of gross margin is not due to bad management cost of sales
of Minh Phu’s management.
2.4.1.2. Analysing operating expense over the period from 2013 to 2015
In order to identify if operating expense including selling expense and general and
administration expense is the main factor leading to the decrement of gross margin, the table 4
showed the portion of each components in net revenue over the period from 2013 to 2015.
Net revenue
Cost of sales
Financial
income
Financial
expenses
Selling
expenses
GA expenses
Other income
Other
expenses
EBT
VND
Portion (%)
2015
2014
2013
2015 2014 2013
12,286,624,409,955 15,094,740,952,959 11,111,950,055,331 100% 100% 100%
11,214,768,939,264 13,078,415,992,602 9,955,628,683,286 91% 87% 90%
270,405,669,954
146,635,796,390
113,758,468,639
-2%
-1%
-1%
440,583,234,855
257,698,717,542
305,521,702,030
4%
2%
3%
729,270,070,995
694,714,723,573
478,047,143,198
6%
5%
4%
164,667,684,883
20,918,014,777
157,837,686,476
9,762,705,782
110,604,902,548
6,074,024,049
1%
0%
1%
0%
1%
0%
16,521,947,296
14,934,290,801
16,224,376,412
0%
0%
0%
12,136,217,393
1,047,538,044,137
365,755,740,545
0%
7%
2%
Table 4. Minh Phu’s portion of each components in income statement from 2013 to 2015
The table 4 show that the operating expense including selling expense and GA expense
made up the small portion in total net revenue. The portion of operating expense kept the quite
stable portion. In detail, the selling expense only holds 4%, 5% and 6% respectively in 2013,
2014 and 2015. In addition, the GA expense only occupies 1% in whole 3 years in this period.
For this reason, the management of operating expense also not the actual problems of Minh Phu
in 2015.
17
2.4.1.3. Analysing interest expense over the period from 2013 to 2015
The tables 4 indicates the opposite trend of interest expense from 2013 to 2014 and 2014
to 2015. The interest expense decreased by VND47.8 billion, approximate 16% from 2013 to
2014. On the contrary, the interest expense increase significantly by VND182.9 billion,
approximate 71% from 2014 to 2015. In addition, in can be seen that the portion of interest
expense in 2015 made up 4% double the one in 2014. Correspondingly, the management over the
interest expense in 2015 is the main reasons lead to the decrease of profit margin in this year.
Kieu Minh Nguyen (8) concluded that the larger interest expense implied the increase in
financial leverage. The financial leverage was deeply analysed in the part 2.4.3 below.
2.4.2. Ineffective control accounts receivable days, inventory days and fixed-asset turnover
resulted in the lower asset turnover
2.4.2.1. Analysing accounts receivable days over the period from 2013 to 2015
2015
2014
2013
1
Net revenue
12,286,624
15,094,741
11,111,950
2
Liabilities
6,981,588
7,010,269
5,616,870
3
Total asset
9,225,148
9,285,489
7,637,543
4
Average account receivable
1,194,664
1,159,468
837,094
5
Account receivable turnover
10.28
13.02
13.27
6
Days of account receivable turnover
33.11
30.83
34.29
7
Average account payable
158,718
332,402
334,151
8
Cost of sales
11,214,769
13,078,416
9,955,629
9
Account payable turnover = (13)/(12)
70.66
39.35
29.79
10 Days of account payable turnover =
5.17
9.28
12.25
Table 5: Minh Phu’s account receivable and account payable turnover over the period
2013 – 2015
18
The accounts receivable turnover in 2013 was 13.27 and 13.02 in 2014, while the figure
decrease 10.28 in 2015. The amount decreased by 2.73, approximate 21% compared with 2014.
The Company's accounts receivable turnover decreased at the end of 2015 show that the
management of account receivable has the problem. The lower the turnover, the longer the time
between sales and collecting cash. There is an opportunity cost of holding receivables for a
longer period of time, resulted in the lower asset turnover. Days of account receivable turnover is
the length of time it takes to clear all Accounts Receivable, or how long it takes to receive the
money for goods it sells. According the table above, the average collection period in 2013 was
34.29 days, 30.83 days in 2014 and increased to 33.11 days in 2015. The collection period
increased by 2.28 days or 7% compared with 2014. The reason is that in 2015 the rate of increase
of the Company's accounts receivable at a 3%, equivalent to VND 35 billion while the average
revenue had a down trend by VND 7.6 billion, approximate 19%. This represents the problem in
collecting receivables from customers of the Company.
Account payable turnover of Minh Phu had a significant increase from 29.79 in 2013 to
39.35 in 2014 and 70.66 in 2015. The amount increased by 31.31, approximate 80% compared
with the turnover in 2014. This indicated that Minh Phu had to follow the strict credit term of
suppliers while the Company manage the collecting from customer not good, the Company had
to borrow loans to make payment for suppliers. Correspondingly, accounts payable days also
decreased from 12.25 days in 2013 to 9.28 days in 2014 and 5.17 days in 2015.
Compared the account receivables and account payables, the author found that Minh
Phu’s capital was noticeably occupied in 2015. The poor management over the account
receivables turnover lead to the lower asset turnover in 2015.
19
2.4.2.2. Analysing inventory day over the period from 2013 to 2015
1
2
3
4
2015
2014
2013
Cost of sales
11,214,769
13,078,416
9,955,629
Average inventory
4,382,090
3,457,881
2,346,352
Inventory turnover = (1)
2.56
3.78
4.24
Days in inventory =
140.67
95.18
84.85
Table 6. Minh Phu’s inventory day over the period 2013 - 2015
The inventory in 2013 was 4.24 and rotation period was 84.85 days inventory, in 2014
inventory turnover reduce to 3.78, correspondingly the period of rotation went up by 95.18 days.
In 2015, inventory turnover was 2.56 and the period of rotation was 140.67 days. Inventory
turnover increased in 2015 compared to 2014 1.22 shows that the company faced the difficult in
selling goods in 2015. As mentioned in the part 2.3.1, Vietnam Association of Seafood Exporters
and Producers (5) reported that global shrimp industry during 2015, the difficulty in selling
goods due to the lower global’ demand is the common problems of the industry. Hence, the
management over the inventory is not the main reason affecting the lower asset turnover.
2.4.2.3. Analysing fixed asset turnover over the period from 2013 to 2015
Steven Bragg (6) stated that a manufacture services business including trading business
that requires a minimal amount of fixed assets may have few or no noncurrent assets. For this
reason, the non-current is much lower than the current asset that indicated by the table 7 below:
The Company
Aquatic industry
2015
2014
2013
2015 2014 2013
1 Current assets
7,264,439
7,592,303
5,871,493
2 Long-term assets
1,960,709
1,693,186
1,766,050
3 TOTAL ASSETS
9,225,148
9,285,489
7,637,543
4 Current asset ratio = (1)/(3) 78.75%
81.77%
76.88%
76% 74% 74%
5 Long-term asset ratio =
21.25%
18.23%
23.12%
24% 26% 26%
Table 7. Indicators reflecting the asset structure of Minh Phu over the period 2013 - 2015
20
The current asset ratio was 76.88% and long-term assets ratio is 23.12% in 2013. In 2014,
the ratio current assets was 81.77%, while the rate long-term assets was 18.23%, that means in 1
VND of total assets, the current assets accounted for 0.7688 VND, and long-term assets
accounted for 0.2312 VND. In 2015, the rate short-term assets was 78.75%, while the rate of
long-term assets is 21.25% means that 1 VND of copper assets, the short-term assets accounted
for 0.7874 VND, while long-term assets accounted for 0.2125 VND. The ratio of assets invested
in current asset and long-term asset of the company over three years did not fluctuate too much.
It can be seen that the proportion of assets invested in current asset was higher proportion of
long-term asset. This percentage is reasonable when compare with the average percentage of
aquatic industry as the Company is operating as a commercial business. Accordingly, the
management over the fixed assets turnover is not the main reason of the lower asset turnover.
2.4.3. Ineffective financial leverage
2.4.3.1. Analysing the leverage over the period from 2013 to 2015
The Company can use of financial leverage in the capital structure that maybe contributes
heavily in the success or failure of companies, based on their ability to balance the general
positive and negative possible effects of it. The table 8 below provide the overview on the level
using financial leverage of the Company compared with the aquatic industry in Vietnam.
1
2
3
The Company
Aquatic industry
2015
2014
2013
2015 2014 2013
Liabilities
6,981,588 7,010,269
5,616,870
Equity
2,243,560 2,275,219
2,020,673
Total resources
9,225,148 9,285,489
7,637,543
Liabilities ratio = (1)/(3)
76%
75%
74% 75%
67%
63%
Equity ratio = (2)/(3)
24%
25%
26% 25%
33%
37%
Liabilities/Equity=(1)/(2)
311%
308%
278% 298% 203% 168%
Table 8. Minh Phu’s indicators reflecting the resource structure
21
Debt ratio increased due to higher grow rate liabilities compared with the grow rate of
total capital. The Company's liabilities ratio increased during 3 years due to the Company use the
loan to expand the business scale. Loans increased mainly due to increase of long-term debt,
which is mainly due to the Company issue bonds with amount VND 3,500 billion in 2015.
Increasing debt ratio means that the financial risk of the company increases, the company is
using the financial leverage to contribute to higher profit margins and return on equity as well.
The equity ratio measures how much of the Company’s assets were financed by investors. In
other words, this is the investors' stake in the company. The ratio had a down trend through 2013
to 2015, that decreased from 26% in 2013 to 25% in 2014 and 24% in 2015. A lower ratio also
shows potential creditors that the company is less sustainable and more risky to lend future loans.
Moreover, the equity ratio is always less than 0.5 show the low level of financial autonomy of
the Company so the financial risk the company also increased.
The use of financial leverage has both positive and negative impact on the business
performance. If the Company manage the loans well, or using financial leverage effectively, the
return on the equity will increase. However the financial leverage also means increased financial
risks of the business, if the Company borrows too much, that can lead to loss the ability to pay
the principal and interest expense. How effective the Company use the financial leverage would
be analyzed more in the following part.
2.4.3.2. Analysing the interest coverage over the period from 2013 to 2015
Kraus (7) stated that the optimal capital structure is determined by balancing the positives
& negative effects of financial leverage. In other words, balancing the benefits of debt financing,
that includes: tax savings, reducing agency cost, with the cost associated with the debt, that
include direct and indirect bankruptcy costs.
22
The use of financial leverage proven to be beneficial when the investment made by the
leverage earn returns more than the cost of debt. Miller (8) suggested that although that debt
financing is affiliated with a higher chance of bankruptcy risks & costs. These disadvantages are
relatively small as compared to the tax shield that associates the use of financial leverage.
Perinpanathan (9) showed that the financial leverage may have a negative impact if the
investment that has been mad did not achieve sufficient returns (higher than the cost of debt)
having no recognizable income to shield, meaning that the if the returns is lower than the cost of
debt the company will be at a higher risk due to the level of debt they undertook, resulting in
reducing the overall value of the company.
Furthermore, Baxter (10) suggested that the use of financial leverage is linked to a higher
possibility of bankruptcy risks & financial defaults. Due to the commitment that is associated
with the use of debts, such as the periodic interest payments, and the principle paid by the
company, and because of these risks shareholders will demand a higher return, which puts the
company in a critical situation.
Abdallah (11) stated that there is another way to calculate the ROE as follow:
ROE = [ROAE + D/E (ROAE – i)] x (1 – t)
Therein:
- ROAE: Return on asset before tax and interest expense
- D: Debt
- E: Equity
- i: interest rate
- t: CIT rate
23
1
2
3
4
5
6
7
Interest expense
Debt
EBIT
Average total asset
Interest rate (i) = (1)/(2)
Return on asset before tax and
interest expense
Interest Coverage (5/6)
2015
217,115
6,981,588
229,251
9,255,318
3.11%
2.48%
2014
167,134
7,010,269
1,214,672
8,461,516
2.38%
14.36%
2013
249,916
5,616,870
615,672
6,953,737
4.45%
8.85%
0.80
6.02
1.99
Table 9: Effects of some factors to Return on equity of the Company
It can be found that in 2013, i = 4.45%
Similarly, in 2014 the Company continued to use financial leverage to increase the rate of return
of equity, i = 2.38%
On the contrary, in 2015, i = 3.11%> ROAE (2.48%) means as companies use the loan
will decline return on equity. Financial leverage to amplify reduce return on equity and financial
risk of the company in 2015 increased.
If the Company did not use finance leverage (i.e. the Assets-to-Equity Ratio is 1):
In 2013, ROE0 = 1.60 x 2.64 x 1
If the Company uses the finance leverage:
ROE = 1.60 x 2.64 x 4.09 = 4.09 x ROE0
The using of finance leverage help to magnify the Company’s ROE to 4.09 times
compared with the no finance leverage condition.
24
Similarly, the using of finance leverage help to increase ROE of the Company by 3.94
times and 4.10 times respectively in 2014 and 2015. It can be seen that the financial leverage
help to increase ROE in the ideal level, however, the environment in 2015 went down, the
Company has to face a difficulty year, the use of financial leverage causes an increase in the
company’s financial risk. As a result of the high risk that associate the use of the use of debt
securities, the company becomes subject to more restrictions.
In addition, Julie et al (12) stated that the interest coverage measures the ability to meet
interest payment obligations with business income. Ratios close to 1 indicates company having
difficulty generating enough cash flow to pay interest on its debt. Ideally, a ratio should be over
1.5. The table 9 shows the interest coverage was above 1.5 in 2013 and 2014, however, in 2015,
that the interest coverage decreased to 0.8 indicated the ineffective leverage in 2015.
Nyamita (13) indicated finance leverage performed well in good economic environment.
However, in the bad economic times the financial leverage has shown negative relationship to
profitability. As can be seen, even the economic environment fluctuated in the period from 2013
to 2015, the equity and debt finance ration of Minh Phu did not change flexibly with the change
of economic status. It indicates the passive action of the Company with the economic
environment.
25