Fundamentals of corporate finance brealey chapter 08 using discounted cash flow analysis make investment decision
Bạn đang xem bản rút gọn của tài liệu. Xem và tải ngay bản đầy đủ của tài liệu tại đây (297.24 KB, 27 trang )
Solutions to Chapter 8
Using Discounted Cash-Flow Analysis to Make Investment Decisions
A General Note: Many of the questions, for which solutions are provided below, require
only that the NPV or IRR or some other evaluation criterion be calculated. These
questions have not asked that you make a decision based on such criteria. In Chapter 7,
we discussed the decision rules when we use these criteria. For instance, a positive NPV
project should be accepted whereas a project with a negative NPV should be rejected.
These decision rules should generally be kept in mind while working on the solutions
below.
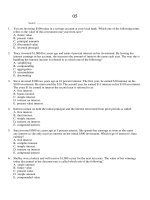
1.
Net income = ($74 42 10) .35 ($74 42 10) = $22 $7.7 = $14.3 million
Revenues cash expenses taxes paid = $74 $42 $7.7 = $24.3 million
Net Profit + Deprec = $14.3 + $10 = $24.3 million
(Revenues cash expenses) (1 T) + T Deprec
= $32 .65 + .35 $10 = $24.3 million
2.
3.
a.
NWC
= Acct Receivable + Inventory Acct Payable
= $1,500
+ $1,000
$2,000
= $2,500
b.
Cash flow = $36,000 $24,000 + $2,500 = $14,500
Net income = ($7 4 1) .40 ($7 4 1) = $2 $0.8 = $1.2 million
Revenues cash expenses taxes paid = $3 $0.8 = $2.2 million
Net Profit + Deprec = $1.2 + $1.0 = $2.2 million
(Revenues cash expenses) (1 T) + T Deprec
= $3 .60 + .40 $1 = $2.2 million
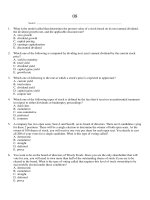
4.
While depreciation is a non-cash expense, it still has an impact on net cash flow
because of its impact on taxes. Every dollar of depreciation reduces taxable
income by one dollar, and thus reduces taxes owed by $1 times the firm’s marginal
tax rate. In Canada, such tax savings can be generated by capital cost allowance
(CCA) which, for most assets, is computed using the written-down value method.
CCA is computed for asset classes rather than for individual assets. Also, in the
81
Copyright © 2009 McGraw-Hill Ryerson Limited
first year of the asset’s life, the half-year rule becomes applicable. The various
unique features of the declining balance CCA system make it quite different from
straight-line depreciation. Compared with straight-line depreciation, declining
balance CCA will move the tax benefits in time, and thus provide a different
present value of the tax shield, thereby altering the value of the project.
5.
Gross revenues from new chip = 12 million $25 = $300 million
Cost of new chip = 12 million $8 = $96 million.
Lost sales of old chip = 7 million $20 = $140 million
Saved costs of old chip = 7 million $6 = $42 million.
Increase in cash flow = (300 – 96) – (140 – 42) = $106 million
6.
Revenue
Rental costs
Variable costs
Depreciation
Pretax profit
Taxes (35%)
Net income
$160,000
35,000
45,000
10,000
70,000
24,500
$45,500
7.
a.
Net Profit + Depreciation = $45,500 + $10,000 = $55,500
b.
Revenue – rental costs – variable costs – taxes
= $160,000 – $35,000 – $45,000 – $24,500
= $55,500
c.
(Revenue – rental costs – variable costs) (1–.35) + .35 (Depreciation)
= ($160,000 – $35,000 – $45,000) .65 + .35 $10,000
= $52,000 + $3,500 = $55,500
8.
Change in working capital = Accounts receivable – Accounts payable
= ($4500 – $1200)
– ($200 – $600)
= $3,700
Cash flow = $16,000 – $9,000 – $3,700 = $3,300
82
Copyright © 2009 McGraw-Hill Ryerson Limited
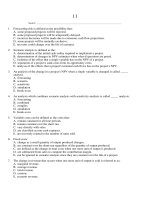
9.
Incremental cash flows are:
b.
The cash that could have been realized by selling the art.
d.
The reduction in taxes paid.
10. Capital investment: $1,000,000
CCA calculation:
Year
UCC
CCA (5%)
1
2
3
4
5
6
$1,000,000
975,000
926,250
879,937
835,940
794,143
$25,000
48,750
46,313
43,997
41,797
39,707
End of Year
UCC
$975,000
926,250
879,937
835,940
794,143
754,436
Operating cash flows of the project for the next six years (figures in thousands of
dollars).
Year:
Capital Investment
Revenues
Operating
Expenses:
Direct production
costs
Fixed maintenance
costs
Pre-tax Profits
Tax @35%
Operating Cash
Flow (excluding
CCA Tax Shield)
CCA Tax Shield
(CCA x 35%)
Total Cash Flow
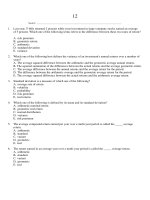
11.
a.
0
-1,000
1
2
4
5
6
120
120
120
120
120
120
40
40
40
40
40
40
15
15
15
15
15
65
22.75
65
22.75
65
22.75
65
22.75
65
22.75
15
65
22.75
-1,000
3
42.25
42.25
42.25
42.25
42.25
42.25
8.75
17.063
16.209
15.399
14.629
13.898
51.000
59.313
58.459
57.649
56.879
56.148
CCA calculation for the first 3 years:
Year
UCC
CCA (30%)
1
2
3
$40,000
34,000
23,800
$6,000
10,200
7,140
83
Copyright © 2009 McGraw-Hill Ryerson Limited
End of year
UCC
$34,000
23,800
16,660
b.
If the company has other assets in class 46 and the equipment is sold after 3
years, the adjusted cost of disposal is the sale price of $20,000. This amount
is then deducted from the UCC of asset class 46. If overall UCC remains
positive, we do not have to worry about CCA recapture. If, however, overall
UCC becomes negative, we consider CCA recapture. The firm’s after-tax
proceeds from the sale are $20,000 – PV of CCA tax shield lost - (0.35 x
amount of CCA recapture, if applicable).
c. If no other assets exist in Class 46 and the equipment is sold after 3 years, the
adjusted cost of disposal is the sale price of $20,000. Subtracting this amount
from the UCC of asset class 46 ($16,660 - $20,000 = -$3,340), we arrive at a
negative balance, and thus recaptured depreciation. This amount is now
added back to taxable income and the UCC of the asset class becomes zero.
At the time of sale, the present value of tax shields lost as a result of the sale
is calculated as:
16,660 0.30 0.35 1 0.5r
=
1 r , where r is the cost of capital.
r 0.30
The firm’s after-tax proceeds from the sale are thus $20,000 – (0.35 x 3,340)
– PV of tax shields lost = $18,831 – PV of CCA tax shields lost.
12.
a.
If the office space would have remained unused in the absence of the
proposed project, then the incremental cash outflow from allocating the
space to the project is effectively zero. The incremental cost of the space
used should be based on the cash flow given up by allocating the space to
this project rather than some other use.
b.
One reasonable approach would be to assess a cost to the space equal to the
rental income that the firm could earn if it allowed another firm to use the
space. This is the opportunity cost of the space.
13.
Cash flow = Net income + depreciation – increase in NWC
1.2 = 1.2 + .5 – NWC
NWC = $0.5 million
14.
Cash flow = profit – increase in inventory
= $10,000 – $1,000 = $9,000
84
Copyright © 2009 McGraw-Hill Ryerson Limited
15.
NWC2007 = $32 + $25 – $12 = $45 million
NWC2008 = $35 + $30 – $25 = $40 million
Net working capital has decreased by $5 million.
16.
Depreciation per year = $40/5 = $8 million
Book value of old equipment = $40 – (3 $8) = $16 million
Sales price = $18 million
After-tax cash flow = $18 – .35 ($18 – $16) = $17.3 million
17.
CCA calculation for the new capital investment (figures in thousands of dollars):
Year
UCC
CCA (25%)
1
2
3
4
5
$10,000
8,750
6,562
4,922
3,691
$1,250
2,188
1,641
1,231
923
End of year
UCC
$8,750
6,562
4,922
3,691
2,768
Since the project ends after 5 years, and the equipment is sold, the adjusted cost of
disposal is $4 million, which is deducted from the UCC asset class, that is 2.768 –
4 = -1.232 million. This results in a negative balance and recaptured depreciation.
The after-tax cash flow from the sale = $4 million – (.35 x $1.232) – PV of CCA
tax shield lost. This equals $3.569 million – PV of tax shields lost.
18. a. The UCC increases by $6,000 to the extent of the purchase of the new washer
but decreases by $2,000 to the extent of sale of the old washer. The net effect is
an UCC increase of $4,000. CCA calculations are as follows:
Year
UCC
CCA (30%)
1
2
3
4
5
6
$ 4,000
3,400
2,380
1,666
1,166
816
$ 600
1,020
714
500
350
245
85
Copyright © 2009 McGraw-Hill Ryerson Limited
End of year
UCC
$ 3,400
2,380
1,666
1,166
816
571
All dollar values should be interpreted as incremental results from making
the purchase.
First, we calculate operating cash flows excluding CCA tax shields.
Year:
Earnings from Savings (before CCA)
Tax (40%)
Cash Flow from Operations (excluding
CCA)
1–6
1,500
600
$900
Now we consider the effect of the CCA tax shield on Bottoms Up’s cash
flows.
Year:
Capital Investment
After-tax Cash Flow from
Operations (excl. CCA)
Cash Flow from Sale of Old
Equipment
Total Cash Flow (excl. CCA)
CCA Tax Shield (CCA x .4)
Total Project Cash Flow
b.
0
-6,000
1
2
3
4
5
6
0
900
900
900
900
900
900
2000
0
0
0
0
0
0
-4,000
900
900
900
900
900
0
240
408
286 200
140
-4,000 1,140 1,308 1,186 1,100 1,040
900
98
998
The project NPV is calculated in two phases. First, we compute the total
present value of cash flows excluding the CCA tax shield:
PV = -4,000 + 900 x annuity factor(15%, 6 years) = -$594.4.
Second, we calculate the present value of the CCA tax shield:
PV of CCA tax shield =
CdTc 1 0.5r SdTc
1
, where S = 0
r d 1 r d r 1 r t
4000 0.3 0.4 1 0.5 0.15
0
0.15 0.3
1 0.15
=
= $997.10
NPV = Total PV excluding CCA tax shields + PV of CCA tax shield
= -$594.40 + $997.10 = $402.7
c.
Using straight-line depreciation, net cash flow at time 0 remains -$4,000, but
the net cash flow at times 1 through 6 becomes $1,300, which is calculated
as follows:
86
Copyright © 2009 McGraw-Hill Ryerson Limited
Earnings before depreciation
Depreciation (6000/6 years)
Taxable income
Taxes (0.40)
Net Income
+ Depreciation
Operating Cash Flow
$1,500
1,000
500
200
300
1,000
$1,300
NPV = -4,000 + 1,300 x annuity factor (15%, 6 years) = $919.83
IRR = 23.21%
19.
If the firm uses straight-line depreciation, the present value of the cost of buying,
net of the annual depreciation tax shield (which equals .40 1000 = 400), is:
6000 – 400 annuity factor(15%, 6 years) = 4486.21
The equivalent annual cost, EAC, is therefore determined by:
EAC 6-year annuity factor = 4486.21
EAC 3.7845 = 4486.21
EAC = $1185.42
Note: this is the equivalent annual cost of the new washer, and does not include
any of the washer’s benefits.
20.
a. The year-wise CCA for the new grill, over its expected life, is as follows:
Year
UCC
CCA (30%)
1
2
3
$20,000
17,000
11,900
$3,000
5,100
3,570
End of year
UCC
$17,000
11,900
8,330
Operating cash flow contribution, excluding tax shields, for year 1 through 3
= Saving in energy expenses x (1 - .35) = $10,000 x (1 - .35) = $6,500. Now,
we must consider the effect of the CCA tax shield on the project’s yearly
cash flows.
Year:
Contribution from saving in
energy expenses
CCA Tax Shield (CCA x .35)
Total Operating Cash Flow
1
87
Copyright © 2009 McGraw-Hill Ryerson Limited
2
3
6,500 6,500
6,500
1,050 1,785
7,550 8,285
1,250
7,750
b.
Total Cash Flow (0-3) = Operating CF + CF associated with investments.
At time 0, the CF from the investment is -$20,000. At the end of year 3, the
grill is sold for $5,000.
Therefore, total cash flows are:
Time
0
1
2
3
c.
Cash Flows ($)
-20,000
7,550
8,285
12,750
[=7,750 + 5,000]
First, we compute present value of cash flows excluding the CCA tax shield:
PV = -20,000 + 6,500 x annuity factor(12%, 3 years) + 5,000 x discount
factor (12%, 3 years) = -$829.3.
We next calculate the present value of the CCA tax shield:
PV of CCA tax shield:
CdTc 1 0.5r SdTc
1
r d 1 r d r 1 r t
=
20000 0.3 0.35 1 0.5 0.12 5000 0.3 0.35
1
0
.
12
0
.
3
1
0
.
12
0
.
3
0
.
12
1 0.12 3
=
= $3,842.41
NPV = Total PV excluding CCA tax shields + PV of CCA tax shield
= -$829.3 + $3, 842.41 = -$3,013.11
21.
a.
Initial investment = $50,000 + $8,000 for working capital (20% of 40,000)
= $58,000
b.
CCA for the first 5 years of the plant and equipment’s life is as follows:
Year
UCC
CCA (25%)
1
2
3
4
5
$50,000
43,750
32,812
24,609
18,457
$6,250
10,938
8,203
6,152
4,614
88
Copyright © 2009 McGraw-Hill Ryerson Limited
End of year
UCC
$43,750
32,812
24,609
18,457
13,843
Year:
Sales
Expenses
= Profit before tax
-tax @ 40%
= Operating Cash Flow
(excl. CCA tax shield)
0
(In thousands of dollars)
1
2
3
4
5
40
30
20
10
0
16
12
8
4
0
24
18
12
6
0
9.6
7.2
4.8
2.4
0
14.4
10.8
7.2
3.6
0
For calculating project cash flows for each year, we will need to calculate
the tax savings generated from the CCA tax shield. We do this by multiplying
each year’s CCA by the firm’s tax rate (40% in this case).
(in thousands of dollars)
Year:
0
1
2
3
4
Decrease in working capital
from previous year
2.0
2.0
2.0
2.0
Operating Cash Flow
(excluding CCA tax shield)
14.4
10.8
7.2
3.6
16.4
12.8
9.2
5.6
2.5
4.4
3.3
2.5
18.9
17.2
12.5
8.1
Capital investment
-50.00
Initial investment in working
capital
- 8.00
Total Cash Flow
(excluding CCA tax shield)
- 58.00
CCA tax shield (CCA x 0.40)
Total
c.
- 58.00
5
The project NPV is calculated in two phases. First, we calculate the present
value from cash flows excluding the CCA tax shield:
Year:
Total Cash Flow (excluding
CCA tax shield)
x Discount Factor (10%)
PV of total cash flow (excl.
CCA tax shield)*
Total PV (excl. CCA tax
shield)
0
1
2
3
4
(58)
16.40
12.80
9.20
5.60
1.000
0.909
0.826
0.751
0.683
(58)
14.91
10.57
6.91
3.83
(21.78)
89
Copyright © 2009 McGraw-Hill Ryerson Limited
* Notice, you could also calculate this as follows, keeping in mind that there
could be some difference of result due to rounding errors.
16.4 12.8
9.2
5.6
58
2
3
1.1 (1.1)
(1.1)
(1.1) 4
We next calculate the present value of the CCA tax shield:
PV of CCA tax shield =
CdTc 1 0.5r SdTc
1
, where S = 0
r d 1 r d r 1 r t
50000 0.25 0.4 1 0.5 0.10
0
0.10 0.25
1 0.10
=
= $13,636
NPV (in thousands of dollars) = Total PV excluding CCA tax shields + PV of
CCA tax shield
= -$21.78 + $13.64 = -$8.14
22.
a.
The present value of costs from buying is
$25,000 – $5000/(1.10)5 = $21,895
The cost of leasing (assuming that lease payments come at the end of each
year) is
$5,000 annuity factor(10%, 5 years) = $18,954
Leasing is less expensive.
b.
23.
The maximum lease payment, L, would be chosen so that
L annuity factor(10%, 5 years) = $21,895
L = $5,776
The initial investment is $100,000 for the copier + $10,000 in working capital, for
a total outlay of $110,000.
Depreciation expense each year = ($100,000 $20,000)/5 = $16,000
810
Copyright © 2009 McGraw-Hill Ryerson Limited
The project saves $20,000 in annual labour costs, so its net operating cash flow
including the depreciation tax shield is:
$20,000 (1 .35) + .35 $16,000 = $18,600
In year 5, the copier is sold for $30,000, which generates net-of-tax proceeds of
$30,000 .35 $10,000 = $26,500
In addition, the working capital associated with the project is freed up, which releases
another $10,000 of cash. So non-operating cash flow in year 5 totals $36,500.
The NPV is thus
NPV = 110,000 + 18,600 annuity factor(8%, 5 years) + 36,500/(1.08)5
= 110,000 + 99,106 = $10,894
Because NPV is negative, Kinky’s should not buy the new copier.
24.
Year:
Sales revenue
Less: cost
Profit before tax
Tax (35 percent)
Cash flow from
operations
(excluding CCA) (A)
Net working capital
requirement
Investment in net
working capital
Investment in plant and
equipment
Investment cash flow (B)
Total cash flow
(excluding CCA)(A – B)
Present value of total
cash flow (excluding
CCA)
Present value (excluding
CCA)
=
0
1
33,000
19,500
13,500
4,725
2
38,500
22,750
15,750
5,513
3
44,000
26,000
18,000
6,300
4
55,000
32,500
22,500
7,875
5
55,000
32,500
22,500
7,875
8,775
10,237
11,700
14,625
14,625
6,600
7,700
8,800
11,000
11,000
0
6,600
1,100
1,100
2,200
0
-11,000
31,600
31,600
1,100
1,100
2,200
0
-11,000
7,675
9,137
9,500
14,625
25,625
31,600
7,675
(1.15)
9,137
(1.15) 2
9,500
(1.15) 3
14,625
(1.15) 4
25,625
(1.15) 5
6,674
6,909
6,246
8,362
12,740
25,000
31,600
9,331
811
Copyright © 2009 McGraw-Hill Ryerson Limited
Present value of CCA Tax Shield (PVTS), given a zero salvage value:
25,000 0.15 0.35 1 (0.5 0.15)
1 0.15
0.15 0.15
= $4,090
NPV = $9,331 + $4,090 = $13,421
25.
Find the equivalent annual cost of each alternative.
Quick and Dirty
Do-It-Right
$ 1 million
$ 1 million
$ 10 million
$ 12 million
5 years
8 years
PV CCA tax shield
$ 2.37 million
$ 2.84 million
Net Capital Cost *
$ 7.63 million
$ 9.16 million
EAC of Net Capital
Cost **
$2.12 million
$1.84 million
Operating Cost
Investment
Project Life
Computation:
PV of CCA tax shield for Quick and Dirty:
10 0.3 0.35 1 (0.5 0.12)
0.12 0.3 1 0.12
1.05 1.06
2.37
0.42 1.12
PV of CCA tax shield for Do-It Right:
12 0.3 0.35 1 (0.5 0.12)
0.12 0.3 1 0.12
1.26 1.06
2.84
0.42 1.12
812
Copyright © 2009 McGraw-Hill Ryerson Limited
EAC for Quick and Dirty:
$7.63m = Annuity (3.605)
Annuity =
7.63
$2.12 m
3.605
EAC for Do-It-Right:
$9.16m = Annuity (4.968)
Annuity =
9.16
$1.84m
4.968
Since the operating costs are the same, the project with the lower EAC is cheaper.
This is Do-It-Right.
* Investment – PV of CCA tax shield
** Annuity discounted at 12%; number of years = project life
26.
Net working capital
Investment in NWC
Investment in Plant & eq
Cash flow from
investment activity (A)
0
$220
220
200
–$420
0
Revenue
Cost
Pretax profit (excluding CCA)
– Taxes (35%)
Operating cash flow
(excluding CCA tax shield) (B)
Total CF
–$420
(excluding CCA tax shield) (A+B)
All figures in thousands of dollars
1
2
3
$300
$140
$ 50
80
0
–$ 80
–160
0
+$160
– 90
0
+$ 90
All figures in thousands of dollars
1
2
3
$880
550
330.00
115.50
$214.50
$1200
750
450.00
157.50
$292.50
$560
350
210.00
73.50
$136.50
$134.50
$452.50
$226.50
813
Copyright © 2009 McGraw-Hill Ryerson Limited
4
$0
–50
0
+$ 50
4
$200
125
75.00
26.25
$ 48.75
$98.75
Present Value of CCA Tax Shield (PVTS):
200 0.25 0.35 1 (0.5 0.20)
0.20 0.25
1 .20
17.5 1.1
$35.65
0.45 1.2
NPV (in thousands of dollars):
= PVTS + PV TOTAL CF (excluding CCA tax shield)
= 35.65 420
134.5 452.5 226.5 98.75
1.2
(1.2) 2 (1.2) 3 (1.2) 4
= 35.65 – 420 + 112.08 + 314.24 + 131.08 + 47.62
= $ 220.67
27.
All figures are on an incremental basis
Labour savings
$125,000
–Cost to run lathe
35,000
Net Savings (excluding CCA)
90,000
–Taxes (35%)
31,500
After tax savings (excluding CCA)
$58,500
PV of CCA tax shield (PVTS):
=
=
1,000,000 0.25 0.35 1 (0.5 0.10) 100,000 0.25 0.35
1
10
0.10 0.25
0.25 0.10
(1 0.10)
1 0.10
87,500 1.05 8,750
0.3855
0.35 1.10 0.35
= 238,636.36 – 9,637.50
= $ 228,998.86
NPV = – 1,000,000 + 228,998.86 + 58,500 annuity factor (10%, 10 years)
+ 100,000/(1.10)10
= -$372,987.71
814
Copyright © 2009 McGraw-Hill Ryerson Limited
28.
You can access information on CCA asset classes and rates on commonly used assets by
going to the following link on Revenue Canada’s website:
/>As of May 29, 2008 this site had a table with 17 listed asset classes. The minimum
eligible CCA rate is 4 percent and the maximum eligible rate is 100 percent. Fifteen of
the 17 asset classes have declining balance CCA rates. These include asset Class 13
(leasehold interest) and asset Class 14 (patents, franchises, concessions or licenses for a
limited period). Notice that these classes include assets for which the cost to a business
may not be a onetime initial outlay but rather a fixed recurring periodic cost over their
economic life (such as, on leasehold interests). The CCA on such items is also computed
as a fixed charge on a straight line basis.
29.
Rogers Communication and Microsoft Inc
($ million)
2007
Net capital expenditure.
Net Cap. Expd. to sales
Sales & net cap-expd. to total
assets
2006
2005
Rogers
Microsoft
Rogers
Microsoft
Rogers
3,404.788
33.2 %
88.0 %
2,143.000
4.2 %
84.3%
1,486.170
19.6 %
74.9 %
848.000
1.9 %
64.8%
1,829.708
28.5 %
69.5 %
Microsof
t
(114.000)
(.3) %
56.0 %
Note: Calculations were done as follows:
Capital expenditure = change in gross Physical Plant &Equipment (PP&E) from year to
year. For example, capital expenditure for 2007 = PP&E for 2007 minus PP&E for 2006.
Net capital expenditure (net Cap.Expd.) = capital expenditure – after tax sales of fixed
assets .
Differences in ratios between the two companies may be explained as follows:
Given the nature of the businesses of the two companies, the extent of capital
intensity for Rogers Communication is much more than Microsoft. Rogers invests
more in tangible physical assets to generate a certain dollar amount of sales than
does Microsoft. On the other hand Microsoft invests a lot on intangibles such as
Research and Development and skilled human resources. Also, during the period
under consideration, Microsoft has a commanding market presence with a large
and growing sales revenue and is much more cash rich company than Rogers
Communications. From the website, we also note that working capital investments
for Microsoft have been increasing, reflecting growth and prosperity. Relevant
information on working capital for Rogers Communication was not available.
815
Copyright © 2009 McGraw-Hill Ryerson Limited
30.
If the savings are permanent, it is worth $250,000 to the firm. It can take $250,000
out of the project now without ever having to replace it. So the most the firm
should be willing to pay is $250,000.
31. Project Evaluation
Assumptions
Plant and Equipment
Start up cost before tax
Start up cost after tax
# of years
Sales revenue year 1
Growth in sales: 1-4
Year 5
Depreciation
Operating Exp
Tax rate
Cost of capital
Sales
Operating cost
Operating cash flow before tax
Taxes
Operating cash flow (after tax)
Depreciation tax shield
Salvage value
Total Cash Flow
100,000.00
25,000.00
16,500.00
5
60,000.00
5%
-5%
20,000.00
10,000.00
34%
12%
1
2
60,000.00
63,000.00
- 10,000.00 - 10,500.00
50,000.00
52,500.00
- 17,000.00 - 17,850.00
33,000.00
34,650.00
6,800.00
6,800.00
39,800.00
41,450.00
3
66,150.00
- 11,025.00
55,125.00
- 18,742.50
36,382.50
6,800.00
4
69,457.50
- 11,576.25
57,881.25
- 19,679.63
38,201.63
6,800.00
5
65,984.63
- 10,997.44
54,987.19
- 18,695.64
36,291.54
6,800.00
43,182.50
45,001.63
43,091.55
(a)
i) Note: Cash flow at year 0 includes initial investment after tax [100,000+ (25,000 *(1-.34)]
Year
0
1
2
3
4
5
Cash flow
- 116,500.00
39,800.00
41,450.00
43,182.50
45,001.63
43,091.55
Payback Period = 2
Cumulative cash
flow
- 116,500.00
-76,700.00
-35,250.00
7,932.50
52,934.13
96,025.68
35,250.00
43,182.50
= 2.82 years
Discount Payback
Year
0
Cash flow
- 116,500.00
1
2
3
39,800.00
41,450.00
43,182.50
Discount Factor
(12%)
1.000
0.893
0.797
0.712
816
Copyright © 2009 McGraw-Hill Ryerson Limited
PV of cash flow
12 %
- 116,500.00
35,541.40
33,035.65
30,745.94
Cumulative
cash flow
- 116,500.00
- 80,958.60
- 47,922.95
-17,177.01
4
5
45,001.63
43,091.55
NPV = $35,876.93
IRR = 23.57 %
b).
28,621.03
24,432.91
11,444.02
35,876.93
17,177.01
Discounted Payback period = 3
28,621.03
= 3.6 years
0.636
0.567
35,876.93
0.31
Profitability Index =
116,500
Using NPV and IRR decision rule the project should accepted. It has a positive
NPV of $35,876.93 and an IRR of 23.57 % which is higher that the cost of capital
rate.
(c) i)
CdTc 1 0.5r SdTc
1
, where S = 0
r d 1 r d r 1 r t
100,000 0.25 0.34 1 (0.5 0.12)
1 0.12
0.12 0.25
8,500 1.06
$21,742.28
0.37 1.12
PV tax shield with zero salvage value =
NPV including CCA tax shield = $35,876.93 + $21,742.48 = $57,619.21
(ii)
Sales
Operating cost
Operating cash flow before tax
Taxes
Operating cash flow (after
tax)
Depreciation tax shield
Salvage value
Total Cash Flow
Year
0
1
2
3
Cash flow
- 116,500.00
39,800.00
41,450.00
43,182.50
1
60,000.00
- 10,000.00
50,000.00
2
63,000.00
- 10,500.00
52,500.00
4
69,457.50
- 11,576.25
57,881.25
5
65,984.63
- 10,997.44
54,987.19
- 17,850.00
3
66,150.00
- 11,025.00
55,125.00
18,742.50
- 17,000.00
- 19,679.63
- 18,695.64
33,000.00
6,800.00
34,650.00
6,800.00
36,382.50
6,800.00
38,201.63
6,800.00
39,800.00
41,450.00
43,182.50
45,001.63
36,291.55
6,800.00
10,000.00
53,091.55
Discount Factor (12%)
1.000
0.893
0.797
0.712
817
Copyright © 2009 McGraw-Hill Ryerson Limited
PV of cash flow 12 %
- 116,500.00
35,541.40
33,035.65
30,745.94
Cumulative cash
flow
- 116,500.00
- 80,958.60
-47,922.95
-17,177.01
4
5
NPV
45,001.63
53,091.55
0.636
0.567
28,621.03
30,102.91
41,546.93
PV of CCA tax shield with salvage value =
=
11,444.02
41,546.93
CdTc 1 0.5r SdTc
1
r d 1 r d r 1 r t
100,000 0.25 0.34 1 (0.5 0.12) 10,000 0.25 0.34
1
5
0.12 0.25
0.25 0.12
(1 0.12)
1 0.12
= $20,438.73
NPV including CCA tax shield = $41,546.93 + $20,438.73 = $61,985.66
32.
All cash flows are in millions of dollars. Sales price of machinery in year 5 is
shown on an after-tax basis in year 5 as a positive cash flow on the capital
investment line.
Cash flow calculations are as follows:
YEAR:
Sales (traps)
Revenue
Working capital
Change in Wk Cap
0
0.00
0.00
0.20
0.20
1
0.50
2.00
0.24
0.04
2
0.60
2.40
0.40
0.16
3
1.00
4.00
0.40
0.00
4
1.00
4.00
0.24
–0.16
5
0.60
2.40
0.00
–0.24
Revenue
Expense
Depreciation
Pretax profit
Tax
After-tax profit
CF from operations
0.00
0.00
0.00
0.00
0.00
0.00
0.00
2.0000
0.7500
1.2000
0.0500
0.0175
0.0325
1.2325
2.400
0.900
1.200
0.300
0.105
0.195
1.3950
4.000
1.500
1.200
1.300
0.455
0.845
2.0450
4.000
1.500
1.200
1.300
0.455
0.845
2.0450
2.400
0.900
1.200
0.300
0.105
0.195
1.3950
–6.00
–0.20
0.00
–6.20
–6.20
0.0000
–0.0400
1.2325
1.1925
1.0647
0.0000
–0.1600
1.3950
1.2350
0.9845
0.0000
0.0000
2.0450
2.0450
1.4556
0.0000
0.1600
2.0450
2.2050
1.4013
0.3250
0.2400
1.3950
1.9600
1.1122
Cash flow
CF: capital investments
CF from wk cap
CF from operations
Total
PV @ 12%
Net present value
33.
–0.1817
If working capital requirements were only one-half of those in the previous problem,
then the working capital cash flow forecasts would change as follows:
Year
0
1
818
Copyright © 2009 McGraw-Hill Ryerson Limited
2
3
4
5
Original forecast
–.20
Revised forecast
–.10
Change in cash flow +.10
–.04
–.02
+.02
–.16
–.08
+.08
0.0
0.0
0.0
.16
.08
–.08
.24
.12
–.12
The PV of the change in the cash flow stream at a discount rate of 12% is $.0627
million.
34.
a.
Annual depreciation is (115 15)/5 = $20 million.
Book value at the time of sale is $115 (2 $20) = $75 million
Sales price = $80 million, so net-of-tax proceeds from the sale are:
$80 (.35 $5) = $78.25 million
Therefore, the net cash outlay at time 0 is $150 $78.25 = $71.75 million
b.
The project saves $10 million in expenses, and increases sales by $25 million.
The new machine would entail depreciation of $50 million per year. Therefore,
including the depreciation tax shield, operating cash flow increases by
$35 (1 .35) + .35 $50 = $40.25 million per year
c.
NPV = 71.75 + 40.25 annuity factor(12%, 3 years) = $24.92 million.
To find IRR, set the PV of the annuity to $71.75 and solve for the discount rate
to find that IRR = 31.33%.
d.
All figures in $ millions
After-tax annual operating cash flows:
$35 × (1 – 0.35) = $ 22.75 million
PV of after-tax operating cash flows:
$35 × (1 – 0.35) × annuity factor (12%, 3) = $54.64
Net cash outlay at time 0:
$150 – $80 = $70 million
PV of net salvage value of new modem pool:
1
($30 $15)
$10.68
(1.12) 3
PV of CCA tax shield:
819
Copyright © 2009 McGraw-Hill Ryerson Limited
70 0.3 0.35 1 (0.5 0.12) 15 0.3 0.35 1
0.12 0.3 1 0.12
0.12 0.3 (1.12) 3
7.35 1.06 1.575
1
0.42 1.12 0.42 1.404928
16.56 2.67 $13.89
NPV 70 54.64 10.68 13.89 $9.21 million
35. Project evaluation
Note: 1. The 1-year feasibility study is a sunk cost and should not be considered.
2. Price/volume increase factor = (1+ inflation)*(1+ unit sales increase)
= (1.015)*(1.04)= 1.0556
For example to find sale revenue in year 2, we multiply year 1 revenue by the
price/volume factor.
T1
T2
T3
T4
T5
T6
Sales Revenue
Less:
Variable cost
Fixed cost
255,000
269,178
284,144
299,942
316,619
334,223
16,000
40,000
16,889.6
40,000
17,828.7
40,000
18,819.9
40,000
19,866.3
40,000
20,970.9
40,000
EBIT
Less: Taxes35 %
199,000
69,650
212,288.4
74,300.9
226,315.3
79,210.4
241,122.1
84,392.7
256,758.7
89,865.5
273,252.1
95,638.2
Net Income
129,350
137,987.5
147,104.9
156,729.4
166,893.2
177,613.9
Net Working Capital
T0
40,000
T1
44,000
T2
48,400
T3
53,240
T4
58,564
T5
64,420
T6
70,862
4,000
4,400
4,840
5,324
5,856
6,442
Change in NWC
Investment: Land
Building
Equipment
Net working Capital
∆ NWC
Net Income (Excluding
CCA tax shield )
Salvage Value: Building
T0
150,000
350,000
250,000
40,000
(790,000)
T1
T2
T3
T4
T5
T6
(4,000)
(4,400)
(4,840)
(5,324)
(5,856)
(6,442)
129,350
137,987.5
147,104.9
156,729.4
166,893.2
177,613.9
300,000
820
Copyright © 2009 McGraw-Hill Ryerson Limited
125,000
Equipment
Total Cash flow
(excluding CCA tax shield)
Discount Factor (12%)
PV excluding CCA tax
shield
Total PV (excluding
CCA tax shields)
T0
T1
T2
T3
T4
T5
T6
(790,000)
125,350
133,587.5
142,264.9
151,405.4
161,037.2
596,171.9
1.000
.8929
.7972
.7118
.6355
.5674
.5066
(790,000)
111,925
106,495.9
101,264.1
96,218.13
91,372.5
302,020.7
19,296.33
PV of CCA tax shield:
Building =
350,000 0.04 0.35 1 (0.5 0.12) 300,000 0.04 0.35
1
6
0.12 0.04
0.12 .04
(1 0.12)
1 0.12
=
=
4,900 1.06 4,200
0.50663
0.16 1.12 0.16
15,685.34
Manufacturing Equipment
=
250,000 0.25 0.35 1 (0.5 0.12) 125,000 0.25 0.35
1
6
1 0.12
0.12 0.25
0.25 0.12
(1 0.12)
21,875 1.06 10,937.5
0.50663
0.37 1.12 0.37
= (59,121.62 x .94643) – 14,976.39
= 40,978.08
=
NPV = 19,296.33 + 15,685.34 + 40,978.08
= $ 75,959.75
Since the project has a positive net present value we should go ahead with it.
36.
Assumptions
Plant and Equipment
Building
Number useful life (yrs)
Sales revenue year 1
Growth in sales: 1-3
Growth in sales: 4-6
160,000.00
40,000.00
8
60,000.00
0
10 %
821
Copyright © 2009 McGraw-Hill Ryerson Limited
Growth in sales: 6-8
Depreciation P&E
Building
-5%
20,000.00
5,000.00
15,000.0
0
34%
12%
Operating Exp
Tax rate
Cost of capital
1
2
Sales
Operating cost
Operating cash flow
before tax
60,000
-15,000
60,000
- 15,000
45,000
Taxes
Operating cash flow
(after tax)
Dep. tax shield: P&E
Building
Total Cash Flow
3
4
5
6
7
8
60,000
-15,000
66,000
-16,500
72,600
-18,150
79,860
-19,965
75,867
-18,967
72,074
-18,018
45,000
45,000
49,500
54,450
59,895
56,900
54,055
-15,300
- 15,300
-15,300
-16,830
-18,513
-20,364
-19,346
-18,379
29,700
6,800
1,700
38,200
29,700
6,800
1,700
38,200
29,700
6,800
1,700
38,200
32,670
6,800
1,700
41,170
35,937
6,800
1,700
44,437
39,531
6,800
1,700
48,031
37,554
6,800
1,700
46,054
35,676
6,800
1,700
44,176
(a)
Years
0
1
2
3
4
5
6
7
8
NPV
Cash flow
- 200,000.00
38,200.00
38,200.00
38,200.00
41,170.00
44,437.00
48,030.70
46,054.17
44,176.46
Discount Factor (12%)
1.00000
0.89286
0.79719
0.71178
0.63552
0.56743
0.50663
0.45235
0.40388
PV of CF (12 %)
- 200,000.00
34,107.14
30,452.81
27,190.01
26,164.28
25,214.75
24,333.85
20,832.57
17,842.13
6,137.54
Cumulative cash flow
- 200,000.00
- 165,892.86
- 135,440.05
- 108,250.04
- 82,085.76
- 56,871.01
- 32,537.16
- 11,704.59
6,137.54
Based on the positive NPV Virtual Printing should accept the finance manager’s
recommendations.
(b) The technique used in part (a) is the net present value decision rule. Accordingly,
accept projects with positive NPV because the total present value of future cash flows is
greater than the initial cost.
(c) i)
Years
0
1
2
3
4
5
6
7
8
Cash flow
- 200,000.00
38,200.00
38,200.00
38,200.00
41,170.00
44,437.00
48,030.70
46,054.17
44,176.46
Cumulative cash flow
- 200,000.00
- 161,800.00
- 123,600.00
- 85,400.00
- 44,230.00
207.00
48,237.70
94,291.87
138,468.33
822
Copyright © 2009 McGraw-Hill Ryerson Limited
Payback period = 4 + (44,203/44437) = 4.995 years
(ii)
Discounted payback = 7
11,704.59 7.66 years
17,842.13
Advantage for payback period – It is relatively easy to use.
Disadvantage for payback period – Does not take into consideration the time value of
money. This method also ignores cash flows beyond the payback period.
Advantage of discounted payback- this method considers time value of money, unlike
payback period. Also, if the projects meet the cutoff, it must have a positive NPV.
Disadvantage of discounted payback – It does not consider cash flows beyond the
payback period and therefore, it may incorrectly reject positive NPV projects. Also, it is
not easier to use than NPV rule because both projected cash flow and discount rate must
be determined.
(d) IRR = 12.84
(e)
Years
0
Cash flow
200,000.00
Discount Factor
(12%)
PV of cash flow
(12% )
Cumulative cash
flow
1.000
-
200,000.00
-
200,000.00
1
38,200.00
0.89286
34,107.14
-
165,892.86
2
38,200.00
0.79719
30,452.81
-
135,440.05
3
38,200.00
0.71178
27,190.01
-
108,250.04
4
41,170.00
0.63552
26,164.28
-
82,085.76
5
44,437.00
0.56743
25,214.75
-
56,871.01
0.50663
24,333.85
-
32,537.16
-
11,704.59
6
48,030.70
7
46,054.17
0.45235
20,832.57
8
54,176.46
0.40388
21,880.96
10,176.37
PV tax shield Building
10,176.37
CdTc 1 0.5r SdTc
1
, where S = 0
r d 1 r d r 1 r t
10,000 0.04 0.34 1 (0.5 0.12)
1 0.12
0.12 0.04
= $804.46
=
823
Copyright © 2009 McGraw-Hill Ryerson Limited
PV tax shield P&E with salvage value =
=
CdTc
r d
1
1 0.5r SdTc
1 r d r 1 r t
160,000 0.25 0.34 1 (0.5 0.12) 10,000 0.25 0.34
1
8
0.12 0.25
0.25 0.12
(1 0.12)
1 0.12
= 34,787.64 – 927.72 = $33,859.92
PV tax shield building = $804.46
Total NPV with salvage value = 33,859.92 + 804.46+ 10,176.37 = $ 44,840.75
824
Copyright © 2009 McGraw-Hill Ryerson Limited
Solution to Minicase for Chapter 8
The spreadsheet on the next page shows the cash flows associated with the project.
Lines 1 – 11 match the data given in Table 8.11 except for the substitution of CCA. Line
8, capital investment, shows the initial investment of $1.5 million in refurbishing the
plant and buying the new machinery.
When the project is shut down after 5 years, the machinery and plant will be worthless.
But they will not be fully depreciated and will continue to generate CCA tax shields
assuming that Sheetbend has other assets in the respective asset classes. The present
value of the CCA tax shields on the refurbished plant and new machinery are entered in
lines 14 and 15, respectively.
The working capital requirement is 10 percent of sales, or $300,000. This means, the
investment in working capital (line 9) initially is $300,000, but in Year 5, when the
project is shut down, the investment in working capital is recouped.
If the project goes ahead, the land cannot be sold until the end of year 5. If the land is
sold for $600,000 (as Mr. Tar assumes it can be), the taxable gain on the sale is .5 x
$590,000 = $295,000, since the land is carried on the books at $10,000. Therefore, the
cash flow from the sale of the land, net of tax at 35%, is $496750.
The net present value of the project, which accounts for the present value of the total
cash flows (Line 13) and the present value for CCA tax shield of the refurbished plant
(Line 14) and the new machinery (Line 15), at a 12% discount rate, is $683,480 (Line
16).
If the land can be sold for $1.5 million immediately, the after-tax proceeds will be
1,500,000 – .35 x .5(1,500,000 – 10,000) = 1,239,250
So it appears that immediate sale is the better option.
However, Mr. Tar may want to reconsider the estimate of the selling price of the land in
5 years. If it can be sold today for $1,500,000 and the inflation rate is 4%, then perhaps
it makes more sense to assume it can be sold in 5 years for 1,500,000 1.045 =
$1,824,979. In that case, the forecasted after-tax proceeds of the sale of the land in 5
years rises to $1,507,357, which is $1,010,607 higher than the original estimate of
$496,750; the present value of the proceeds from the sale of the land increases by
$1,010,607/1.125 = $573,445. Therefore, under this assumption, the present value of the
project increases from the original estimate of $683,480 to a new value of $1,256,925
and in this case the project is more valuable than the proceeds from selling the land
immediately. The extent to which the project is now more valuable is $1,256,925 –
$1,239,250 = $17,675.
825
Copyright © 2009 McGraw-Hill Ryerson Limited