Intermediate accounting by robles empleoch 4 answers
Bạn đang xem bản rút gọn của tài liệu. Xem và tải ngay bản đầy đủ của tài liệu tại đây (82.41 KB, 9 trang )
Chapter 4 - Inventories
CHAPTER 4
INVENTORIES
PROBLEMS
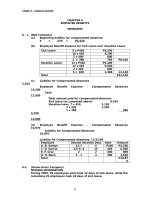
4-1
4-2
4.3
(Crossings Company)
Invoice price (150,000 x 0.80)
Freight charge
Total cost of merchandise purchase
(Orient Trading)
Reported inventory
Goods held on consignment
Mark up on goods out on consignment
Sales price
Cost (600,000÷ 1.5)
Correct inventory
P 120,000
2,500
P 122,500
P 9,500,000
( 500,000)
600,000
400,000
(Tintin Company)
Physical inventory at December 31, 2009
Merchandise in transit shipped FOB shipping point
Merchandise sold FOB destination still in transit
Correct inventory at December 31, 2009
( 200,000)
P 8,800,000
P 172,000
31,500
12,500
P 216,000
4-4
(Jane, Inc.)
Reported units on April 30, 2009
10,200
Adjustments:
No. 2 item – Purchased FOB destination
still in transit but included in purchases
( 300)
No. 4 item – Sold FOB destination still in transit but taken
as sale and excluded in inventory
500
Correct inventory quantity
10,400
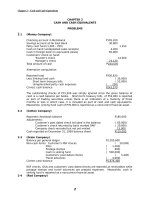
4.5
(Centerpoint, Inc.)
Reported inventory
Adjustments:
a.
Goods out on consignment
b.
Goods purchased in transit FOB shipping point
c.
Goods sold in transit FOB shipping point
included in inventory
d.
Goods sold in transit FOB destination
not included in inventory
g.
Goods sold in transit FOB destination
not included in inventory
Correct inventory
4.6
(Mega Company)
Cost of Ending
23
P 562,500
110,000
27,000
( 85,000)
26,000
P 677,500
37,000
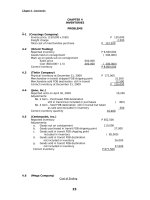
Chapter 4 - Inventories
Inventory
FIFO
Weighted
average
Moving average
Gross Profit
3,561.25
3,388.55
Cost of Goods
Sold
4,495.00
4,667.70
3,426.45
4,629.80
1,795.20
1,930.00
1,757.30
FIFO
Cost of ending inventory:
275 x 11.75
3,231.25
30 x 11.00
330.00
3,561.25
Cost of goods sold:
Cost of goods available for sale
8,056.25
Less ending inventory
3,561.25
Gross profit:
Sales
6,425.00
Less cost of goods sold
4,495.00
4,495.00
1,930.00
Weighted average
Cost of ending inventory:
Cost of goods available for sale
8,056.25
Number of units available for sale
725
Weighted average cost per unit
11.11
Units in ending inventory
305
÷
x
Cost of goods sold:
Cost of goods available for sale
8,056.25
Less ending inventory
3,388.55
Gross profit:
Sales
Less cost of goods sold
4,667.70
3,388.55
4,667.70
6,425.00
1,757.30
Moving average
Cost of ending inventory:
Inventory, January
250 x 10.50 = 2,625.00
1
Purchase, March 7
200 x 11.00 = 2,200.00
Total
450 x 10.72 = 4,825.00
Sale, May 20
(120 x 10.72 = 1,286.40)
Sale, June 30
( 55 x 10.72 = 589.60)
Balance
275 x 10.72 = 2,949.00
Purchase, July 15
275 x 11.75 = 3,231.25
24
Chapter 4 - Inventories
Total
Sale, September 17
Balance
550 x 11.24 = 6,180.25
(245 x 11.24 = 2,753.80)
305 x 11.24 =
Cost of goods sold:
Cost of goods available for sale
8,056.25
Less ending inventory
3,426.45
4.7
8,100
Gross profit:
Sales
Less cost of goods sold
4,629.80
(Landmark Enterprises)
a.
Cost of ending inventory
1/1
2,400 @ 10.75
1/5
1,900 @ 11.35
4,300 @ 11.02
1/8
2,200 @ 11.02
2,100 @ 11.01
1/24 3,800 @ 11.80
5,900 @ 11.52
1/30 3,600 @ 11.52
2,300 @ 11.52
4,629.80
6,425.00
1,795.20
25,800
21,565
47,365
24,244
23,121
44,840
67,961
41,472
26,489
b.
Cost of goods available for sale (25,800 + 21,565 + 44,840)
P92,205
Number of units available for sale (2,400 + 1,900 + 3,800)
11,38
2,300
÷
Weighted average cost per unit
P
Number of units in ending inventory
x
Cost of ending inventory
4-8
3,426.45
P26,174
(Chic Department Store)
a.
FIFO cost basis
Inventory, June 1
Purchases
Available for sale
Sales
Inventory, June 30 at retail
Cost percentage
(2,400,000/4,000,000)
Estimated cost of inventory
Cost
P 400,000
2,400,000
P2,800,000
Retail
P 750,000
4,000,000
P4,750,000
3,500,000
P1,250,000
60%
P 750,000
Cost of goods available for sale
P2,800,000
Less estimated cost of ending inventory
750,000
Estimated cost of goods sold
P2,050,000
b.
Average cost basis
Inventory, June 30 at retail
25
P1,250,000
Chapter 4 - Inventories
Cost percentage
(2,800,000/4,750,000)
Estimated cost of inventory
58.95%
P 736,875
Cost of goods available for sale
P2,800,000
Less estimated cost of ending inventory
736,875
Estimated cost of goods sold
P2,063,125
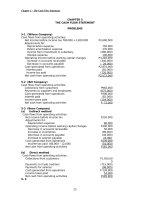
4-9
7.25
4.10
(Rockwell Club, Inc.)
Amount
Cost of sales:
Sales (160,500 x 12)
1,926,000
P1,187,400
Less gross profit
738,600
Add ending inventory
42,000 x 7.40
310,800
332,400
3,000 x 7.20
21,600
Available for sale
P1,519,800
Deduct purchases
1,150,050
Inventory, January 1
P 369,750
Average cost per unit (369,750 ÷ 51,000 units)
(DEC Company)
Merchandise inventory, January 1, 2009
450,000
Purchases for the year
3,150,000
Cost of goods available for sale
P3,600,000
Less estimated cost of goods sold (4,000,000 x 70%)
2,800,000
Estimated cost of ending inventory
Physical inventory on December 31, 2009
Estimated cost of the missing inventory
50,000
Units
160,500
45,000
205,500
154,500
51,000
P
P
P 800,000
750,000
P
4-11
Estimated cost of goods sold (705,000 – 18,000)/ 1.20
P572,500
Add Inventory at July 20, 2009
205,000
Cost of goods available for sale
P777,500
Less net purchases for the period (650,000 – 12,000 + 6,000)
644,000
Estimated cost of June 30, 2009 inventory
4-12
(Manel’s Company)
26
P133,500
Chapter 4 - Inventories
Merchandise inventory, January 1
Purchases (1,000,000 + 40,000 – 60,000)
Available for sale
Estimated cost of goods sold (3,200,000 x 70%)
Estimated ending inventory
Less goods undamaged located in showroom (200,000 +
80,000)
Estimated cost of merchandise destroyed by the flood
4-13
(Old Rose Company)
Inventory, January 1, 2009
Purchases
Freight in
Cost of goods available for sale
P1,820,000
Estimated cost of goods sold (2,200,000 – 50,000) x 70%
Estimated cost of ending inventory
Inventory per actual count
Shortage in inventory
155,000
4-14
4.15
(Blazing Red Company)
Inventory, January 1, 2009
Purchases:
Payments to suppliers
Accounts Payable, 8/28/07
Accounts Payable, 1/1/06
Cost of goods available for sale
P2,664,240
Estimated cost of goods sold:
Collections from customers
Accounts Receivable, 8/28/07
Accounts Receivable, 1/1/07
Sales
Cost percentage
Estimated cost of ending inventory
Less undamaged goods:
Goods out on consignment
Goods in transit
Estimated inventory fire loss
(London Company
Beginning Inventory
Purchases
Markups
Markdowns
Total
Sales Revenue
Ending Inventory, at retail
Cost to retail ratio:
160,000
220,000+20,00040,000
Ending Inventory, at estimated cost
27
P2,000,000
980,000
P2,980,000
2,240,000
P 740,000
280,000
P 460,000
P1,000,000
800,000
20,000
1,505,000
P 315,000
160,000
P
P 575,400
P1,950,000
491,400
( 352,560)
2,088,840
P3,015,200
515,560
( 522,360)
P3,008,400
70%
2,105,880
P 558,360
P 195,000
69,500
264,500
P 293,860
Retail
P 60,000
220,000
20,000
(40,000)
P260,000
(80,000)
P80,000
80%
P64,000
Chapter 4 - Inventories
4-16
(Alemars Drygoods, Inc.)
Retail
P1,050,00
0
735,000
80,000
( 15,000)
(105,000)
P1,745,00
0
(1,050,000
)
P 695,000
665,000
P 30,000
Beginning Inventory
Purchases
Markups (1,600 x 50)
Markup cancellations (300 x 50)
Markdowns
Total
Sales Revenue
Ending Inventory, at retail
Physical inventory on January 31, 2009
Inventory shortage at retail value
4-17
(Uniwide Sales)
Beginning Inventory
Purchases
Purchase Allowance
Freight In
Departmental Transfers In
Additional Markups
Markup Cancellations
Markdowns (6,000 – 4,500)
Total
Sales
Inventory Shortage
Ending Inventory, at retail
Cost to retail ratio (523,380/671,000)
Ending Inventory, at estimated cost
4-18
Cost
P184,000
339,380
( 11,000)
9,000
2,000
_________
P523,380
Retail
P202,000
458,000
3,000
12,000
( 2,500)
(1,500)
P671,000
(374,000)
( 7,000)
P290,000
78%
P226,200
(City Company)
Cost (under FIFO basis)
P26,000
Net realizable value (40,000 – 12,000)
P28,000
Lower of cost and net realizable value
P26,000
4-19
(Purple Company)
Cost
Net realizable value (204,000 – 10,000)
194,000
Loss
4-20 (Powder Blue Company)
Inventory, January 1
Purchases during the year
Cost of goods available for sale
P8,000,000
Less Inventory, December 31
1,200,000
Cost of goods sold
28
P200,000
6,000
P1,400,000
6,600,000
P6,800,000
Chapter 4 - Inventories
4-21
(Rustan’s Trading)
Product
A
B
C
D
Total
4-22
Cost
102
45
24
9
NRV
105
42
22
10
Lower
102
42
22
9
Quantity
4,000
6,000
5,500
7,200
Amount
P408,000
252,000
121,000
64,800
P845,800
(Sta. Lucia Company)
Reported net income under average
method
Difference in inventory using FIFO
Beginning inventory
Ending inventory
96,000
40,00
0
P3,640,00
0
Net income under FIFO basis
4-23
2005
P3,600,00
0
(
2008
P5,000,00
0
2009
P7,000,000
40,000
)
120,000
(120,000)
P5,080,00
0
P7,530,000
650,000
(Grand Central, Inc.)
Net income reported for 2009
P658,000
Adjustments:
Overstatement of beginning inventory
Understatement of ending inventory
71,000
Cash advance for future manufacture and delivery of goods
credited to sales revenue
(60,000)
Correct net income for 2009
P765,000
MULTIPLE CHOICE QUESTIONS
Theory
MC1
d
MC6
c
MC2
a
MC7
a
MC1
1
MC1
29
a
c
MC1
6
MC1
d
c
Chapter 4 - Inventories
MC3
d
MC8
d
MC4
a
MC9
d
MC5
a
MC1
0
a
2
MC1
3
MC1
4
MC1
5
a
d
d
7
MC1
8
MC1
9
MC2
0
d
d
a
MULTIPLE CHOICE QUESTIONS
Problems
MC21
MC22
MC23
MC24
MC25
d
d
b
a
b
90,000 x .80 x ..90 = 64,800; 64,800 + 5,000 = 69,800
1,500,000 + 50,000 = 1,550,000
150,000 x .85 x .90 x .95 = 109,012.50
109,012.50 x .98 = 106,832.25
(b) 450,000 ÷ 1.5 = 300,000; (d) 600,000 + 60,000 = 660,000
(e)
300,000 ÷ 1.5 = 200,000 + 30,000 = 230,000
3,000,000 + 300,000 + 660,000 + 230,000) = 4,190,000
MC26
MC27
MC28
a
a
b
MC29
MC30
c
c
MC31
b
MC32
MC33
c
c
MC34
MC35
b
c
MC36
a
MC37
c
5,000,000 + 80,000 + 800,000 – 25,000 = 5,855,000
77,500 + 6,000 = 83,500
3,280,000 + 900,000– 80,000 = 4,100,000 x 3% =123,000; 123,000–
27,000=96,000
550,000 + 90,000 + 380,000 + 450,000 + (150,000 x .80) = 1,590,000
104,000 ÷ 1.3 = 80,000; 80,000 x .30 = 24,000
24,000 + 56,000 + (32,500 – 25,000) = 87,500
(3,000 x 35) + (2,000 x 36) + (1,000 x 37) = 214,000 Sales
(4,000 x 25) + (2,000 x 26) = 152,000 Cost of goods sold
214,000 – 152,000 = 62,000
(1,600 x 8) + (4,800 x 9.60) = 58,880; 58,880 ÷ 6,400 = 9.20
400,000 + 1,280,000 –740,000 = 940,000 Direct materials used
940,000 + 960,000 + (50%x 906,000) = 2,380,000 Total mfg. Cost
4,000,000 x 75% = 3,000,000 Cost of goods sold
3,000,000 + 1,310,000 – 1,500,000 = 2,810,000 Cost of goods avail for
sale
2,380,000 + 1,100,000 – 2,810,000 = 670,000
600,000 + 1,500,000 – (2,240,000 ÷ 1.4) = 500,000
2,550,000 + 250,000 – 300,000 = 2,500,000 Purchases
2,800,000 + 900,000 – 700,000 = 3,000,000 Sales
3,000,000 ÷ 1.25 = 2,400,000 Cost of goods sold
180,000 + 2,500,000 – 2,400,000 = 280,000; 280,000 – 110,000
=170,000 shortage
1,040,000 + 1,550,000 = 2,590,000; 1,700,000 + 2,000,000 =
3,700,000
2,590,000 ÷ 3,700,000 = 70%
520,000 + 2,180,000 – (2,500,000 x 70%) = 950,000
950,000 – (70% x 150,000) – 95,000 = 750,000
617,000 + 1,281,000 – 21,000 + 31,000 = 1,908,000 Avail for sale at
cost
1,057,000 + 2,158,000 – 35,000 = 3,180,000 Avail for sale at retail
1,908,000 ÷ 3,180,000 = 60% Cost to retail ratio
3,180,000 – 2,365,000 + 62,000 = 877,000; 877,000 – 780,000 = 97,000
97,000 x 60% = 58,200
30
Chapter 4 - Inventories
MC38
d
MC39
d
MC40
a
MC41
MC42
a
b
408,8976 ÷ 524,200 = 78%; 450,200 – 5,100 = 445,100; 445,100 x 78%
= 347,178
105,650 + (378,245 – 10,295) = 473,600; 473,600 - 347,178 =126,422
126,422 – 69,738 – 5,000 = 51,684
47,075 + 213,327 + 3,400 = 263,802 Avail for sale at cost
70,025 + 306,375 = 18,900 – 7,800 – 10,640 = 376,860 Avail for sale at
retail
263,802 ÷ 376,860 = 70%; 320,500 x 70% = 224,350
376,860 – 320,500 = 56,360; 56,360 – 39,390 = 16,970; 16,970 x 70%
= 11,879
Repeated problem. Please see Problem 4-15.
Confidence: cost 22; NRV = 30 – 3 = 27; lower is 22
Positive attitude: cost 55; NRV = 80 – 28 = 52; lower is 52
31