Test bank managerial accounting by kieso weygandt 5e ch006
Bạn đang xem bản rút gọn của tài liệu. Xem và tải ngay bản đầy đủ của tài liệu tại đây (779.29 KB, 26 trang )
CHAPTER 6
Cost-Volume-Profit Analysis: Additional Issues
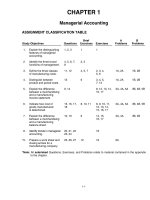
ASSIGNMENT CLASSIFICATION TABLE
Study Objectives
Questions
Brief
Exercises
Exercises
A
Problems
B
Problems
1A, 2A
1B, 2B
1.
Describe the essential features
of a cost-volume-profit income
statement.
1, 2, 3, 4
1, 2, 3, 4,
5, 6
2.
Apply basic CVP concepts.
2, 4, 5, 6
1, 2, 3, 4,
5, 6
1, 2, 3,
4, 5
1A, 2A, 4A
1B, 2B,
4B
3.
Explain the term sales mix and
its effects on break-even sales.
7, 8, 9
7, 8, 9, 10
6, 7, 8,
9, 10
4A
4B
4.
Determine sales mix when a
company has limited resources.
10, 11
11, 15
11, 12, 13
3A
3B
5.
Understand how operating
leverage affects profitability.
12, 13, 14,
15, 16
12, 13, 14
14, 15, 16
5A
5B
*6. Explain the difference between
absorption costing and variable
costing.
17
16, 17, 18
17, 18, 19
6A, 7A
6B, 7B
*7
Discuss net income effects
under absorption costing
versus variable costing.
19, 20, 21,
22
19
18
6A, 7A
6B, 7B
*8
Discuss the merits of absorption
versus variable costing for
management decision making.
18
7A
7B
*Note: All asterisked Questions, Exercises, and Problems relate to material contained in the appendix
to the chapter.
6-1
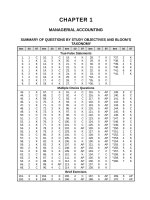
ASSIGNMENT CHARACTERISTICS TABLE
Problem
Number
Description
Difficulty
Level
Time
Allotted (min.)
1A
Compute break-even point under alternative courses of
action.
Moderate
20–30
2A
Compute break-even point and margin of safety ratio, and
prepare a CVP income statement before and after changes
in business environment.
Moderate
20–30
3A
Determine sales mix with limited resources.
Simple
10–15
4A
Determine break-even sales under alternative sales
strategies and evaluate results.
Moderate
20–30
5A
Compute degree of operating leverage and evaluate
impact of operating leverage on financial results.
Moderate
20–30
*6A
Prepare income statements under absorption costing and
variable costing for a company with beginning inventory,
and reconcile differences.
Moderate
20–30
*7A
Prepare absorption and variable costing income statements
and reconcile differences between absorption and variable
costing income statements when sales level and production
level change. Discuss relative usefulness of absorption
costing versus variable costing.
Moderate
20–30
1B
Compute break-even point under alternative courses of
action.
Moderate
20–30
2B
Compute break-even point and margin of safety ratio, and
prepare a CVP income statement before and after changes
in business environment.
Moderate
20–30
3B
Determine sales mix with limited resources.
Simple
10–15
4B
Determine break-even sales under alternative sales
strategies and evaluate results.
Moderate
20–30
5B
Compute degree of operating leverage and evaluate
impact of operating leverage on financial results.
Moderate
20–30
*6B
Prepare income statements under absorption costing and
variable costing for a company with beginning inventory,
and reconcile differences.
Moderate
20–30
*7B
Prepare absorption and variable costing income statements
and reconcile differences between absorption and variable
costing income statements when sales level and production
level change. Discuss relative usefulness of absorption
costing versus variable costing.
Moderate
20–30
6-2
6-3
Determine sales mix when a
Q6-11
company has limited resources.
Understand how operating
leverage affects profitability.
Explain the difference between
absorption costing and
variable costing.
Discuss net income effects
under absorption costing
versus variable costing.
Discuss the merits of
absorption versus variable
costing for management
decision making.
*4.
*5.
**6.
*7.
**8.
Broadening Your Perspective
Explain the term sales mix and
its effects on break-even sales.
*3.
Q6-12
Q6-13
Q6-15
Q6-7
Q6-8
Apply basic CVP concepts.
*2.
Q6-1
Q6-3
Describe the essential features
of a cost-volume-profit income
statement.
E6-6
E6-7
E6-8
E6-9
E6-2
E6-3
E6-4
E6-5
P6-1A
P6-2A
BE6-1
P6-1A
P6-2A
P6-4A
P6-1B
P6-2B
P6-4A
P6-1B
P6-2B
P6-4B
P6-3B E6-11
E6-12
E6-13
E6-10 E6-6
P6-4A E6-7
P6-4B E6-8
P6-4A
BE6-1
P6-1A
P6-2A
P6-1B
P6-2B
P6-1A
P6-2A
P6-1B
P6-2B
E6-18 P6-6B E6-18
E6-19 P6-7B E6-19
P6-6A
P6-6A
P6-7A
P6-7B
P6-7A
P6-6B
P6-7B
Synthesis
Evaluation
Decision Making All About Managerial Analysis
Across the
You
Ethics Case
Organization
P6-7A
P6-7B
Q6-19 P6-6A P6-7B P6-6A
BE6-19 P6-7A
P6-7A
E6-18 P6-6B
P6-6B
BE6-16
BE6-17
BE6-18
E6-17
P6-5A
P6-5B
P6-3A
P6-3B
P6-4B
P6-4B
Analysis
Q6-16 BE6-14 E6-16 E6-14
BE6-12 E6-14 P6-5A E6-15
BE6-13 E6-15 P6-5B E6-16
BE6-11 E6-12
BE6-15 E6-13
E6-11 P6-3A
BE6-7
BE6-8
BE6-9
BE6-10
BE6-2
BE6-3
BE6-4
BE6-5
BE6-6
E6-1
BE6-2
BE6-3
BE6-4
BE6-5
BE6-6
Application
Communication Real-World Focus
Exploring the Web
Q6-18
Q6-19 Q6-22
Q6-20
Q6-21
Q6-17
Q6-14
Q6-10
Q6-8
Q6-9
Q6-2
Q6-4
Q6-5
Q6-6
Q6-2
Q6-4
Knowledge Comprehension
*1.
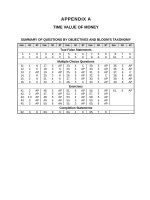
Study Objective
Correlation Chart between Bloom’s Taxonomy, Study Objectives and End-of-Chapter Exercises and Problems
BLOOM’S TAXONOMY TABLE
STUDY OBJECTIVES
1. DESCRIBE THE ESSENTIAL FEATURES OF A COSTVOLUME-PROFIT INCOME STATEMENT.
2. APPLY BASIC CVP CONCEPTS.
3. EXPLAIN THE TERM SALES MIX AND ITS EFFECTS
ON BREAK-EVEN SALES.
4. DETERMINE SALES MIX WHEN A COMPANY HAS
LIMITED RESOURCES.
5. UNDERSTAND HOW OPERATING LEVERAGE
AFFECTS PROFITABILITY.
*6. EXPLAIN THE DIFFERENCE BETWEEN ABSORPTION
COSTING AND VARIABLE COSTING.
*7. DISCUSS NET INCOME EFFECTS UNDER ABSORPTION
COSTING VERSUS VARIABLE COSTING.
*8. DISCUSS THE MERITS OF ABSORPTION VERSUS
VARIABLE COSTING FOR MANAGEMENT DECISION
MAKING.
6-4
CHAPTER REVIEW
Cost-Volume-Profit Income Statement
1.
(S.O. 1) The Cost-Volume-Profit (CVP) income statement classifies costs as variable or fixed
and computes a contribution margin. Contribution margin is the amount of revenue remaining
after deducting variable costs. It is often stated both as a total amount and on a per unit basis.
Desossa Music Player Company
CVP Income Statement
For the Month Ended June 30, 2009
Sales
Variable expenses
Cost of goods sold
Selling expenses
Administrative expenses
Total variable expenses
Contribution margin
Fixed expenses
Cost of goods sold
Selling expenses
Administrative expenses
Total fixed expenses
Net income
Total
$420,000
Per Unit
$120
245,000
175,000
70
$ 50
$200,000
35,000
10,000
50,000
25,000
19,500
94,500
$ 80,500
Basic Computations
2.
3.
(S.O. 2) Desossa Music Players’ CVP income statement shows that total contribution margin
(sales minus variable expenses) is $175,000, and the company’s contribution margin per unit is
$50. The contribution margin ratio (contribution margin divided by sales) is 41.67% ($50 ÷
$120). Desossas’ break-even point in units (using contribution margin per unit) or in dollars (using
contribution margin ratio) are calculated as follows:
Fixed cost
$94,500
÷
÷
Contribution margin per unit
$50
=
=
Break even point in units
1,890 units
Fixed cost
$94,500
÷
÷
Contribution margin ratio
.4167
=
=
Break even point in dollars
$226,800
Assuming Desossa’s management has a target net income of $100,000, the required sales in
units and dollars to achieve its target net income are calculated as follows:
(Fixed cost + Target net income) ÷ Contribution margin per unit
($94,500 + $100,000)
÷
$50
=
=
Required sales in units
3,890 units
(Fixed cost + Target net income) ÷
($94,500 + $100,000)
÷
=
=
Required sales in dollars
$466,762
Contribution margin ratio
.4167
6-5
4.
Desossas’ margin of safety in dollars or as a ratio are calculated as follows:
Actual (expected) sales
$420,000
–
–
Break-even sales
$226,800
= Margin of safety in dollars
=
$193,200
Margin of safety in dollars ÷ Actual (expected) sales =
$193,200
÷
$420,000
=
Margin of safety ratio
46%
CVP and Changes in the Business Environment
5.
To better understand how CVP analysis works, let’s assume that shipping costs have increased
significantly causing the unit variable cost to increase by 10%, what effect will this have on
Desossas’ break-even point?
Answer: A 10% increase in variable costs increases the per unit variable cost to $77 [$70 + ($70 X
10%)]. The new contribution margin per unit is therefore $43 ($120 – $77). Thus the new break
even point in units is calculated as follows:
Fixed cost
$94,500
÷
÷
Contribution margin per unit
$43
=
=
Break even point in units
2,198 units
Sales Mix
6.
(S.O. 3) Sales mix is the relative percentage in which a company sells its multiple products. For
example, if 60% of product A is sold for every 40% of product B, the sales mix of the product is
60% to 40%.
7.
Break-even sales can be computed for a mix of two or more products by determining the
weighted average unit contribution margin of all the products. Assume that Seth Inc. sells
tables and chairs in a ratio of four chairs for every one table. The sales mix in percentages is 20%
(1/5) for tables and 80% (4/5) for chairs. The following is the per unit data for Seth Inc.:
Unit Data
Selling price
Variable costs
Contribution margin
Sales mix-units
Fixed costs = $192,000
Tables
$100
60
$ 40
20%
Chairs
$20
10
$10
80%
To compute break-even for Seth Inc., we use the weighted average contribution margin as
follows:
Tables
Chairs
Sales
Sales
Unit
Unit
Contribution X Mix
+ Contribution X Mix
=
Margin
Percentage Margiin
Percentage
($40
X
.20)
+
($10
X
.80)
6-6
=
Weighted – Average
Unit Contribution
Margin
$16
Fixed Costs
÷
$192,000
÷
Weighted – Average
Unit
Contribution Margin
$16
=
12,000 units
To break even, Seth must sell 2,400 (12,000 X 20%) tables and 9.600 (12,000 X 80%) chairs.
8.
At any level of units sold, net income will be greater if more high contribution margin units are sold
than low contribution margin units. An analysis of these relationships generally shows that a shift
from low-margin sales to high margin sales may increase net income, even though there is a
decline in total units sold.
9.
The formula for computing the break-even point in dollars is fixed costs divided by the weightedaverage contribution margin ratio. To compute a company’s weighted-average contribution ratio,
multiply each division’s contribution margin ratio by its percentage of total sales and then sum
these amounts.
Seth Inc’s contribution margin ratio for sales of tables is .40 ($40/$100) and for chairs is .50
($10/$20). The weighted-average contribution margin ratio is calculated as follows:
Tables
Chairs
Contribution Sales Mix
MarginRatio X Percentage
(.40
X
.20)
Weighted - Average
Contribution Sales Mix
+
=
X
atio
MarginRatio Percentage ContributionMarginRa
+
(.50
X
.80)
=
.48
The break-even point in dollars is calculated as follows:
Fixed costs
÷
$192,000
÷
Weighted – Average
ContributionMarginRa
atio
.48
=
=
Break - even point
inDollars
$400,000
Sales Mix with Limited Resources
10.
(S.O. 4) When a company has limited resources (e.g., floor space, raw materials, direct labor
hours), management must decide which products to make and sell in order to maximize net
income. Assume that Seth Inc. has limited machine capacity which is 2,600 hours per month.
Relevant data consist of the following:
Contribution margin per unit
Machine hours required per unit
Tables
$40
.8
Chairs
$10
.16
The contribution margin per unit of limited resource is calculated as follows:
Contribution margin per unit (a)
Machine hours required (b)
Contribution margin per unit of
limited resource [(a) ÷ (b)]
Tables
$40
.8
Chairs
$10
.16
$50
$62.50
6-7
If Seth Inc. increases machine capacity hours by 400 hours per month, it would be better to use
the hours to produce more chairs.
Machine hours (a)
Contribution margin per unit of
limited resource (b)
Contribution margin [(a) X (b)]
Tables
400
Chairs
400
$
50
$20,000
$ 62.50
$25,000
Cost Structure and Operating Leverage
11. (S.O. 5) Cost structure refers to the relative proportion of fixed versus variable costs that a
company incurs. In most cases, increased reliance on fixed costs increases a company’s risk.
When sales are increasing, profits can increase at a high rate, but when sales decline, losses can
also increase at a high rate. Companies can change their cost structure by using more
sophisticated robotic equipment and reducing it later, or vice versa. The equipment would
increase the fixed costs whereas labor increases variable costs.
Variable Costing vs. Absorption Costing
*12. (S.O. 6) There are two approaches to product costing.
a. Under full or absorption costing all manufacturing costs are charged to the product. This is
also the approach required under generally accepted accounting principles.
b. Under variable costing only direct materials, direct labor, and variable manufacturing overhead
costs are treated as product costs; fixed manufacturing overhead costs are recognized as
period costs (expenses) when incurred.
*13. The primary difference between variable and absorption costing is that under variable costing the
fixed manufacturing overhead is charged as an expense in the current period. The result is that
absorption costing will show a higher net income number than variable costing whenever units
produced exceed units sold. The reason: the cost of the ending inventory is higher under
absorption costing than under variable costing.
*14. Assume Thibodeau Company manufactures candy bars and has the following information:
Volume Information
Candy bars in beginning inventory
Candy bars produced
Candy bars sold
2008
20,000
40,000
30,000
Financial Information
Selling price per candy bar
Variable manufacturing cost per candy bar
Fixed manufacturing cost per year
Fixed manufacturing cost per candy bar
Variable selling and administrative expense per candy bar
Fixed selling and administrative expense
6-8
$1.00
$ .40
$12,000
$ .30
$ .05
$ 4,000
The absorption costing income statement and variable costing income statement are shown
below:
Thibodeau Company
Income Statement
For the Year Ended 2008
Absorption Costing
Sales (30,000 X $1.00) ...........................................................................
Cost of goods sold [30,000 X ($.40 + $.30)] .......................................
Gross profit ................................................................................................
Variable selling and administrative expenses (30,000 X $.05) .......
Fixed selling and administrative expenses .........................................
Net income ................................................................................................
$30,000
21,000
9,000
$1,500
4,000
5,500
$ 3,500
Thibodeau Company
Income Statement
For the Year Ended 2008
Variable Costing
Sales (30,000 X $1.00) ...........................................................................
Variable costs of good sold (30,000 X $.40).......................................
Variable selling and administrative expenses (30,000 X $.05) .......
Contribution margin .................................................................................
Fixed manufacturing overhead..............................................................
Fixed selling and administrative expense............................................
Net income ...............................................................................................
$30,000
$12,000
1,500
12,000
4,000
13,500
16,500
16,000
$ 500
*15. (S.O. 7) The effects of the alternative costing methods on income from operations are:
Effects on Income
Circumstance
From Operations
Units produced exceed units sold
Income under absorption
costing is higher than under
variable costing
Units produced are less than units sold
Income under absorption costing
Is lower than under variable costing
Units produced equal units sold
Income will be equal under both approaches
*16. (S.O. 8) One of the problems with absorption costing is that management may be tempted to
overproduce in a given period in order to increase net income. Therefore, to avoid this
overproduction, variable costing is often used internally to evaluate management decision-making.
6-9
*17. The following are potential advantages of variable costing:
a. Net income computed under variable costing is unaffected by changes in production levels.
b. The use of variable costing is consistent with cost-volume-profit and incremental analysis.
c. Net income computed under variable costing is closely tied to changes in sales levels giving a
more realistic assessment of a company’s success or failure.
d. The presentation of fixed and variable cost components on the face of the variable costing
income statement makes it easier to identify these costs and understand their effect on the
business.
6-10
LECTURE OUTLINE
A.
Cost-Volume-Profit (CVP) Review.
1. Because CVP analysis is important for decision making, management
often wants this information reported in a CVP income statement format
for internal use.
2. The CVP income statement classifies costs and expenses as variable or
fixed. It also reports contribution margin in the body of the statement.
TEACHING TIP
ILLUSTRATION 6-1 presents the basic format for a CVP income statement.
Point out to students that this format is frequently used internally by management
because it facilitates CVP analysis.
3. Contribution margin is the amount of revenue remaining after deducting
variable costs, and is stated as both a total amount and on a per unit
basis.
B.
Sales Mix
1. When a company sells many products, it is important that it understands
its sales mix.
2. Sales mix is the relative proportion in which each product is sold when a
company sells more than one product. It is important to managers
because different products often have substantially different contribution
margins and break-even points.
3. Break-even sales in units can be computed for a mix of two or more
products by determining the weighted-average unit contribution margin
of all the products.
6-11
a.
The break-even point in units is computed by dividing fixed costs by
the weighted-average unit contribution margin.
b.
The weighted-average unit contribution margin is computed by
adding the products of Product A’s unit contribution margin X its
percentage of sales and Product B’s unit contribution margin X its
percentage of sales.
TEACHING TIP
ILLUSTRATION 6-2 provides formulas for computing the break-even point in
units and dollars, and for the weighted-average unit contribution margin and
contribution margin ratio.
Also available as teaching transparency.
c.
At any level of units sold, net income will be greater if higher
contribution margin units are sold than lower contribution margin
units.
d.
A shift from low-margin sales to high-margin sales may increase
net income even though there may be a decline in total units sold.
Conversely, a shift from high- to low-margin sales may result in a
decrease in net income, even though there may be an increase in
total units sold.
4. The calculation of the break-even point in units works well if a company
has only a small number of products. In a company with many products,
break-even sales in dollars is calculated using the weighted-average
contribution margin ratio.
a.
The break-even point in dollars is computed by dividing fixed costs
by the weighted-average contribution margin ratio.
b.
The weighted-average contribution margin ratio is computed by
adding the products of Division A’s contribution margin ratio X its
percentage of sales and Division B’s contribution margin ratio X its
percentage of sales.
6-12
c.
C.
If a higher percentage of a company’s sales come from the division
with a higher contribution margin ratio, the weighted-average
contribution margin ratio would increase, which would lower the
break-even point in dollars.
Limited resources.
1. When a company has limited resources (i.e. machine hours), it is
necessary to find the contribution margin per unit of limited resource.
2. Contribution margin per unit of limited resource is computed by dividing
the contribution margin/unit of each product by the number of units of
limited resource/required for each product.
3. The contribution margin per unit of limited resource is then multiplied by
the units of limited resource to determine total contribution margin and
which product maximizes net income.
4. As discussed in Chapter 1, evaluating constraints is called the theory of
constraints. According to this theory, companies must continually identify
their constraints and find ways to reduce or eliminate them.
D.
Cost Structure and Operating Leverage.
1. Cost structure is the relative proportion of fixed versus variable costs
that a company incurs.
2. Cost structure can have a significant effect on profitability.
3. Operating leverage is the degree to which a company’s net income
reacts to a change in sales.
4. Operating leverage is determined by a company’s relative use of fixed
versus variable costs.
a.
Companies with high fixed costs relative to variable costs have high
operating leverage.
6-13
b.
When a company’s sales revenue is increasing, high operating
leverage is good because it means that profits will increase rapidly.
However, when sales are declining, too much operating leverage
can have devastating consequences.
5. The degree of operating leverage provides a measure of a company’s
earnings volatility and can be used to compare companies. Degree of
operating leverage is computed by dividing total contribution margin by
net income.
TEACHING TIP
ILLUSTRATION 6-3 provides the formula for computing the degree of operating
leverage. Emphasize that companies with high fixed costs have high operating
leverage.
6. A cost structure that relies on higher fixed costs, and consequently has
higher operating leverage, is not necessarily bad. Operating leverage
can add considerably to a company’s profitability when used carefully.
*E. Absorption Costing Versus Variable Costing.
1. Under absorption costing, all manufacturing costs are charged to, or
absorbed by, the product. This approach is used for external reporting
under generally accepted accounting principles.
2. Under variable costing, only variable manufacturing costs (direct materials, direct labor, and variable manufacturing overhead costs) are
considered product costs.
3. Companies recognize fixed manufacturing overhead costs as period
costs (expenses) when incurred under variable costing.
4. Selling and administrative expenses are period costs under both
absorption and variable costing.
6-14
5. Companies use the cost-volume-profit format in preparing a variable
costing income statement.
6. The one primary difference between variable and absorption costing is
that under variable costing companies charge fixed manufacturing
overhead as an expense in the current period, instead of being deferred
to a future period through the ending inventory as under absorption
costing.
7. Absorption costing will show a higher net income than variable costing
whenever units produced exceed units sold since fixed overhead costs
are deferred to a future period as part of the ending inventory cost.
8. When units produced and sold are the same, net income will be equal
under the two costing approaches because there is no increase in
ending inventory, and therefore no deferral of fixed overhead costs to
future periods through the ending inventory.
9. When units produced are less than units sold, net income under absorption costing is less than net income under variable costing because fixed
manufacturing overhead cost in beginning inventory is charged to the
current year income under absorption costing.
TEACHING TIP
ILLUSTRATION 6-4 shows the relationship between production and sales and
its effect on net income under absorption costing and variable costing.
Also available as teaching transparency.
*F. Decision-Making Concerns.
1. For external reporting purposes, companies must report financial information using GAAP, which requires that absorption costing be used for
the costing of inventory.
6-15
2. Some companies have recognized that net income calculated using
GAAP does not highlight differences between variable and fixed costs
and may lead to poor business decisions. Therefore, some companies
use variable costing for internal reporting purposes.
3. When production exceeds sales, absorption costing reports a higher net
income than variable costing because some fixed manufacturing costs
are not expensed in the current period, but are deferred to future periods
as part of inventory.
4. Management may be tempted to overproduce in a given period in order
to increase net income, but this decision may not be in the company’s
best interest since the buildup of inventories will lead to additional costs
to the company in the long run.
5. Variable costing avoids the temptation to overproduce because net
income under this approach is not affected by changes in production
levels.
*G. Potential Advantages of Variable Costing.
1. Variable costing has several potential advantages relative to absorption
costing:
a.
Net income computed under variable costing is unaffected by
changes in production levels.
b.
The use of variable costing is consistent with cost-volume-profit
analysis and incremental analysis.
c.
Net income computed under variable costing is closely tied to
changes in sales, and provides a more realistic assessment of the
company’s success or failure.
6-16
d.
The presentation of fixed and variable cost components on the
variable costing income statement makes it easier to identify these
costs and understand their effect on the company’s results.
TEACHING TIP
ILLUSTRATION 6-5 provides a listing of the potential advantages of variable
costing.
6-17
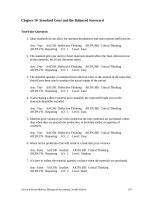
20 MINUTE QUIZ
Circle the correct answer.
True/False
1. The CVP income statement classifies costs as variable or fixed and computes a
contribution margin.
True
False
2. The margin of safety indicates how much sales must increase before a company will be
operating at a profit.
True
False
3. Sales mix is the relative percentage in which each product is sold when a company sells
more than one product.
True
False
4. The break-even point in dollars is computed by dividing fixed costs by the weightedaverage contribution margin.
True
False
5. When a company has limited resources, management must decide which product to
make and sell in order to maximize contribution margin ratio.
True
False
6. Contribution margin per unit of limited resource is obtained by dividing the contribution
margin per unit of each product by the number of units of the limited resource required
for each product.
True
False
7. Operating leverage refers to the extent to which a company’s net income reacts to a
given change in production.
True
False
8. Companies that have higher fixed costs relative to variable costs have higher operating
leverage.
True
False
*9. Under variable costing, all variable costs are considered product costs.
True
False
*10. Fixed manufacturing costs are a product cost under absorption costing but are a period
cost under variable costing.
True
False
6-18
Multiple Choice
1.
For a company selling multiple products, the break-even point in dollars is computed by
dividing fixed costs by the
a. contribution margin per unit.
b. contribution margin ratio.
c. weighted-average contribution margin per unit.
d. weighted-average contribution margin ratio.
2.
In order to maximize net income a company should produce and sell the product with the
highest.
a. contribution margin ratio.
b. contribution margin per unit.
c. contribution margin per unit of limited resource.
d. weighted-average unit contribution margin.
3.
Operating leverage refers to the extent to which a company’s net income reacts to a
given change in
a. fixed costs.
b. production.
c. sales.
d. variable costs
*4.
Under variable costing, all of the following are considered product costs except
a. direct materials.
b. direct labor.
c. variable manufacturing overhead.
d. variable selling and administrative expenses.
*5.
All of the following are potential advantages of variable costing except that
a. its use is consistent with cost-volume-profit and incremental analysis.
b. variable costing net income is affected by changes in production levels.
c. variable costing net income is closely tied to changes in sales levels.
d. the presentation of fixed and variable cost components makes it easier
to identify these costs.
6-19
ANSWERS TO QUIZ
True/False
1.
2.
3.
4.
5.
True
False
True
False
False
6.
7.
8.
*9.
*10.
True
False
True
False
True
Multiple Choice
1.
2.
3.
*4.
*5.
d.
c.
c.
d.
b.
6-20
ILLUSTRATION 6-1
CVP INCOME STATEMENT
EXAMPLE COMPANY
CVP Income Statement
For the Month Ended May 31, 2008
Total
Sales (14,000 units)
Variable costs
Contribution margin
Fixed costs
Net income
$350,000
210,000
140,000
100,000
$40,000
6-21
Per
Unit
$25
15
$10
ILLUSTRATION 6-2
BREAK-EVEN POINT IN UNITS AND DOLLARS
Break-even
Fixed
=
Point in Units
Costs
Weighted-average
Unit Contribution Margin
Product A
Product B
Percentage
Unit
Unit
Percentage
Weighted-average
of
of
+ Contribution x
Unit Contribution = Contribution x
Sales
Margin
Margin
Sales
Margin
Break-even
Fixed
Point in Dollars = Costs
Weighted-average
Contribution Margin Ratio
Division A
Division B
Contribution Percentage
Contribution Percentage
Weighted-average
x
Margin
of
x
of
Margin
+
=
Contribution
Ratio
Sales
Sales
Ratio
Margin Ratio
6-22
ILLUSTRATION 6-3
DEGREE OF OPERATING LEVERAGE
Degree of
Operating
Leverage
=
Contribution
Margin
Net
Income
Operating leverage is determined by a company's relative
use of fixed versus variable costs.
A company with high operating leverage will experience a sharp
increase in net income with an increase in sales.
6-23
ILLUSTRATION 6-4
EFFECT OF PRODUCTION AND SALES ON ABSORPTION
AND VARIABLE INCOME
Circumstances
Income under
Absorption Costing
Variable Costing
=
Toothbrushes produced = Toothbrushes Sold
>
Toothbrushes produced > Toothbrushes Sold
<
Toothbrushes produced < Toothbrushes Sold
6-24
ILLUSTRATION 6-5
POTENTIAL VARIABLE COSTING ADVANTAGES
1. Variable costing net income is unaffected by changes in
production levels.
2. Using variable costing is consistent with cost-volume-profit
and incremental analysis.
3. Variable costing net income provides a more realistic
assessment of a company's success or failure.
4. The presentation of fixed costs makes it easier to identify
them and understand their effect on company profitability.
6-25