Analysis of customer satisfaction of real estate brokerage service of priority source company limited
Bạn đang xem bản rút gọn của tài liệu. Xem và tải ngay bản đầy đủ của tài liệu tại đây (943.34 KB, 60 trang )
RESEARCH PROJECT
(BMBR5103)
ANALYSIS OF CUSTOMER SATISFACTION OF REAL ESTATE BROKERAGE SERVICE OF
PRIORITY SOURCE COMPANY LIMITED
STUDENTÕS FULL NAME
STUDENT ID
INTAKE
ADVISORÕS NAME & TITLE
: NGUYEN MINH DONG
: CGS00064972
: MBAOUMK20A
: DR. BUI PHI HUNG
August 2017
1
AdvisorÕs assessment
............................................................................................................................................
............................................................................................................................................
............................................................................................................................................
............................................................................................................................................
............................................................................................................................................
............................................................................................................................................
............................................................................................................................................
............................................................................................................................................
............................................................................................................................................
............................................................................................................................................
............................................................................................................................................
............................................................................................................................................
............................................................................................................................................
............................................................................................................................................
............................................................................................................................................
............................................................................................................................................
............................................................................................................................................
............................................................................................................................................
............................................................................................................................................
............................................................................................................................................
............................................................................................................................................
AdvisorÕs signature
2
Content Format:
¥! Write out the table of content for the research proposal;
¥! Using Times New Roman (13 Font), 1.5 line spacing, 3.5cm from top margin,
3cm from bottom, 3.5cm from left and 2cm from right and printed by PDF on
A4 paper;
¥! Research Project must be printed in colour document with hard cover, and then bind
into a book.
¥! Plagiarism will receive a ÒFailÓ mark.
3
Table of contents
Chapter 1 Introduction ................................................................................................................ 6
1.1 Executive Summary .............................................................................................................. 6
1.2 Objectives of the research ..................................................................................................... 6
1.3 Subject and scope of the research ......................................................................................... 6
1.4 Research Methodology ......................................................................................................... 7
1.5 Significance of the study ....................................................................................................... 7
1.6 Structure of the research ....................................................................................................... 7
Chapter 2: Literature Review ...................................................................................................... 8
2.1 Concepts of brokerage and real estate brokerage ................................................................. 8
2.2 Definition of Quality ............................................................................................................. 8
2.3 Service and service quality ................................................................................................... 8
2.3.1 Definition of service .......................................................................................................... 8
2.3.2 Characteristics of Service .................................................................................................. 8
2.3.3 Service Quality ................................................................................................................... 9
2.3.4 Measurement of service quality ......................................................................................... 11
2.4 Customer Satisfaction ........................................................................................................... 15
2.4.1 Definition of customer satisfaction .................................................................................... 15
2.4.2 Customer Satisfaction Index .............................................................................................. 17
2.4.3 Relationship between service quality and satisfaction ....................................................... 17
2.5 Research Model of factors affecting to the quality of real estate brokerage services to the
satisfaction of customer purchasing real estate ........................................................................... 19
2.6 Summary of Chapter 2 .......................................................................................................... 20
Chapter 3: Research Model ......................................................................................................... 21
3.1 Introduction of PRIORITY SOURCE .................................................................................. 21
3.2 Demand for real estate .......................................................................................................... 21
3.3 Characteristics of real estate and real estate brokerage ........................................................ 21
3.4 Design of the research ........................................................................................................... 22
3. 5 Calibrate measurement scale ................................................................................................ 23
3.5.1 Measurement scale of service quality of real estate brokerage .......................................... 23
3.5.2 Customer Satisfaction Measurement Scale ........................................................................ 24
3.6 Formal Research ................................................................................................................... 24
3.7 Summary of Chapter 3 .......................................................................................................... 24
Chapter 4: Research and Discussion ........................................................................................... 26
4.1 Research results and tests ...................................................................................................... 26
4.1.1 Sample information ............................................................................................................ 26
4.1.2 Preliminary evaluation of the scale .................................................................................... 26
4.1.3 Cronbach's Alpha Reliability Coefficient .......................................................................... 27
4.1.3.1 Scale of service quality ................................................................................................... 27
4.1.3.2 Measurement Scale for customer satisfaction ................................................................. 28
4.1.4 Exploratory Factor Analysis (EFA) ................................................................................... 29
4.1.4.1 Measurement Scale for service quality ........................................................................... 29
4.1.4.2 Customer Satisfaction Scale ........................................................................................... 30
4.1.5 Test hypothesis testing ....................................................................................................... 31
4.1.5.1 Test the Pearson correlation coefficient between variables ............................................ 31
4.1.5.2. Analysis of Variance (ANOVA) testing in linear regression analysis .......................... 32
4.1.6 Linear regression analysis .................................................................................................. 32
4.1.7 Differential analysis for customer satisfaction by demographic variables ........................ 33
4.1.7.1 Differential analysis by sex ............................................................................................. 33
4.1.7.2 Differential analysis by age ............................................................................................ 33
4
4.1.7.3 Differential analysis by purpose of purchase .................................................................. 33
4.1.7.4 Differential analysis by Income ...................................................................................... 33
4.2 Interpretation of observable variables by comparing with reality ........................................ 34
4.3 Summary of Chapter 4 .......................................................................................................... 36
Chapter 5: Conclusions and Recommendations ......................................................................... 37
5.1 Main results ........................................................................................................................... 37
5.2 Recommendations ................................................................................................................. 37
5.2.1 Employee Competence component .................................................................................... 37
5.2.2 Reliability component ........................................................................................................ 38
5.2.3 Support Services Composition ........................................................................................... 38
5.2.4 Product component ............................................................................................................ 39
5.2.5 Image component ............................................................................................................... 39
5.3 Limitations and Recommendations ....................................................................................... 40
Reference .................................................................................................................................... 41
Appendices .................................................................................................................................. 43
Appendix 1: Questionnaire ......................................................................................................... 43
Appendix 2: Statistics detailing the survey results ..................................................................... 45
Appendix 3: CronbachÕ Alpha testing results ............................................................................. 47
Appendix 4: Exploratory Factor Analysis (EFA) ....................................................................... 50
5
Chapter 1 Introduction
1.1 Executive Summary
In light of fast-paced socio-economic development of Vietnam over recent years, the demand for
residential and commercial real estate across the country and especially in Ho Chi Minh City has
been increasing rapidly. Real estate is now one of the most actively exchanged commodities,
both in terms of transaction value and volume. In such context, there is a need for bringing in a
third party as commonly known as broker who bridges between the buyers and sellers, landlords
and tenants, and other related parties such as legal advisors, financial advisors and government
authorities. However, in comparison with other markets in the region which are more matured,
real estate brokerage in Vietnam is relatively young and brokerage activities are somewhat lack
of professionalism and transparency that pose several risks on the success of the transactions.
Therefore, in order to meet the demand of the market, to ensure the best interests among the
trading parties and increase the liquidity of the market, real estate brokers are emerged to close
of gap of professionalism of the market.
Real estate brokerage services at Priority Source Company have just been developing almost 2
years. However, the companyÕs founder has over 10 years experience with international real
estate brokerage firms such as Colliers International Vietnam and Cushman & Wakefield
Vietnam, as well as some local real estate developers.
From that situation, the paper wishes to find out what factor takes part in the quality of real
estate brokerage service of Priority Source Company that affect to the satisfaction of customers.
For that reason, the research aims to analyzing impact of service quality on satisfaction of the
customers using real estate brokerage service of Priority Source Company Limited.
1.2 Objectives of the research
General objective: To examine and analyze the impact of service quality components of real
estate brokerage on satisfaction of the customers. From there, the paper hopes to propose
solutions to improve service quality of real estate brokerage and customer satisfaction for
Priority Source Co. Ltd.
Detail objectives:
¥! Objective 1: To describe briefly real estate industry in general and real estate brokerage
services specifically in Priority Source Co. Ltd.
¥! Objective 2: To analyze which component of service quality of real estate brokerage that
affects most to the customer satisfaction of Priority Source Co. Ltd.
¥! Objective 3: Propose solutions to improve the service quality and customer satisfaction
who used and will use real estate brokerage services of Priority Source Co. Ltd.
1.3 Subject and scope of the research
Subject of the research is the quality of real estate brokerage services and key components of
customer satisfaction. The research extends its scope to literature reviews and reference to other
researches on service quality and customer satisfaction. Customers referred in this research are
those who can be either existing or potential customers of the service offerings of Priority
Source Company. While the research scope provides unified results as it only focuses on one
specific company, it also contains in itself the limitation that the scope may not be broad enough
to formulate a representation for service quality of brokerage service of real estate market in
Vietnam.
6
1.4 Research Methodology
Regarding research methodology, the research was carried out in two phases:
- Preliminary research using qualitative interview to adjust and add new components to the
measurement scale of real estate brokerage service quality and to develop measurement scale for
these components.
- Afterward, the research used quantitative methods to test scales and research models by
Cronbach's Alpha analysis, exploratory factor analysis (EFA) and linear regression analysis.
1.5 Significance of the study
The research topic has significance in assessing customer satisfaction practices for real estate
brokerage of the Priority Source Company, specifically as follows:
¥! the research contributes to finding key factors measuring service quality that the client
wishes to receive from the Company.
¥! the research helps the Company managers to know how the service quality of real estate
brokerage of the company is rated by customers, serving as the basis to enhance and
improve the service quality and competitiveness to deal with other competitors in the
industry.
¥! Finally, it provides scale to measure quality of real estate brokerage services for later
researches to refer, adjust and contribute when studing real-life situation of other real
estate companies in Vietnam.
1.6 Structure of the research
This paper is divided into 5 chapters:
Chapter 1: Introduction to Research: Introducing the research and its practical meanings.
Chapter 2: Literature Review: Presenting theoretical foundations, previous researches and
models.
Chapter 3: Research Model: Describing research process.
Chapter 4: Research and Discussion: Presenting results of the research and discuss the results
withi reference to real life situation of the Company.
Chapter 5: Conclusions and Recommendations: Briefly presenting the conclusion from the
research, giving recommendations, pointing out limitations of the research and propose solutions
for future study.
7
Chapter 2: Literature Review
2.1 Concepts of brokerage and real estate brokerage
Brokers are understood as mediating for the two parties to contact, communicate and making a
transaction with each other. In essence, commercial brokerage is a type of commercial service.
Article 150 of the Commercial Law 2005 defines commercial brokerage as Òa commercial
activity whereby a trader acts as an intermediary (referred to as broker) between parties selling
and purchasing goods or providing commercial services (referred to as principals) in the course
of negotiations and entering into contracts for sale and purchase of goods or provision of
services and shall be entitled to a remuneration under a brokerage contract." Real estate
brokerage is to provide assistance to clients with rights related to real estate. Brokers or real
estate consultants providing buyers, sellers, lessees and lessors with necessary information about
the transaction. The content of real estate brokerage services includes many activities such as:
searching and providing necessary information about the parties to the principal, conducting
introduction and presentation of the target real estate products or services, arranging for the
parties to contact each other, help with drafting contract when required. The ultimate purpose of
the brokerage services is to create favorable conditions for the parties to conclude with a
contract.
2.2 Definition of Quality
Armand Feigenbaum defined Òquality is a customer determination, not an engineer's
determination, not a marketing determination or a general management determination. It is based
upon the customer's actual experience with the product or service, measured against his or her
requirements-stated or unstated, conscious or merely sensed, technically operational or entirely
subjective-and always representing a moving target in a competitive market.Ó And according to
American Society for Quality (ASQ), quality should Òdemonstrates the superiority of goods and
services, particularly to the extent that one can satisfy all needs and satisfy customers.Ó
In short, quality is measured by the perception of customers upon using the services, and
meeting the needs and or achieving customer satisfaction means that the customer is recognized
for quality of the service.
2.3 Service and service quality
2.3.1 Definition of service
According to Philip Kotler, a service is any act or performance one party can offer to another
that is essentially intangible and does not result in the ownership of anything. Its production may
or may not be tied to a physical product. The American Marketing Association (AMA) defined
service as any activity that may be separated but must be intangible to satisfy the needs and
desires of the customer, whereby the service does not necessarily use tangible product but in all
cases, there shall not occur any ownership of any object.
Both are basically identical with each other. A thorough examination on the definition of service,
especially that of Philip Kotler, may help us clearly see the nature of service, the responsibilities
and interests of the parties in the relationship of service exchange.
2.3.2 Characteristics of Service
Service has some characteristics or properties that distinguish it from other tangible goods
(Ghobadian, Speller & Jones, 1993; Groth & Dye, 1994; Zeithaml et. al., 1990). Service has the
following features:
8
- Intangibility: This is the basic characteristic of service. Though this property shows that service
does not typically exist in any physical form, service products are still materialistic. The
intangibility nature of service causes many difficulties for management of service production,
more difficult for service marketing, and more difficult to identify services.
- Variability: service products are often non-standardized. Because the quality of services
depends on who provides them, when and where, and to whom, services are highly variable. For
example, when it comes to service supply, different staff may not create the same service at
different working hours. On the other hand, consumer is the person who determines quality of
the service based on their perceptions: at different periods of time, their perceptions are
different; and among different customers, perceptions of service quality are different. Service
products are valuable when satisfying the individual needs of the customer. Therefore, in service
supply, which is often personalized, it is more likely that the service will be removed from the
norms or standards. Service is intangible at the output, it is therefore likely to be measurable and
normative.
- Inseparability: service products are associated with supply activities. Service products may be
systemically heterogeneous, all derived from the structure of the underlying service evolving
into. Production process is associated with service consumption. Consumers also participate in
service supply activities. Thus, the production of services must be cautious. Only when there are
customers and demands, the production process will be carried out.
- Perishability: service cannot be stocked, stored and transported from one area to another.
Consequently, service consumption is limited by time.
- Non-refundability: If the customer is not satisfied, they can be refunded but cannot refund the
service used.
- Uncertain Demand: The level of uncertainty of demand for services is often a lot more varied
than for tangible products.
- Human relationships: The human role in the service is very high and is often evaluated by the
client when evaluating the service.
- Individuality: The customer evaluates the service based very much on his/her own personal
feelings.
- Psychology: quality service is evaluated according to the psychological state of the customer.
2.3.3 Service Quality
There are many different definitions of service quality depending on the research subject and
environment and the study of service quality is the basis for the implementation of measures to
improve service quality of any business. Therefore, definition of quality service is not only
important in setting development goals but also orienting the business to promote its strengths in
the best way.
There are many definitions of service quality, according to Lehtnen and Lehtinen (1982), that
quality of service must be evaluated in two respects, the process of service delivery and the
outcome of the service. According to Gronroos (1984), the definition of quality of service
9
includes two elements of service quality: technical quality and functional quality. In that service
quality relates to what is served and functional quality tells how they are served.
Quality service is the most influential factor in customer satisfaction (Cronin and Taylor, 1992).
If the service provider offers to customers quality products that meet their needs, then the
business has initially made the customer happy. Advardsson, Thomasson and Ovretveit (1994)
argued that Òquality service is a service that meets the expectations of customers and becomes
their awareness after they used the serviceÓ. According to Lewis and Boom: quality service
measure how well the service is delivered to customers corresponding to customer expectations.
Creating a quality service means the ability to meet with customer expectations consistently.
These statements demonstrate that quality of service is intangible, the customer perceives it via
communication and information exchange related to the expectations of the customer. Therefore,
customers can only evaluate the quality of the service after purchasing and using the service.
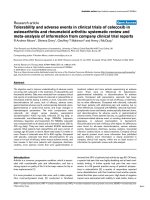
Thus, service quality is created throughout the service delivery process. Each interaction of
customer with service is more or less determinant of customer satisfaction, as shown in Figure
2.1.
Words of mouth
Methods of
evaluating service
quality:
Need/Demand
Expected Services
1.! RATER
2.! 4Ps
Perceived
Services
Experienced
Perceived Services:
¥! If exceed expectation, (ES <
PS): big surprise on quality
¥! Meet with expectation (ES =
PS): Satisfied with service
quality
¥! Unable to meet with
expecttaion (ES>PS):
dissatisfied with service
quality
Figure 2.1: Quality Perceived by customers
(Source: adapted fom B•i Nguy•n H•ng et. Al., 2004)
The quality perceived by customer is affected by their expectation (ES: Expected Service) in
comparison with the level of service they perceive (PS: Perceived Service). The source of
expectation is the perception of what others are saying (words of mouth), specific needs of each
person and the experience someone have had in the past. By comparing with the perceived
service through criteria for evaluating service quality, customers will be disappointed if the
service does not meet expectation, and satisfied when it does, and get very excited when it
exceeds expectation. Below are criteria for evaluating service quality:
a) Functional quality and emotional quality
10
With this assessment, quality of service is examined in 2 factors: Functional quality is what can
be received (What) and emotional quality is how the quality is received by a human being.
Emotional quality by human being is when the customer feels respectful, shown through attitude
of the staff at service and meet the needs of customers.
b) Evaluation based on service quality components (RATER)
Quality is assessed on the RATER components includes: the ability to perform a service as
promised dependently and reliably (Reliability); qualifications of employee such as:
professionalism, courtesy, respect to customer, communication (Assurance); the appearance of
facilities, equipment, personnel, items, materials for communication etc. (Tangibility); Staff at
service is easy-going, attentive to customer creating empathy (Empathy); readiness to help
customers and prompt service delivery (Responsiveness).
c) Evaluation based on 4Ps
Quality is assessed based on 4Ps including: characteristic features of the service provided
(Product); Mode of communication in the process of providing services (Procedure); Service
personnel and processes to complete the service (Provider); How to resolve problems that arise
when the service is provided to the user (Problems: How to resolve unusual situation). In sum,
service quality is determined by the perception or experience of customers in relation to their
individual needs. Each customer has a different way of evaluating the service quality depending
on their experience, but the abovementioned are three most common ways used by customers to
evaluate service quality.
2.3.4 Measurement of service quality
One of the basic characteristics of service quality is that it is difficult to measure or to determine
the quality standard, as it heavily depends on human factor. Service quality is, first of all, human
quality. Service products are intangible, quality is thus determined by customers, not by the
service providers. Customer evaluates the quality of a provided service through assessing the
company's service personnel and through their subjective feelings. Measurement of service
quality varies widely depending on the field of study. For service product in general, we can
measure service quality because of the unique characteristics of the product based on the service
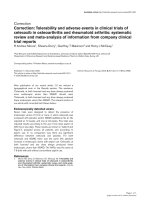
quality model given by PARASUAMAN et. al. (1985), as shown in Figure 2.2.
11
Figure 2.2 Model of service quality gaps
(Source: Parasuraman et al., 1985:44)
The model offers 5 service quality gaps:
- Gap 1: Appears when there is a difference between the customer's expectations about service
quality and the managerÕs experience of such customerÕs expectation. The basic point of this
difference is that the service provider does not fully understand what constitutes the quality of its
service and how it is delivered to its customers to satisfy their needs.
- Gap 2: Appears when service companies have difficulty in converting their understandings of
customer expectations into service characteristics. The main cause of this problem is the level of
professional competence of service staff.
- Gap 3: Appears when service staffs do not deliver services to customers according to defined
criteria. In service, employees directly contact with the customer and play a very important role
in the quality creation process. However, not all time and all employees are able to fulfill the
task according to the criteria set out.
- Gap 4: Advertising media and information also have major impact on customer expectations
about service quality. The promises when advertising and promotional programs can increase
customer expectation but will also reduce the level of quality perceived by customers when the
services are not carried out in accordance with what was promised.
- Gap 5: Appears when there is a difference between the quality expected by the customer and
the quality perceived. Service quality depends on this gap 5. Once the customer realizes that
12
there is no difference between the quality they expect and the quality they perceive during
service consumption, service quality will then be rated as perfect.
Parasuraman stated service quality is a function of gap 5. On the other hand, this gap 5 depends
on the previous gaps, which are gaps 1, 2, 3, 4. Therefore, to shorten gap 5 or increase the
quality of service, service management must try to shorten all other gaps. This service quality
model, according to the researchers, can be expressed as follows:
SQ = F ((G5 = f (G1, G2, G3, G4))
In which, SQ stands for service quality and G1, G2, G3, G4, G5 are quality gaps 1, 2, 3, 4, 5.
In reference to theoretical ideas in Gronroos' model (1984), Parasuraman (1985) developed a
measure composite, called SERVQUAL, to measure the service quality perceived by customer,
and the SERVQUALÕs measurement scale contains 22 pairs of Likert scale items to separately
measure customer expectations and perceptions about service quality. Specifically, Service
quality = Level of perception - Expected Value. This is one of the most commonly used
models for evaluating service quality in several different areas. The SERVQUAL model consists
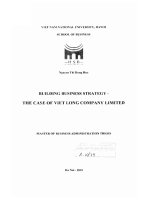
of 10 components as shown in Figure 2.3.
Fig. 2.3 Parasuraman, et al.'s Determinants of Perceived Service Quality
Source: Parasuraman, et al. (1985, p. 48)
13
Components (or dimensions) of service quality: The service quality model of Prasuraman et. Al.
(1985) gives an overall picture of service quality. Parasuraman et. Al. (1985) argues that for any
service, the service quality perceived by the customer can be modeled into 10 components:
1.! Reliability: Expresses the ability to deliver service consistently and timely from the first
time
2.! Responsiveness: Expresses the readiness and willingness of employee to provide prompt
timely services to customers
3.! Competence: is the possession of the required skills and knowledge to perform the
service. The ability to provide service represents when employees contact with and
directly deliver the services to customers, research capabilities to capture relevant
information necessary for customer service.
4.! Access: involves creating approachability condition for customers to access services such
as shortening waiting time, multiple locations and convenient opening times for
customers.
5.! Courtesy: is the consideration for the customer's property and a clean and neat appearance
of contact personnel, manifesting as politeness, respect, and friendliness.
6.! Communication: involves with communicating, translating into any language customers
can understand easily, and listening to related issues such as explaining services, cost,
resolving complaints, product inquiries
7.! Credibility: Expresses the ability to create trust for customers, make customers trust in the
company. It may be influenced by company name, company reputation and the personal
characteristics of the contact personnel.
8.! Security: involves the ability to ensure the safety of customers, including physical safety,
financial security an confidentiality.
9.! Knowing the customer: expressed through the ability to understand the individual need of
customer by understanding the customer requirements, their personal interest and
identification of customers. Bracelets
10.!Tangible means: are the physical evidence of the service which may be appearance,
uniform of employee, tool and equipment used to provide the service
The ten-component model of service quality mentioned above has the advantage of covering
most aspects of the service. However, this model also has the disadvantage of being complex in
measurement. In addition, as this model is theoretical, some components in service quality
model that may not provide distinctive values. Consequently, in 1988, Parasuraman et. al.
revised the model into five components that are the most common and widely used among
marketing researches. According to Parasuraman, service quality cannot be determined in
general but depends on customer's perception of the service and the perception is taken into
account across multiple dimensions. These researchers have repeatedly tested the model and
come to the conclusion that the SERVQUAL scale is composed of five basic components, as
shown below:
14
Figure 2.4: 5 components SERVQUAL model of Parasuraman
(Source: Parasuraman et. al., 1988)
¥! Reliability: demonstrates through the ability to perform service appropriately and timely
from the first time
¥! Resposiveness: demonstrates through the readiness, willingness of employees to provide
prompt service to customers.
¥! Assurance: demonstrates through the professional level and the way to serve courtesy,
customer service.
¥! Empathy: shows great attention and care for each individual customer
¥! Tangible: demonstrates through the appearance, uniform and custom, tool and equipment
used to provide service
Based on references to researches of service quality and inherited from theorical framework
developed by Parasuraman et al. (1988), Johnston and Silvestro (1990) concluded five other
15
factors of quality of service, including: (1) Helpfulness, (2) Care, (3) Commitment, (4)
Functionality, (5) Integrity. In 1990, Gronroos conducted research and proposed six factors to
measure service quality, which are: (1) Professionalism and skills, (2) Attitude and behavior, (3)
Accessibility and flexibility, (4) Reliability and trustworthiness, (5) Reputation and credibility,
(6) Recovery (i.e. ability to resolve complaints)
By 2001, Sureshchandar et. al also put forth 5 factors that affect to service quality:
1.! Core service elements (core service)
2.! Human element
3.! Non-human element
4.! Tangible elements (tangibles)
5.! Social responsibility
The measurement components of service quality vary widely depending on the field of study.
Therefore, the research materials outlined above are the basis for specific determination of
measurement scales for service quality in real estate brokerage sector. The SERVQUAL scale
has been used by researchers for a variety of services as well as for different markets. However,
many studies show that the importance of factors will vary depending on the type of service and
market. Pham Van Hai and Bui Thi Thanh (2011) studied the influence model of brokerage
services components on customer satisfaction of real estate buyers and set out a 5-component
scale: product, employee capability, image, reliability and support services, as shown in Figure
2.5:
Product
Employee Competence
Image
Satisfaction of
customers who
purchase real estate
products
Reliability
Support Services
Figure 2.5 Ð real estate brokerage components affecting customer satisfaction Model
(Adapted from Pham Van Hai & Bui Thi Thanh, 2011)
Considering that this study is quite suitable for the author's next research, however, due to the
socio-economic conditions between regions, there are differences in income and infrastructure
development. Therefore, qualitative research was conducted through expert interviewing
techniques to adjust and supplement the composition of the scale to suit the situation at the
Company and the area of conducting research survey.
2.4 Customer Satisfaction
2.4.1 Definition of customer satisfaction
There are definitions as follows: "Satisfaction is the level of human sensibility derived from
comparing the results obtained from the product with the expectations of the person" (Kotler,
2003). "Satisfaction is the reaction of consumers to estimating the difference between previous
16
wishes and after-product use" (Tse and Wilton, 1988). "Satisfaction is the response of consumers
to the fulfillment of their desires" (Oliver, 1997). Although there are many definitions of
customer satisfaction, however, we can understand that customer satisfaction is the satisfaction
of consumers in the consumption of a product or service because it satisfies the consumer
desires, which can either be above and below the desired level. Customer satisfaction is the
customer's perception of the service provider after using the service (Terrence Levesque and
Gordon H. McDougall, 1996).
More specifically, customer satisfaction is the response of overall perception of a customer to a
service provider on the basis of comparing the difference between what they received versus
what was expected (Oliver, 1999). On the same point, Kotler (2003) states that SATISFIATION
is defined on the basis of a comparison between the results obtained from the service and the
expectations of the customer which is based on the three following levels:
- The level of dissatisfaction: When the level of customer perception is smaller than expected.
- Satisfaction level: When the level of customer perception is equal to expected.
- Very satisfied level: When the level of customer perception is greater than expected.
According to Prof. Noritaki Kano, the response to customer expectations is shown as in Figure
2.6:
Attraction
Level 3
Level 2
Level 1
Unreveal
Expectation
Explicit
Expectation
Implicit
Expectation
Satisfied
Features
One-way
features
Required
features
Figure 2.6: Customer Expection Level Chart
(Adapted from Bui Nguyen Hung et. al., 2004)
Implicit requirement (required feature): is a requirement the customer does not tell but presumes
the product or service must have. Without it, customer will be intolerably disappointed. But if
17
the service has such attribute, in some case at a high quality level, the customer will take it for
granted, and their satisfaction is almost unchanged.
Explicit (or pre-exchange) Requirement (one-way feature): is a requirement the customer wants
and service provider can meet. The higher the quality level of this attribute, the more satisfied
the customer.
Unrevealed requirements (satisfied feature): is a requirement customers have not expected or
thought of. Without it, the customer would not be upset, but if there exist such a feature, it will
make them extremely excited and encourage them to make a purchase of product or service.
Thus, the degree of satisfaction is the function of the difference between the received and
expected results. Customers can feel one of the following three levels of satisfaction: If the
performance is worse than expected, the customer will be dissatisfied. If performance is equal
with expectations then the customer will be satisfied. If the actual results exceed expectations,
the customer is satisfied.
2.4.2 Customer Satisfaction Index
Customer Satisfaction Index is used to measure customer satisfaction for several industries and
company in many developed countries. Customer satisfaction becomes an important asset for
businesses and organizations in their efforts to improve service quality, maintain loyalty, and
enhance their competitiveness.
This indicator can be carried out on the national level (how satisfied the business industry, the
industry will be for its customers) or at a level of internal industry at different time periods.
From there, businesses can know their position, how their customer think of the company in
order to make plans for business targets and strategies. Customer Satisfaction Index includes
several factors (variables), each of which is made up of many specific elements which is typical
to the product or service. Customer satisfaction is defined as a comprehensive assessment of the
use of a service or after-sales program of a company and this is at the core of the customer
satisfaction measurement model. Around this variable is a system of causal relationships derived
from initial variables such as customer expectations, company image and product - service,
perceived quality and perceived value about the product or service attached to the outcome
variables of satisfaction such as loyalty or customer complaints.
2.4.3 Relationship between service quality and satisfaction
The relationship between service quality and customer satisfaction is the subject of continuous
discussion among researchers over the past decades. Many researches which placed emphasis on
customer satisfaction in service industries has been made. Some authors argued that service
quality and customer satisfaction have equal importance so that these two concepts can be used
interchangeably. However, many studies have shown that service quality and customer
satisfaction are two distinct concepts. Parasuraman et al. (1993), arguing that there are some
differences between quality of service and customer satisfaction, the main difference being the
"causality". Zeithalm and Bitner (2000) claim that customer satisfaction is influenced by many
factors such as: product quality, service quality, price, situational factors, personal factors.
Service quality and satisfaction, though being different, are two closely related concepts in
service research (Parasuraman and GC 1988). Previous studies have shown that quality of
service is the cause of satisfaction (Cronin and Taylor, 1992; Spreng and Taylor, 1996). The
reason is that service quality is related to service delivery, and satisfaction can be measured only
18
after the service has been used. Thus, customer satisfaction is viewed as result, while service
quality as a cause. Satisfaction has predictive nature; service quality is as an ideal standard.
Customer satisfaction is a general concept which demonstrates the satisfaction of customer when
using a service. Meanwhile, service quality only focuses on specific components of service
(Zeithaml & Bitner, 2000). Although service quality and satisfaction are interrelated, few studies
focused on testing the descriptive level of service quality components for satisfaction, especially
for each specific service sector (Lassar et al., 2000). Cronin and Taylor tested this relationship
and concluded that the quality of service resulted in customer satisfaction. Studies have
concluded that quality of service is a precondition for satisfaction (Cronin and Taylor, 1992;
Spereng, 1996) and a major factor in satisfaction (Ruyter, Bloemer, 1997). According to Philip
Kotler (2003), the three pillars of customer satisfaction are the product factor, convenience
factor and human factor. By which, service quality is a factor affecting to customer satisfaction.
This shows that customer satisfaction is significantly broader than the service quality.
Customer Satisfaction
Product Factors:
- Diversity of the offered
products
- Price
- Quality and features
- Service Quality and
After Sales Services
- etc.
Convenience Factors:
- Location
- Delivery Points
- Return and Refund
Rules
- Opening hours
- Method of Payment
- etc.
Human Factors:
- Skills, Qualifications
of the Salespersons
- Behavior and act of
employees
Figure 2.7: Factors affecting to customer Satisfaction
(source: Philip Kotler, 2002)
In the service business sector, we often confuse "satisfaction" and "quality" in a mutually
interchangeable sense. In fact, service quality is one of the aspects of a service affecting to
customer satisfaction, that is, the acceptance of service may occur without customers having
actual experience with a company. (For example, we may know that the Marina Bay Sands
Hotel & Casino has a high quality in providing hospitality services although we may have not
been there.) Meanwhile, customer satisfaction is measured after the customer had practical
experience. Historically, there has been a great deal of researches that have examined the
relationship between customer service quality and customer satisfaction, which, according to
Cronin and Taylor (1992), service quality is the strongest contributor to customer satisfaction.
Any service of higher quality will make the customer more satisfied. From there, if the company
wants to enhance the customer's satisfaction with their services, the company must improve their
19
service quality first. In other words, service quality and the customer satisfaction are closely tied
to each other. In which, service quality is what exists first and will determine the satisfaction of
the customer.
Spreng and Mackoy (1996) also point out that service quality is the premise of customer
satisfaction.
(Source: SPreng & Mackoy, 1996)
2.5 Research Model of factors affecting to the quality of real estate brokerage services to
the satisfaction of customer purchasing real estate
Based on the presented theoretical basis, and at the same time refer to earlier researches on
service quality evalation and the actual conditions of the subject and the field research, the
author proposes evaluation components of service quality including: Products; Employee
competence; Reliability; Brand; Support Services.
¥! Product: show diversity, real time updates about real estate listings and price, complete
information.
¥! Employee competence: reflected in knowledge, professional expertise in brokerage,
ability to consult and customer care.
¥! Reliability: shows the company's reputation, ability to serve and provide clear and
authentic information to customers.
¥! Brand: show the brand and values the Company brings in the perception and experience
of customers.
¥! Support Services: Provides value-added services to make transactions convenient, fast
and secure.
20
Product
H1
Employee Competence
H2
H3
Image
Satisfaction of
customers who
purchase real estate
products
H4
Reliability
H5
Support Services
Figure 2.9: theoretical model of real estate brokerage factors affecting to customer
satisfaction
(Source: Adapted from Le Minh Dan, 2016)
The hypotheses in this research are:
¥! H1: There is a positive relationship between product and customer satisfaction for real
estate brokerage service.
¥! H2: There is a positive relationship between employee competence and real estate
brokerage service.
¥! H3: There is a positive relationship between image and customer satisfaction for real
estate brokerage service.
¥! H4: There is a positive relationship between reliability and customer satisfaction for real
estate brokerage service.
¥! H5: There is a positive relationship between support service and customer satisfaction for
for real estate brokerage service.
2.6 Summary of Chapter 2
This chapter presents several theories and previous research modelss related to service quality
and customer satisfaction. Service quality in general and quality of real estate brokerage services
in particular depends on the gaps between the level of customer expectations for the service
provided and the perception of receiving services. From there, the author proposes the
measurement scales of service quality of real estate brokerage service that consists of 5
components: Product, employee competence, image, reliability, support service.
21
Chapter 3: Research Model
3.1 Introduction of PRIORITY SOURCE
Priority Source Company Ltd. Co. was established in December 2013 with core businesses in
real estate brokerage and real estate related legal consulting. The primary market focuses on Ho
Chi Minh City real estate market. Since its inception, the Company has gradually developed into
an effective micro company in real estate brokerage in Ho Chi Minh City.
Address: 35/10 Tran Ke Xuong, Ward 7, Phu Nhuan Ditstrict, Ho Chi Minh City
Contact Office: Level 4, 04 Nguyen Thi Minh Khai Street, District 1, Ho Chi Minh City
Chartered Capital: VND 100 million
Company Logo:
¥! Real estate brokerage services: including both commercial and residential real estate
brokerage
¥! Legal services: Assisting clients in completing legal documents of real estate; transfering
ownership of the property; obtaining a building permit, conducting due diligence of
targeted properties.
3.2 Demand for real estate
Demand for real estate is a kind of special and synthetic needs of human beings. This demand is
formed and developed on the basis of physical needs (a shelter, a place to settle) and spiritual
needs (security needs, property assurance, self-assertiveness, perception and communication).
Requirements for real estate depend on the following conditions: income, infrastructure, nature,
geography, socioeconomic environment in a particular society, social group where someone
lives, works and communicates. The need for buying real estate are varied and satisfying this
need is to meet all demands simultaneously, including:
¥! The need for a shelter, a place to live.
¥! The need for convenience for everyday life of someone
¥! The need for safety, where real estate is deemed as a secured asset.
¥! The need to feel the space, to communicate with the surrounding environment.
¥! The need for investment and business accommodation.
¥! The need for self-assertion, recognition of social achievement.
Demand for real estate of society can only grow when the economic, political and cultural
conditions of society are improved and developed. Based on the needs of customers, real estate
buyers can be classified into the following groups:
¥! As a place to live: buy real estate for residential accommodation, with the purpose of
having private houses when getting married or changing workplace or migrating.
¥! Short-term investment: buy real estate for resale in the short term.
¥! Long term investment: buy real estate for resale in the long term.
¥! Other: buy real estate for resort, rental purposes, business location.
However, the grouping is only relative because the decision to buy real estate may be just the
stimulus of a combination of needs.
22
3.3 Characteristics of real estate and real estate brokerage
Real estate consists of assets including land, buildings, buildings associated with land, including
assets attached to houses, buildings, and other assets attached to land (Article 174, Civil Code
2005). Through trading activities to meet the needs of exchange of goods and services among the
society, brokerage in general and real estate brokerage in particular are emerged. Real estate
brokerage is an activity that assists real estate owners to seek clients, negotiate to finalize a
purchase, sale or lease contracts. The brokers earn their compensation in form of commission
after successful closing of a commercial contract between the parties. Real estate brokers are
fully independent traders who sell, lease or manage real estate owned by the customer for an
agreed fee. When selling real estate, the broker performs all the operations from connecting and
searching for the needs for buying and selling properties among parties, arranges meetings and
negotiations until a deal is successfully closed and the party completes transfer the ownership
right of the property to be new owner. Real estate brokerage services are tools and means by
which real estate brokers and developers can advertise all real estate transactions and projects,
either ongoing or in the shortcoming, to all customers with real estate needs.
Real estate is a special kind of goods of great value and is therefore subject to government
policies and applicable laws. All transfers, sales, changes of ownership must be carried out
legally and approved by the competent authority. Because of the unique characteristics that can
not be relocated, the location of real estate in the sense of value includes: commercial location,
security location, potential location, location suitable for living or trading a commodity, will
greatly affect the price of real estate. Brokers are usually pleasant, honest, and trustworthy,
mature, having the right judgment, credible, and enthusiastic in the job. Because real estate is a
product of very high value, the representative should possess the most convincing expression for
the customer.
3.4 Design of the research
The research is carried out into two phases:
Phase 1 - Preliminary research:
This phase uses qualitative methodology by expert interview. Two employees from commercial
leasing and residential sales teams and one from legal consulting team of the company were
invited to the interview to discuss if the questionnaire should be adjusted and supplemented in
order to fit in actual business practices at Priority Source Company and Ho Chi Minh City real
estate market. Preliminary research aimed at adjusting and improving observable variables to
come up with research model and finalize the questionnaire. After eliminating and adding
observational variables by the opinions of the experts, the measurement scale for service quality
of real estate brokerage used for the reasearch included 26 observable variables measuring 5
components of the research model.
Phase 2 - Main Research:
This phase was conducted by quantitative research methodology through collecting answers in
the questionnaires sent to prospect customers extracted from customer database of Priority
Source. The collected data is then used to test hypotheses of the research model.
The research process is shown in Figure 3.1. This process consists of 03 main parts: Formulating
measurement scale; Testing measurement scale; and testing hypothesis.
23
Theories of Service Quality:
SERVQUAL
Customer Satisfaction
Quantitative Research
(n=137)
Initial
Scale
ExpertÕs
Opinions
Official
Applicable
Scale
Scale Measurement: Reliability Analysis,
Exploratory Factors Analysis (EFA)
Scale
Adjustment
Testing hypotheses
Figure 3.1: Research Procedure
(Source: adapted from Le Minh Dan, 2016)
3. 5 Calibrate measurement scale
3.5.1 Measurement scale of service quality of real estate brokerage
Pham Van Hai and Bui Thi Thanh (2011) have provided the measurement scale for service
quality of real estate brokerage service, which consists of five components (product, employee
competence, image, reliability, and support services) with 29 observable variables. However,
since Priority Source is a newly established company with a limited pool of customers, the scale
is adjusted and supplemnted accordingly. As the company core business line is in commercial
real estate brokerage, and the company just stepped in residential and industrial sales recently,
this research after consulting with the experts in each sector, the measurement scale is adjusted
and added to include the following observable variables:
Product component:
1. Real estate products are diversified (P1)
2. Real estate products are offered at competitive prices on the market (P2)
3. Real estate products offered for sale meet with market demands (P3)
4. Real estate products provide clear and sufficient information (P4)
5. Real estate product listings are always up-to-date (P5)
Employee Competence Component
1. Employees are always ready and willing to serve customers. (E1)
2. Employees are very friendly and polite. (E2)
3. Employees possess with good knowledge of real estate. (E3)
4. Employees have good knowledge of related sectors (E4)
5. Employees always meet the needs of customers (E5)
24
6. Employees resolve customerÕs complaints properly (E6)
7. Employees always advise in the best interests of customers (E7)
Image Component:
1. Brand and reputation of PRIORITY SOURCE is reliable (I1)
2. Priority Source is often on top of mind of the customers when they have demand for real
estate (I2)
3. Priority Source strives to serve customers with high sense of responsibility (I3)
Reliability Component:
1. The products are transparent and legitimate. (L1)
2. The transaction procedure is clear and convenient for customers. (L2)
3. Priority Source advises asking price of properties on the market correctly. (L3)
4. Customers information during the transaction is treated with high confidential (L4)
5. Priority Source provides services promptly and timely (L5)
Component of Support Services:
1. Planning information and transaction legality are verified for customers. (S1)
2. Bank loans are recommended to customers. (S2)
3. Site inspections are arranged with customers. (S3)
4. Prepare contracts properly and explain in detail (S4)
5. Consult with payments upon purchasing real estate in a transparent and risk free manner. (S5)
6. Complete transaction documentation (S6)
After adjusting, the measurement scale of service quality of real estate used for the research
included 26 sets of observable variables for evaluating the five-component model.
3.5.2 Customer Satisfaction Measurement Scale
Based on Hayes's (1994) scale for assessing overall customer satisfaction when using brokerage
services, the scale used in this research consists of 4 observable variables:
1. Customers are satisfied with diversified real estate products which meet the demands (CS1)
2. Customers are satisfied with employee competence (CS2)
3. Customers are satisfied with the reputation of PRIORITY SOURCE (CS3)
4. In conclusion, customers are satisfied with Priority SourceÕs real estate brokerage service
(CS4)
In addition to demonstrating customer satisfaction for real estate services quality, the Customer
Satisfaction Scale is also used to test the relative impact of factors on the measurement scale for
service quality of real estate broker services.
3.6 Formal Research
Research Sample: Due to limit of time and the fact that Priority Source is a newly established
company, the research is opted to convenient sampling method.
The sample size is estimated at 130. The selection of sample size is based on a minimum sample
size of 100 to 150 as Hair et al., (1998) and Hatcher (1994) suggested that the sample size ratio
should be 5 times greater than (5:1) the number of observable variables. In addition, other
researchers, such as Hoelter (1983), proposed a sample size of 200. Based on Hatcher (1994),
the research is then estimated to achieve a minimum sample size of 130, carried out in a
convenient manner. In order to achieve n = 130 (26 variables x 5), 800 copies of questionnaire
25