The impact of service quality on customer satisfaction at southern information and valuation corporation (sivc)
Bạn đang xem bản rút gọn của tài liệu. Xem và tải ngay bản đầy đủ của tài liệu tại đây (2.46 MB, 97 trang )
OPEN UNIVERSITY MALAYSIA
HO CHI MINH CITY UNIVERSITY OF TECHNOLOGY
MASTER OF BUSINESS ADMINISTRATION
BUSINESS RESEARCH
THE IMPACT OF SERVICE QUALITY
ON CUSTOMER SATISFACTION AT
SOUTHERN INFORMATION AND
VALUATION CORPORATION (SIVC)
Teacher:
Student:
Class:
ID Code:
Dr Bui Phi Hung
Tang Thai Bich Thong
MBAOUM0316_K20A
CGS00064983
HCMC, 2017
ACKNOWLEDGMENT
With deep affection, sincerity, allow me to express my gratitude to all the agencies and
individuals who have helped me in my studies and research to complete this
dissertation.
I sincerely thank all the teachers, teachers and civil servants of Ho Chi Minh City
University of Technology for helping me in all aspects during the study and research.
In particular, I would like to express my deep respect and gratitude to the teacher Dr
Bui Phi Hung who personally directed and assisted me throughout the study period to
complete this dissertation.
I would like to express my sincere thanks to the Board of Management, Departments /
Branches of the Southern Information and Valuation Company (SIVC) for facilitating
my participation in the course and collection. Data for this thesis.
Lastly, thank you to my friends, colleagues, classmates for their suggestions on the
thesis.
Sincerely thanks.
Ho Chi Minh city, 5th August 2017
Student
(Signed)
Tang Thai Bich Thong
i
EXECUTIVE SUMMARY
Since the early 1990s, valuation services in Vietnam have been constantly
evolving. In fact, domestic appraisal firms have taken steps to improve service quality,
implement strategies aimed at customer satisfaction but overall still limited. How to
improve the quality of valuation services that bring satisfaction to customers is always
an important objective that appraisers try to achieve. When a price appraiser does not
meet the customer's requirements, not only does the appraiser lose that customer but it
also loses a lot of potential customers. The study of the topic: "The impact of service
quality on customer satisfaction: Research at Southern Information and Valuation
Company" has profound theoretical and practical significance.
Thesis uses qualitative research methods and quantitative methods through faceto-face interviews with detailed questionnaires to assess the theoretical and theoretical
models. The Customer Satisfaction Assessment Model for Quality of Service Based on
the SERVQUAL Scale - A tool for measuring service quality consists of five
components of reliability, responsiveness, service capability, Empathy and tangible
means.
The results of the analysis show that there are five factors that affect customer
satisfaction with the SIVC valuation service, including: Reliability, Empathy, Service
Capability, Responsiveness, and Medium material. Five factors have a positive
standardized Beta, so these variables work in the same direction as customer
satisfaction. On the other hand, the 5 factors that affect customer satisfaction are Sig
value <0.05. Therefore, they have a significant impact on customer satisfaction, with
the strongest factor being the reliability with Beta = 0.389. This result confirms the
hypotheses about the relationship between satisfaction and the factors influencing
satisfaction expressed in the research model (from H1 to H5 hypothesis) accepted and
validated. fit. Since then, SIVC needs to focus on further improving these factors to
improve customer satisfaction.
ii
TABLE OF CONTENTS
ACKNOWLEDGMENT .................................................................................................. i
EXECUTIVE SUMMARY .............................................................................................ii
TABLE OF CONTENTS .............................................................................................. iii
LIST OF ABBREVIATIONS ........................................................................................ vi
LIST OF FIGURES .......................................................................................................vii
LIST OF TABLES ...................................................................................................... viii
CHAPTER 1. OVERVIEW OF RESEARCH THEMES ............................................... 1
1.1. Rationale ............................................................................................................. 1
1.2. Research questions ............................................................................................. 2
1.3. Objectives of the study ....................................................................................... 2
1.4. Research Methods .............................................................................................. 2
1.5. Scope and Limitation.......................................................................................... 3
1.6. Significance of the Research .............................................................................. 4
1.7. Proposed Structure ............................................................................................. 4
CHAPTER 2. THEORETICAL BASIS AND RESEARCH MODULES ...................... 5
2.1. Service quality .................................................................................................... 5
2.1.1.
Service quality ........................................................................................... 5
2.1.2.
Studies on the composition of service quality ........................................... 6
2.2. Customer satisfaction ....................................................................................... 10
2.3. The relationship between quality of service and customer satisfaction ........... 12
2.4. Theories and models of research ...................................................................... 14
CHAPTER 3. RESEARCH METHODOLOGY ........................................................... 17
3.1. research process ................................................................................................ 17
3.2. Research Design ............................................................................................... 17
3.2.1.
Preliminary study ..................................................................................... 17
3.2.1.1.
Preliminary qualitative research ........................................................ 18
3.2.1.2.
Results of the preliminary measurement ........................................... 18
3.2.1.3.
Preliminary qualitative research ........................................................ 20
3.2.1.4.
Results of preliminary quantitative research ..................................... 20
3.2.2.
Formal study ............................................................................................ 22
3.2.2.1.
Sampling ........................................................................................... 22
iii
3.2.2.2.
Sample size........................................................................................ 22
CHAPTER 4. RESULTS RESULTS ............................................................................ 23
4.1. Sample democraphics ....................................................................................... 23
4.2. Cronbach's Alpha Scale Reliability Test .......................................................... 25
4.3. Analyzing the EFA Discovery Factor .............................................................. 27
4.3.1.
Analytical EFA measure of service quality ............................................. 27
4.3.2.
Analyzing the EFA scale of satisfaction.................................................. 30
4.4. Regression analysis .......................................................................................... 30
4.4.1.
Pearson correlation coefficient analysis .................................................. 30
4.4.2.
Regression analysis .................................................................................. 31
4.4.3.
Results of hypotheses and research models ............................................. 33
4.4.4.
Detect violations of necessary assumptions ............................................ 34
4.5. Analyze the difference in customer satisfaction with demographic factors .... 35
4.5.1.
Check the difference in sex satisfaction .................................................. 36
4.5.2.
Check for differences in age satisfaction ................................................. 36
4.5.3.
Verify differences in level of satisfaction by level .................................. 37
4.5.4.
Determine the difference in career satisfaction ....................................... 38
4.6. Discuss the research results .............................................................................. 39
CHAPTER 5. CONCLUSIONS AND RECOMMENDATIONS ................................ 41
5.1. Conclude ........................................................................................................... 41
5.2. Administrative implication to improve customer satisfaction with the quality
of valuation services ...................................................................................................... 42
5.2.1.
Management implication of responsiveness ............................................ 42
5.2.2.
Administrative implication of empathy ................................................... 43
5.2.3.
Management implication on service capability ....................................... 44
5.2.4.
Management implication of responsiveness ............................................ 47
5.2.5.
Implication of management of tangible means ....................................... 48
5.2.6.
Other administrative implications ........................................................... 49
5.3. Limit topics and research direction follow ....................................................... 51
Referrence ...................................................................................................................... 53
APPENDIX ................................................................................................................... 55
APPENDIX 1 ............................................................................................................. 55
iv
APPENDIX 2 ............................................................................................................. 59
APPENDIX 3 ............................................................................................................. 60
APPENDIX 4 ............................................................................................................. 64
APPENDIX 5 ............................................................................................................. 67
APPENDIX 6 ............................................................................................................. 74
APPENDIX 7 ............................................................................................................. 77
APPENDIX 8 ............................................................................................................. 79
v
LIST OF ABBREVIATIONS
ACSI: American Customer Satisfaction Model
CBCNV:Employees: Employees
CLDV: Quality of service
CSI: Customer Satisfaction Index
DC: empathy
DU: Response
DVT: Evaluation Services
ECSI: European Customer Satisfaction Index
EFA: Exploration Factor Analysis
HH: tangible means
HL: Satisfaction
NL: Serving capacity
SERVQUAL: Service quality
SIVC: Southern Information and Valuation Joint Stock Company
TC: Trust
Self assessment: Appraisal
VVA: Vietnam Valuation Association (Vietnam Valuers Association)
WAVO: World Association of Valuation
vi
LIST OF FIGURES
Figure 2.1 Model 5 service quality distance .................................................................... 7
Figure 2.2 Service quality model of Gronroos ................................................................ 8
Figure 2.3 Customer Satisfaction, Teboul, 1999 ........................................................... 12
Figure 2.4 The relationship between quality of service and customer satisfaction of
Zeithaml & Britner (2000)............................................................................................. 13
Figure 2.5 Recommended research model .................................................................... 15
Figure 3.1. Researcch process ....................................................................................... 17
Figure 4.1 The level of use of the appraisal service ...................................................... 25
Table 4.4 Results of the EFA analysis for the service quality scale ............................. 27
Figure 4.2 Research model confirmed by research data ............................................... 34
Figure 4.3. Scatterplot HL chart .................................................................................... 34
Figure 4.4. Histogram histogram HL ............................................................................ 35
Figure 1.1 Organizational Structure of SIVC ................................................................ 56
Figure 1.2 Turnover of Southern Information and Valuation Corporation - SIVC ...... 57
vii
LIST OF TABLES
Table 2.1. Ten factors SERVQUAL................................................................................ 9
Table 2.2. Five elements of the SERVQUAL model .................................................... 10
Table 3.1. Results scale discussion................................................................................ 19
Table 4.1 Sample characteristics of the survey ............................................................. 23
Table 4.2 Cronbach's Alpha reliability test results ........................................................ 26
Table 4.3 KMO and Bartlett's Test ................................................................................ 27
Table 4.4 Results of the EFA analysis for the service quality scale ............................. 27
Table 4.5 Results of the EFA analysis of satisfaction scale .......................................... 30
Table 4.6 Test the correlation between independent and dependent variables ............. 31
Table 4.7 summarizes the regression model of customer satisfaction .......................... 32
Table 4.8. Results of regression model of factors affecting satisfaction ....................... 32
Table 4.9 Independent Samples Test by sex ................................................................. 36
Table 4.10 Age-specific ANOVA test........................................................................... 37
Table 4.11 Qualification of ANOVA by Level ............................................................. 37
Table 4.12 Accredited ANOVA by occupation ............................................................ 38
Table 4.13 Comparison of significance levels and mean values ................................... 40
Table 5.1 Statistics of the reliability scale ..................................................................... 42
Table 5.2 Statistics of mean values of empathy scales .................................................. 43
Table 5.3 Statistics of mean values of service capability scales ................................... 44
Table 5.4 Statistics of mean response scale................................................................... 47
Table 5.5 Statistical Statistics of Means of Means of Measurement............................. 48
viii
CHAPTER 1. OVERVIEW OF RESEARCH THEMES
1.1. Rationale
As the economy develops, appraisal services are a necessity. Throughout the
development phase, appraisal services increasingly assert roles and positions in service
industries. As other industries develop, complex economic relationships, the appraisal
service grows in both breadth and depth to serve that change. The fact proves the role
of valuation as more and more social problems of the economy are supported by
valuation services such as public asset procurement, asset price determination,
Finance, tax calculation, settlement and valuation of real estate for ground clearance,
business cooperation, proof of capital contribution when establishing enterprises,
transfer of contributed capital, equitization . It can be seen that appraisal services are
necessary and important for the economy.
Since the early 1990s, valuation services in Vietnam have been constantly
evolving. Up to now, Vietnamese law has allowed more than 132 enterprises to
conduct price verification services and to recognize more than 500 price appraisers
who qualify for price appraisal practice nationwide. The rapid development of the
industry also created fierce competition for market share. Apart from domestic firms,
there are also strong and experienced foreign corporations and companies involved in
competing for domestic market share. In fact, domestic appraisal firms have taken
steps to improve service quality, implement strategies aimed at customer satisfaction
but overall still limited. How to improve the quality of valuation services that bring
satisfaction to customers is always an important objective that appraisers try to
achieve. When a price appraiser does not meet the customer's requirements, not only
does the appraiser lose that customer but it also loses a lot of potential customers.
Southern Information and Valuation Company (SIVC) was formerly the
Southern Information and Valuation Center - Ministry of Finance. Established and
developed first in Vietnam since 1999. The establishment and operation of SIVC to
meet market demand and the essence of valuation services in the process of integration
and development.
However, in the context of increasingly intense competition, in order to compete
and affirm the SIVC brand in the market, SIVC should have the right orientation and
strategy not only to invest in facilities , Technology but also human resources
investment in a way to improve the quality of valuation services, develop customers,
take advantage of opportunities. In order to become one of the leading providers of
valuation services, improving the quality of valuation services to meet the increasing
demands of customers is an urgent requirement for SIVC in the period. The present
1/97
paragraph.
Starting from the above, the topic: "The impact of service quality on customer
satisfaction: study at Southern Information and Valuation Corporation" was chosen by
the author as the thesis Masters.
1.2. Research questions
To achieve the above objectives, research should answer the following questions:
1. What are the factors of the quality of the evaluation services that affect customer
satisfaction?
2. What is the level of impact of the quality of the price evaluation service on customer
satisfaction?
3. What are the management implications that should be proposed to improve
customer satisfaction with the quality of valuation services at Southern valuation and
information appraisal companies in the near future?
1.3. Objectives of the study
The thesis aims to the following research objectives:
- Identify the elements of the quality of the valuation services that impact on customer
satisfaction.
- Measure the impact of quality evaluation services on customer satisfaction.
- Suggest some administrative implications to improve customer satisfaction with the
quality of valuation services at South-South information and valuation companies in
the coming time.
1.4. Research Methods
The study was conducted through two phases: the first phase of the preliminary study
and the second phase of the formal study.
Stage 1: Preliminary research
Taken by two methods: qualitative research and qualitative research. Preliminary
qualitative research is conducted through consultation techniques and is based on the
scale of previous studies to build a draft scale. From the draft scale, using focus group
discussion techniques to eliminate unobservable variables, add and correct observation
variables to build a preliminary scale.
Preliminary quantitative research was conducted with a small sample size (N = 150)
by direct interview method through detailed questionnaires for preliminary assessment
of reliability, Actual survey conditions, to avoid errors during the design of the
questionnaire. Then adjusted accordingly to perfect the scale and questionnaire for the
formal study.
Stage 2: formal study
2/97
Made by quantitative research. From the survey questionnaire, the data was collected
from a sample of 300 customers of Southern Information and Valuation. The author
uses SPSS 22 software to process the data. Data after analysis and evaluation are used
to test scales, research models, and research hypotheses.
1.5. Scope and Limitation
SIVC is one of the leading enterprises in the appraising industry in the South in
particular and the whole country in general with many advantages in the appraisal
business.
On the other hand, SIVC also has a good understanding of local customers and a large
number of traditional customers and strategic partners such as Vietnam Dairy Products
Joint Stock Company, Vinacafé Bien Hoa Joint Stock Company and many large units.
other…
Currently, SIVC is gradually improving information systems increasingly modern,
using the software technology in management and business. Perform survey and
storage of price data systems. Currently, the company's price data on real estate has
reached over 25 major cities, data continuously for 5 years. Data on other services
such as prices in the fields of machinery, equipment, medical equipment and medical
equipment have also been fully updated in the last 3 years [14].
SIVC staff is experienced, as of 30/6/2016, at SIVC has nearly 300 qualified
employees. Of which, postgraduate accounted for 5%, university level accounted for
80%, college 11%, intermediate 4%. Equally important is that SIVC has a more
appropriate and competitive service charge than other valuers (Internal Quarter
2/2016).
Especially, SIVC always shows its responsibility to the community by participating in
social activities such as building charity houses, building solid bridges in rural areas ...
This contributes to affirm the position of SIVC - one of the leading appraisers.
Some exist and cause
In addition to the achievements in time, there are still shortcomings in the process of
providing evaluation services such as:
- The customer policy is not clearly segmented for each specific customer group, and
there is no change in the policy of attracting customers of enterprises cause difficulties
for staff in marketing and hard work. Customer care.
- The company's policy is mainly about the old customers, regular customers, but not
focused on the exploitation of new customers.
- Young staff, limited experience. In particular, the staff at the Sales Department is
young and inexperienced, so they have not taken full advantage of the potential and
long-standing relationships at SIVC.
3/97
- Thin business staff, workload a lot, so most of the staff do not have time to market
customers.
- SIVC has a close, long-term relationship with many businesses, government
agencies, institutes, universities ... but the company has not yet marketed through this
number of customers to increase the number of customers. potential.
- In addition, at branches and representative offices marketing policy and customer
care is not paid much attention.
The reason is because the functions and duties of the sales staff have not been
standardized, the sales staff perform a lot of work, not focusing on the stage of
"selling", more direct leadership is not uniform. Marketing policies and customer care.
Although, the company has developed work procedures in accordance with the law on
valuation. However, in the process of operation, most of the staff have not fully
implemented and follow the process, often shorten the process, so resulting in
deficiencies in some products provided to customers.
1.6. Significance of the Research
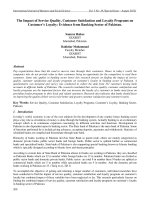
Firstly, in terms of theoretical results, the research contributes to the theoretical and
practical basis of the elements of the quality of valuation services that impact on
customer satisfaction. At the same time, it can serve as a reference for those interested
in doing research to measure satisfaction or improve the quality of valuation services.
Secondly, in terms of the practicality of the research results, managers of companies
doing business in the same type of service and especially the Southern Information and
Valuation Company understand the factors of The quality of valuation services affects
customer satisfaction, thereby enhancing customer satisfaction, attracting customers,
increasing competitiveness and expanding market share in the coming years.
1.7. Proposed Structure
The structure of the thesis consists of five chapters, namely:
Chapter 1: Overview of research topics
Chapter 2: Theoretical Foundations and Research Models
Chapter 3: Research Methods
Chapter 4: Research Results
Chapter 5: Conclusion and implication
4/97
CHAPTER 2. THEORETICAL BASIS AND RESEARCH
MODULES
In chapter 2, the thesis introduces the concepts and theories of service quality,
customer satisfaction. Concurrently summarize previous studies on the relationship
between quality of service and customer satisfaction, and then propose research
models and hypotheses.
2.1. Service quality
2.1.1. Service quality
Services play an increasingly important role in creating value for the nation's
economy. Recognizing the importance of the service, academic researchers have been
concentrating their research on this field since the early 1980s. In the service industry,
the products are invisible, evaluating their quality quite well. difficult. This can be
explained based on the characteristics of the service. The theory of service marketing
assumes that the service consists of three basic characteristics that are invisible,
inhomogeneous and inseparable.
There are now many different definitions of service quality, but in general terms the
quality of service is what the customer feels. Each customer has different perceptions
and personal needs so feel the different quality of service.
In addition to the expectation of the customer, service quality is also greatly affected
by the service provider. Service providers must be able to provide advice, the ability to
collect and process information. In addition, the service provider must combine their
experience and judgment to provide the best possible service to their customers.
According to Feigenbaum (1991), service quality is the customer's decision based on
actual experience with the product or service, measured on the basis of customer
requirements, which can be stated. Whether or not it is conscious or simply sensible,
totally subjective or professional and always represents a dynamic goal in a
competitive market.
Russell (1999), the quality of service demonstrates the superiority of goods and
services, especially to the extent that people can satisfy their needs and satisfy their
customers. "
Gronroos (1984), quality of service is the quality that customers perceive through the
service they receive and service quality is offered in two areas: (1) technical quality
and (2) quality Amount of function. Technical quality refers to what is served and the
quality of the function that speaks to them is served.
Parasuraman & Ctg (1985, 1988) are perhaps the pioneers in the study of service
quality in the marketing sector in detail and in detail. According to Parasuraman &
5/97
CTG, quality of service can be measured by measuring the difference between the
level of expectation and the true perceived value of the customer for the service.
2.1.2. Studies on the composition of service quality
Model year gap
One of the basic characteristics of service quality is difficult to measure, it is difficult
to determine the quality standards, it depends on the human element is the key. Quality
of service is first of all human quality. Service products are invisible, quality is
determined by the customer, not by the supplier. Customer evaluates the quality of a
service provided through the evaluation of the company's service personnel and
through their subjective feelings.
For service products in general, we can measure the quality of service because of the
unique characteristics of the product based on Parasuraman's service quality model.
Inside:
Type 1 distance: Appears when there is a difference between the customer's
expectations for the quality of service and the service manager feeling about this
customer expectations. The basic point of this difference is that the service provider
does not know all the features that make up the quality of the service they provide and
how they can be delivered to their customers to satisfy their needs. Their bridge. This
is the most damaging distance.
Type 2 distance: The gap between the leader's perceptions and the specific
requirements for service quality
Type 2 distance occurs when a service provider is having difficulty converting their
perceptions of customer expectations into service quality features. In many cases,
service providers may be aware of customer expectations but they may not always be
able to translate this expectation into quality criteria and deliver them periodically.
Hope for customers. The main cause of this problem is the capacity of the service staff
not to meet service needs when the fluctuation range of demand changes in number or
change in a short time.
6/97
Figure 2.1 Model 5 service quality distance
(Source: Parasuraman and partners., 1985)
Type 3 distance: Distance between service quality requirements and service
performance
Type 3 distance occurs when service personnel do not deliver services to customers
according to defined criteria. In the service, employees who have direct contact with
the customer play a very important role in the process of creating quality. However, it
is not always possible for all employees to fulfill their assigned tasks.
Type 4 distance: The distance between the information that informs the customer and
the service provider
Type 4 gap arose when companies failed to keep their commitments. Customers feel a
7/97
bad service when service commitments are not made. This is usually due to providing
the customer with incorrect or misleading information.
Distance Type 5: Distance between the desired service and the service received
This type of gap is due to the difference that consumers feel between the quality level
they are expecting compared to the quality they feel after using the service.
In these models, 5-gap models are more commonly used in practice as well as in
research.
Parasuraman & ctg (1985), arguing that service quality is a function of the fifth
dimension. This fifth distance depends on the previous distance. That is, distances 1, 2,
3, 4. Therefore, to shorten the fifth distance and increase the quality of service, the
service manager attempts to shorten these gaps.
The quality of service model according to these researchers can be expressed as:
CLDV = F (KC_5 = f (KC_1, KC_2, KC_3, KC_4))
In it, CLDV is service quality and KC_1, KC_2, KC_3, KC_4, KC_5 are quality
intervals 1, 2, 3, 4, 5.
Service quality model of Gronroos
The Gronroos service quality model identifies three basic components of service
quality: quality, technical quality, and image quality.
Technical quality is the quality of what the consumer actually receives, as a result of
the interaction of the customer with the quality of the business. Quality plays an
important role for customers in evaluating the quality of service.
Figure 2.2 Service quality model of Gronroos
(Source: Gronroos,1984)
Chất lượng chức năng (Chất lượng chức năng) là cách mà khách hàng nhận được kết
quả kỹ thuật (Kết quả kỹ thuật) như thế nào. Quality binding role of customer clients.
8/97
Hình ảnh cũng đóng vai trò quan trọng trong chất lượng của doanh nghiệp và nó có thể
được xây dựng từ các tính năng và chất lượng kỹ thuật, bao gồm các nhân tố: truyền
thống, tư tưởng, truyền miệng, giá cả và Quan nich it.
SERVQUAL model
The SERVQUAL model is a tool used to measure service quality by comparing
customer expectations and customer perceptions through the specific characteristics of
a given service. Most of the service quality measurement models are developed on the
SERVQUAL model.
At first, the SERVQUAL model had 10 factors, according to Parasuraman et al.
(1985), ten factors in terms of service quality through focus group research. In it,
reliability is most important.
Table 2.1. Ten factors SERVQUAL
No
eterminants
service quality
Measurement criteria
1
Reliability
This means that the business is doing the right service
for the first time and fulfilling its promise
2
Responsiveness
This is related to the willingness and goodwill of
employees to provide the service.
3
Competence
This means possessing the skills and knowledge
required to perform the service.
4
Access
5
Courtsey
6
Communication
7
Credibility
8
Security
9
10
Understanding
Tangibles
This relates to accessibility and accessibility
This involves polite, respectful, caring and friendly
staff.
This means keeping in touch with customers in a
language they can understand and listen to.
This involves trust and honesty.
This is a danger, risk, or form of doubt.
Understanding the customer involves effort to
understand the needs of the customer.
This includes tangible documents of services.
(Source: Parasuraman & ctg, 1985, p.47)
Subsequently, in their follow-up study (Parasuraman et al., 1988) screened and
crystallized from 10 factors into 5 factors with 22 variable scales. Reliability is the
most important factor. Followings are responsiveness, assurance, empathy, and
tangibles that are of least interest to the customer. This model is popular and widely
used in the field of service and management.
9/97
Table 2.2. Five elements of the SERVQUAL model
Quality
No determinants of
service quality
22 variable scale
Provision of services as promised
Reliability in solving customer service problems
1
2
3
Reliability
Responsiveness
Assurance
Make the right service right the first time.
Providing services at the promised time.
Store the records with no errors.
Ensure customers are notified when services will be performed.
Fast service for customers.
Ready to help customers.
Ready to meet the requirements of customers.
Employees believe in customers
Make customers feel secure in their deals.
The staff is always polite.
Employees have the knowledge to answer customer questions.
Give the customer personal attention
4
Empathy
The staff dealt with the customer thoughtfully.
It is the duty of the customer to benefit the best.
The staff understands the needs of their customers.
Business hours are convenient.
5
Tangibles
Modern equipment.
Intuitive means of visualization.
The staff has a neat appearance, professional.
Intuitive visual attraction combined with service.
(Source: Parasuraman and his partners (Referred to in Kotler and Keller, 2006, p.414)
2.2. Customer satisfaction
For a business or business organization, the most valuable asset is the customer,
so understanding the customer is critical to the success of the business. There are many
definitions of customer satisfaction.
Philip Kotler (2002), Satisfaction is the level of a person's sense of place that
results from comparing the results of the product with his or her expectations.
Customer satisfaction is the customer response to the perceived difference
between known experience and expectations (Parasuraman and GCG, 1988; Spreng
and CTG, 1996).
10/97
According to Sweeney & Soutar (2001) customer satisfaction is the evaluation
of customer feedback after consuming a product / service. While sensory value occurs
throughout the process, before, during and after the purchase of the product or service.
Tse and Wilton (1988), Satisfaction is the reaction of consumers to estimating
the difference between the previous wishes and the true expression of the product as
the final acceptance when use it.
The theory widely used to measure customer satisfaction is the "Expectation Confirmation" theory.
Oliver (1997), Customer Satisfaction is the psychological state in which a
customer perceives an organization when their expectations are fulfilled or exceeds the
expectation of spending. Use the product or service. According to this theory,
customer satisfaction can be understood as the following process:
1) First and foremost, customers form their thoughts about what constitutes the
quality of service that a vendor can bring to them before the customer decides to buy.
2) After that, buying services and using services contribute to customer trust in
the actual performance they are using.
3) Customer satisfaction is the result of the effective comparison that this
service brings between what they expect before buying a service and what they receive
after using it and will have Three cases of customer expectations are:
A) be certified if the effect of the service is exactly the same as the customer's
expectation;
B) Will be disappointed if service performance does not match customer
expectations / expectations;
C) It will be satisfying if what they feel and experience after using the service
exceeds what they expect and expect before buying the service.
In order to improve customer satisfaction, businesses need additional
investments that at least invest in marketing programs. In the context of competition,
the wisdom of every business is simply to create customer satisfaction higher than the
competition. This will harmonize the interests of customers and profits of the business.
The real factor that determines customer loyalty is value for the customer. Customer
value creates satisfaction, customer satisfaction.
11/97
Customer
Satisfaction
Company Offer
Customer need
Figure 2.3 Customer Satisfaction, Teboul, 1999
(Source: Total quality Management, 1999)
Teboul (1999), gives a view of customer satisfaction as just a meeting point or
area of overlap between the ability of the business and the needs of the customer. The
more satisfied your business is, the more satisfied your business will be.
Customer satisfaction is not an object that can be statistically emotive or
opinion oriented. Although statistical models have been developed to characterize
customer satisfaction, all customer perceptions or opinions are subjective. Because
customer satisfaction is subjective, it is difficult to measure. Every human being will
have his or her own opinions about satisfaction, even, at different times, but a person
will have different opinions about satisfaction.
In short, customer satisfaction is the perception of the consumer through the
consumption of products or services in terms of the level of benefit that a product or
service actually delivers compared to what consumers are expecting. loop.
Customer satisfaction depends on the efficiency or benefits of the service or
product that it offers versus what it is expecting. Customers can have different levels
of satisfaction. If the efficiency of service products bring lower than expected,
customers will not be satisfied. If the efficiency of service products meet expectations,
customers will be satisfied. If the efficiency of products and services is higher than
expected, customers will be very satisfied.
The problem is how do customers shape their expectations? The expectations
are based on customer experience, peer feedback and information from marketers.
Suppliers must be cautious to set the right expectations. If they offer low expectations,
they can satisfy real customers but not enough to earn.
2.3. The relationship between quality of service and customer satisfaction
The relationship between quality of service and customer satisfaction has been
12/97
the subject of constant discussion for decades. Often, service providers often assume
that the quality of the service The main thing is the level of customer satisfaction.
However, many studies of customer satisfaction in service industries have shown that
service quality and customer satisfaction are two distinct concepts and they are
interrelated. (Zeithaml & Britner, 2000). Customer satisfaction is a concept that
expresses their satisfaction when consuming a service. Meanwhile, service quality
focuses on specific components of the service.
Spreng and Mackoy (1996) concluded in their study that quality of service is
the premise of satisfaction. At the same time, De Ruyter & ctg (1997) argue that
service quality is a major factor affecting customer satisfaction.
Indeed in the service sector, the two concepts of "customer satisfaction" and
"quality of service" are fundamentally different based on analyzing the causal
relationship between them. Customer satisfaction is generally a broader concept than
quality of service. With this view we can see the quality of service as a factor in the
impact on customer satisfaction. The following model states this
Figure 2.4 The relationship between quality of service and customer
satisfaction of Zeithaml & Britner (2000)
In addition, Oliver (1993), arguing that quality of service affects customer satisfaction.
Mean quality of service - determined by various factors - is part of the determinant of
satisfaction (Parasuraman, 1985, 1988).
There have been many empirical studies of the relationship between service quality
and customer satisfaction, in which Cronin and Taylor (1992) validated this
relationship and concluded that quality perception Service leads to customer
satisfaction. Studies have concluded that quality of service is a precondition for
satisfaction (Cronin & Taylor, 1992; Spreng & Mackoy, 1996) and is a major
contributor to satisfaction (Ruyter, Bloemer, Peeters. , 1997).
Thus, it is clear that customer satisfaction is a broad concept, including the many
factors that affect it, in which quality of service is the key factor for satisfaction.
13/97
2.4. Theories and models of research
As stated in the above sections, service quality in general and valuation services in
particular, service quality is the most important factor affecting service users'
satisfaction. Currently, one of the most accepted service quality measures is the
Servqual scale of Parasuraman et al. (1988). The Servqual range is a complete scale of
service quality, value and reliability, and can be applied to all types of service. This
multivariate scale consists of 22 variables that measure five components of service
quality: reliability, responsiveness, assurance, Empathy and tangibles. However, in
different studies, the number of variables can be changed to suit the content and scope
of the research.
Therefore, this subject uses the SERVQUAL scale developed by Parasuraman,
Zeithaml and Berry (1988) as the basis for the modeling of research.
In addition to the quality of service, according to Zeithaml & Bitner (2000) prices,
situational factors and personal factors also have an impact on customer satisfaction.
However, by looking at the characteristics of the appraisal industry and interviewing
some experts in the area of price appraisal, the price factor is not considered a major
factor affecting customer satisfaction. . Because the characteristics of the appraisal
service is the expectation of the "value" of the property when using the services of the
service users. Therefore, when the evaluation value is different from the expectations
of the service users will lead to dissatisfaction. On the other hand, the results of
interviews with some experts also suggest that it is because of the "expectation" of the
assessed value that service prices are not considered a major variable. And the price of
services is included in the "capacity" section, which is the ability to meet expectations
at a reasonable cost.
- Reliability: Parasuraman et al. (1988, 1991) and Sweeney (2001) have confirmed
that product / service reliability influences satisfaction. Similarly, according to
Sanchez (2006), trust is viewed as a cognitive concept that has a positive effect on
satisfaction. Therefore, this study sets forth the first hypothesis about the effect of trust
on customer satisfaction. From there, we have the first hypothesis:
Hypothesis H1: The composition of trust has a positive correlation with customer
satisfaction. That is, the more customers trust the service of the company, the higher
the satisfaction of customers and vice versa.
Response: Parasuraman et al. (1988, 1991) affirmed that customers would be satisfied
when employees were always ready to provide service in a timely manner. They assert
that customer satisfaction is affected in the same way by the satisfaction, willingness
and goodwill of the service provider. Therefore, we have a theory:
14/97
Hypothesis H2: The composition of the response is positively correlated with customer
satisfaction. That is, the higher the customer's ability to satisfy the service, the higher
their satisfaction and vice versa.
- Capacity: According to Parasuraman et al. (1988, 1991), service capacity is reflected
in the professional level and the courteous and hospitable service to customers. The
higher the service capacity, the higher the customer satisfaction. Parasuraman and his
associates affirmed their capacity for positive impact on satisfaction. We have a
theory:
Hypothesis H3: Service capacity components have a positive correlation with
customer satisfaction. That is, the higher the customer service rating of the company,
the more satisfied they feel and vice versa.
- Empathy: Parasuraman et al. (1988, 1991), Oliver (1993) argue that empathy for
caring, individual attention, and customer satisfaction is an important factor in
achieving satisfaction. of cutomer. Therefore, we have a theory:
Hypothesis H4: The composition of empathy correlates favorably to customer
satisfaction. That is, when customers appreciate the company's empathy, they feel
more satisfied and vice versa.
- Tangible: Parasuraman et al. (1988, 1991) suggest that tangible means of expression
are the appearance, appearance, staffing, and service facilities. Tangible media have a
positive influence on satisfaction. We have a theory:
Hypothesis H5: The components of tangible means have a positive correlation with
customer satisfaction. That is, the higher the customer's appreciation of the physical
means of valuation services, the higher their satisfaction and vice versa.
Reliability
Response
Service Capacity
Empathy
Tangible
H1
H2
H3
Customer
Satisfaction
H4
H5
Figure 2.5 Recommended research model
15/97
Summary of Chapter 2
In this chapter, the thesis presents the theoretical basis of concept, the relationship
between quality of service and satisfaction. From the basis of that argument, the author
has given a general research model for the topic. Service costs or service prices alone
are not considered as an independent variable because the specificity of the appraisal
industry is "expected".
In the next chapter the study will present research methods
On construction, scale measurement and model testing.
16/97