Solution manual introduction to management accounting 14e by horngren chapter 02
Bạn đang xem bản rút gọn của tài liệu. Xem và tải ngay bản đầy đủ của tài liệu tại đây (337.72 KB, 65 trang )
To download more slides, ebook, solutions and test bank, visit
CHAPTER 2
COVERAGE OF LEARNING OBJECTIVES
FUNDAMENTAL
ASSIGNLEARNING OBJECTIVE
LO1: Explain how cost
drivers affect cost behavior.
LO2: Show how changes in
cost-driver levels affect
variable and fixed costs.
LO3: Calculate break-even
sales volume in total dollars
and total units.
LO4: Create a cost-volumeprofit graph and
understand the assumptions
behind it.
LO5: Calculate sales
volume in total dollars and
total units to reach a target
profit.
LO6: Differentiate between
contribution margin and
gross margin.
LO7: Explain the effects of
sales mix on profits
(Appendix 2A).
LO8: Compute costvolume-profit relationships
on an after-tax basis
(Appendix 2B).
MENT
CRITICAL
THINKING
EXERCISES
AND
EXERCISES PROBLEMS
CASES,
NIKE 10K,
EXCEL,
COLLAB.,
&
INTERNET
EXERCISES
MATERIAL
A1, B1
24, 25, 27
41, 43, 45, 48
60
A1, B1, A2,
A3, B2, B3
24, 25, 28, 29
41, 44, 45, 46,
48, 51, 52, 55
60, 61, 65
A2, A3, B2,
B3
34, 35, 36
42, 44, 46, 47,
49, 51, 53,
60, 61, 65, 66
30, 31, 32, 33
41
30, 31, 36,
42, 44, 46, 47,
49, 51,
A2, A3, B2,
B3
61
53
A2, B2
37
56, 57
62
38, 39
58, 59
63
40
To download more slides, ebook, solutions and test bank, visit
CHAPTER 2
INTRODUCTION TO COST BEHAVIOR AND COST-VOLUME
RELATIONSHIPS
2-A1 (20-25 Min.)
1. The cost driver for both resources is square feet cleaned. Labor
cost is a fixed-cost resource, and cleaning supplies is a variable cost.
Costs for cleaning between 4 and 8 times a month are:
Number
of times
plant is
cleaned
4
5
6
7
8
Square
Feet
Cleaned
100,000*
125,000
150,000
175,000
200,000
Labor
Cost
$24,000
24,000
24,000
24,000
24,000
Cleaning
Supplies Cost
$ 5,000**
6,250***
7,500
8,750
10,000
Total cost
$29,000
30,250
31,500
32,750
34,000
Cost per
Square
Foot
$0.290
0.242
0.210
0.187
0.170
* 4 x 25,000 square feet
** Cleaning supplies cost per square feet cleaned = $5,000 ÷ 100,000 = $0.05
*** $0.05 per square foot x 125,000
The predicted total cost to clean the plant during the next quarter is
the sum of the total costs for monthly cleanings of 5, 6, and 8 times.
This is
$30,250 + $31,500 + $34,000 = $95,750
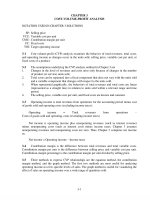
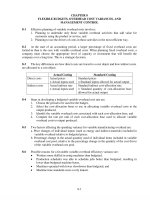
2. If Boeing hires the outside cleaning company, all its cleaning
costs will be variable at a rate of $5,900 per cleaning. The cost driver
will be “number of times cleaned.” The predicted cost to clean a
total of 5 + 6 + 8 = 19 times is 19 x $5,900 = $112,100. Thus, Boeing
will not save by hiring the outside cleaning company. The table and
chart on the next page show the total costs for the two alternatives.
The cost driver for the outsource alternative is different than the
41
To download more slides, ebook, solutions and test bank, visit
cost driver if Boeing cleans the plant with its own employees. If
Boeing expects average “times cleaned” to be 6 or more, it would
save by cleaning with its own employees.
Boeing Cleans Plant
Square Feet
Cleaned
Boeing
100,000
$ 29,000
125,000
30,250
150,000
31,500
175,000
32,750
200,000
34,000
Outsource Cleaning Plant
Times
Cleaned
Outside
4
$23,600
5
29,500
6
35,400
7
41,300
8
47,200
Cleaning Costs at Boeing Plant
$50,000
Total Cleaning Costs
$45,000
$40,000
$35,000
$30,000
$25,000
$20,000
$15,000
$10,000
$5,000
$100,000 125,000 150,000 175,000 200,000
(4)
(5)
(6)
(7)
(8)
Square Feet (Times Cleaned)
Boeing
42
Outside Company
To download more slides, ebook, solutions and test bank, visit
2-A2 (20-25 min.)
1.
Let N
Sales
$1.00 N
$.20 N
N
Let S
S
.20 S
S
= number of units
= Fixed expenses + Variable expenses + Net income
= $5,000 + $.80 N + 0
= $5,000
= 25,000 units
= sales in dollars
= $5,000 + .80 S + 0
= $5,000
= $25,000
Alternatively, the 25,000 units may be multiplied by the $1.00
to obtain $25,000.
In formula form:
In units
Fixed costs + Net income
($5,000 0)
=
= 25,000 units
Contribution margin per unit
$.20
In dollars
Fixed costs + Net income
($5,000
=
Contribution margin percent
.20
43
0)
= $25,000
To download more slides, ebook, solutions and test bank, visit
2.
The quick way: (36,000 - 25,000) x $.20 = $2,200
Compare income statements:
Volume in units
Sales
Deduct expenses:
Variable
Fixed
Total expenses
Effect on net income
3.
Break-even
Point
Increment Total
25,000
11,000
36,000
$25,000
$11,000 $36,000
20,000
5,000
$25,000
$
0
8,800
--$8,800
$ 2,200
28,800
5,000
$33,800
$ 2,200
Total fixed expenses would be $5,000 + $1,152 = $6,152
$6,152
$6,152
= 30,760 units;
= $30,760 sales
$.20/unit
.20
or 30,760 x $1.00 = $30,760 sales
4.
New contribution margin is $.18 per unit;
$5,000 ÷ $.18 = 27,778 units
27,778 units x $1.00 = $27,778 in sales
5.
The quick way: (36,000 - 25,000) x $.16 = $1,760. On a graph,
the slope of the total cost line would have a kink upward,
beginning at the break-even point.
44
To download more slides, ebook, solutions and test bank, visit
2-A3 (20-30 min.)
The following format is only one of many ways to present a
solution. This situation is really a demonstration of "sensitivity
analysis," whereby a basic solution is tested to see how much it is
affected by changes in critical factors. Much discussion can ensue,
particularly about the final three changes.
The basic contribution margin per revenue mile is $1.50 $1.30 = $.20
(1)
(2)
(3)
(4)
(5)
(1)x(2)
(3)-(4)
Revenue Contribution
Total
Miles
Margin Per Contribution Fixed
Net
Sold
Revenue Mile Margin Expenses Income
1.
800,000
$.20
$160,000
$110,000
$ 50,000
2. (a)
(b)
(c)
(d)
(e)
(f)
(g)
800,000
880,000
800,000
800,000
840,000
720,000
840,000
.35
.20
.07
.20
.17
.25
.20
280,000
176,000
56,000
160,000
142,800
180,000
168,000
110,000
110,000
110,000
121,000
110,000
110,000
121,000
170,000
66,000
(54,000)
39,000
32,800
70,000
47,000
45
To download more slides, ebook, solutions and test bank, visit
2-B1 (20-25 Min.)
1. The cost driver for both resources is square feet cleaned. Labor
cost is a fixed-cost resource, and cleaning supplies is a variable cost.
Costs for cleaning between 35 and 50 times are:
Square
Cleaning
Times
Feet
Labor
Supplies
Cleaned Cleaned Cost
Cost
*
35
140,000 $18,000 $ 8,400**
40
160,000
18,000
9,600
45
180,000
18,000 10,800
50
200,000
18,000 12,000
Total
cost
$26,400
27,600
28,800
30,000
Cost per
Square
Foot
$0.189
0.173
0.160
0.150
* 35 x 4,000
** The cost of cleaning supplies per square feet cleaned = $8,400 ÷ 140,000 =
$0.06 per square foot. Cleaning supplies cost = $0.06 x 140,000 = $8,400.
The predicted total cost to clean during the November and
December is the sum of the total costs for monthly cleanings of 45
and 50 times. This is
$28,800 + $30,000 = $58,800
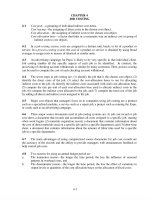
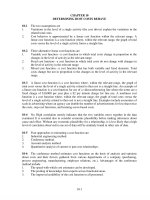
2. If Outback hires the outside cleaning company, all its cleaning
costs will be variable at a rate of $0.17 per square foot cleaned. The
predicted cost to clean a total of 45 + 50 = 95 times is 95 x 4,000 x
$0.17 = $64,600. Thus Outback will not save by hiring the outside
cleaning company.
To determine whether outsourcing is a good decision on a
permanent basis Outback needs to know the expected demand for
the cost driver over an extended time frame. As the following table
and graph show, outsourcing becomes less attractive when cost
46
To download more slides, ebook, solutions and test bank, visit
driver levels are high. If average demand for cleaning is expected to
be more than about 164,000 ÷ 4,000 = 41 times a month, Outback
should continue to do its own cleaning. Outback should also
consider such factors as quality and cost control when an outside
cleaning company is used.
(1)
Times
Cleaned
35
40
45
50
(2)
Square Feet
Cleaned
140,000
160,000
180,000
200,000
(3)
Outback Total
Cleaning Cost*
$26,400
27,600
28,800
30,000
Outside
Cleaning Cost
$.17 x (2)
$23,800
27,200
30,600
34,000
* From requirement 1., total cost is the fixed cost of $18,000 +
variable costs of $.06 x square feet cleaned
Cleaning Costs at Outback
$40,000
Total Cleaning Costs
$35,000
$30,000
$25,000
$20,000
$15,000
$10,000
$5,000
$140,000
160,000
180,000
200,000
Square Feet
Outback Cleaning
Outsource Cleaning
47
To download more slides, ebook, solutions and test bank, visit
2-B2 (15-20 min.)
1.
$5,000
$5,000
=
= 1,000 units
($20 $15)
$5
2.
Contribution margin:
($40,000 $30,000)
= 25%
($40,000)
$7,500 ÷ 25% = $30,000
3.
($33,000 $7,000)
$40,000
=
= 2,500 units
$16
($30 $14)
4. ($50,000 - $20,000)(110%) = $33,000 contribution margin;
$33,000 - $20,000 = $13,000
or
(10% x $50,000) x .6 = $3,000 more net income. The current $10,000
net income plus the $3,000 additional net income equal $13,000 total
net income.
5.
New contribution margin: $40 - ($30 - 20% of $30)
= $40 - ($30 - $6) = $16;
New fixed expenses: $80,000 x 110% = $88,000;
($88,000 $20,000)
$108,000
=
= 6,750 units
$16
$16
48
To download more slides, ebook, solutions and test bank, visit
2-B3 (15-25 min.)
1.
176 x ($30 - $10) - $2,300 = $3,520 - $2,300 = $1,220
2.
a. 198 x ($30 - $10) - $2,300 = $3,960 - $2,300 = $1,660
or (22 x $20) + $1,220 = $440 + $1,220 = $1,660
b. 176 x ($30 - $11) - $2,300 = $3,344 - $2,300 = $1,044
or $1,220 - ($1 x 176) = $1,044
c. $1,220 - $200 = $1,020
d. [(9.5 x 22) x ($30 - $10)] - ($2,300 + $300) = $4,180 - $2,600
= $1,580
e. [(7 x 22) x ($33 - $10)] - $2,300 = $3,542 - $2,300 = $1,242
2-1 This is a good characterization of cost behavior. Identifying
cost drivers will identify activities that affect costs, and the
relationship between a cost driver and costs specifies how the cost
driver influences costs.
2-2 Two rules of thumb to use are:
a. Total fixed costs remain unchanged regardless of changes
in cost-driver activity level.
b. The per-unit variable cost remains unchanged regardless
of changes in cost-driver activity level.
2-3 Examples of variable costs are the costs of merchandise,
materials, parts, supplies, sales commissions, and many types of
labor. Examples of fixed costs are real estate taxes, real estate
insurance, many executive salaries, and space rentals.
49
To download more slides, ebook, solutions and test bank, visit
2-4 Fixed costs, by definition, do not vary in total as volume
changes within the relevant range and during the time period
specified (a month, year, etc.). However, when the cost-driver level
is outside the relevant range (either less than or greater than the
limits) management must decide whether to decrease or increase the
capacity of the resource, expressed in cost-driver units. In the long
run, all costs are subject to change. For example, the costs of
occupancy such as a long-term non-cancellable lease cannot be
changed for the term of the lease, but at the end of the lease
management can change this cost. In a few cases, fixed costs may be
changed by entities outside the company rather than by internal
management – an example is the fixed, base charge for some utilities
that is set by utility commissions.
2-5 Yes. Fixed costs per unit change as the volume of activity
changes. Therefore, for fixed cost per unit to be meaningful, you
must identify an appropriate volume level. In contrast, total fixed
costs are independent of volume level.
2-6 No. Cost behavior is much more complex than a simple
dichotomy into fixed or variable. For example, some costs are not
linear, and some have more than one cost driver. Division of costs
into fixed and variable categories is a useful simplification, but it is
not a complete description of cost behavior in most situations.
2-7 No. The relevant range pertains to both variable and fixed
costs. Outside a relevant range, some variable costs, such as fuel
consumed, may behave differently per unit of activity volume.
2-8 The major simplifying assumption is that we can classify costs
as either variable or fixed with respect to a single measure of the
volume of output activity.
50
To download more slides, ebook, solutions and test bank, visit
2-9 The same cost may be regarded as variable in one decision
situation and fixed in a second decision situation. For example, fuel
costs are fixed with respect to the addition of one more passenger on
a bus because the added passenger has almost no effect on total fuel
costs. In contrast, total fuel costs are variable in relation to the
decision of whether to add one more mile to a city bus route.
2-10 No. Contribution margin is the excess of sales over all variable
costs, not fixed costs. It may be expressed as a total, as a ratio, as a
percentage, or per unit.
2-11 A "break-even analysis" does not describe the real value of a
CVP analysis, which shows profit at any volume of activity within
the relevant range. The break-even point is often only incidental in
studies of cost-volume relationships. It predicts how managers’
decisions will affect sales, costs, and net income. It is an important
part of a company’s planning process.
2-12 No. break-even points can vary greatly within an industry.
For example, Rolls Royce has a much lower break-even volume than
does Honda (or Ford, Toyota, and other high-volume auto
producers).
2-13 No. The CVP technique you choose is a matter of personal
preference or convenience. The equation technique is the most
general, but it may not be the easiest to apply. All three techniques
yield the same results.
2-14 Three ways of lowering a break-even point, holding other
factors constant, are: decrease total fixed costs, increase selling
prices, and decrease unit variable costs.
2-15 No. In addition to being quicker, incremental analysis is
simpler. This is important because it keeps the analysis from being
cluttered by irrelevant and potentially confusing data.
51
To download more slides, ebook, solutions and test bank, visit
2-16 An increase in demand for a company’s products will drive
almost all other cost-driver levels higher. This will cause cost drivers
to exceed capacity or the upper end of the relevant range for its
fixed-cost resources. Since fixed-cost resources must be purchased in
“chunks” of capacity, the proportional increase in cost may exceed
the proportional increase in the use of the related cost-driver. Thus
cost per cost-driver unit may increase.
2-17 Operating leverage is a firm's ratio of fixed to variable costs.
A highly leveraged company has relatively high fixed costs and low
variable costs. Such a firm is risky because small changes in volume
lead to large changes in net income.
2-18 No. In retailing, the contribution margin is likely to be smaller
than the gross margin. For instance, sales commissions are
deducted in computing the contribution margin but not the gross
margin. In manufacturing companies the opposite is likely to be
true because there are many fixed manufacturing costs deducted in
computing gross margin.
2-19 No. CVP relationships pertain to both profit-seeking and
nonprofit organizations. In particular, managers of nonprofit
organizations must deal with tradeoffs between variable and fixed
costs. To many government department managers, lump-sum
budget appropriations are regarded as the available revenues.
2-20 Contribution margin could be lower because the proportion of
sales of the product bearing the higher unit contribution margin
declines.
2-21
Target income before
=
income taxes
Target after - tax net income
1 - tax rate
52
To download more slides, ebook, solutions and test bank, visit
2-22
Change in = Change in volume x Contribution margin x (1 - tax rate)
per unit
net income
in units
2-23 No. The individual is confused. Definitions of variable and
fixed cost behavior are based on total cost behavior, not unit cost
behavior.
2-24 The key to determining cost behavior is to ask, “If there is a
change in the level of the cost driver, will the total cost of the
resource change immediately?” If the answer is yes, the resource
cost is variable. If the answer is no, the resource cost is fixed. Using
this question as a guide, the cost of advertisements is normally
variable as a function of the number of advertisements. Note that
because the number of advertisements may not vary with the level of
sales, advertising cost may be fixed with respect to the cost driver
“level of sales.” Salaries of marketing personnel are a fixed cost.
Travel costs and entertainment costs can be either variable or fixed
depending on the policy of management. The key question is
whether it is necessary to incur additional travel and entertainment
costs to generate added sales.
2-25 The key to determining cost behavior is to ask, “If there is a
change in the level of the cost driver, will the total cost of the
resource change immediately?” If the answer is yes, the resource
cost is variable. If the answer is no, the resource cost is fixed. Using
this question as a guide, the cost of labor can be fixed or variable as
a function of the number of hours worked. Regular wages may be
fixed if there is a commitment to the laborers that they will be paid
for normal hours regardless of the workload. However, overtime
and temporary labor wages are variable. The depreciation on plant
and machinery is not a function of the number of machine hours
used and so this cost is fixed.
53
To download more slides, ebook, solutions and test bank, visit
2-26 Suggested value chain functions are listed below.
New Products
Marketing
R&D
Design
New Positioning
New Technology
Strategies
R&D
Marketing
Design
Support
functions
New Pricing
Marketing
2-27 (5 –10 min.)
Situation Best Cost Driver Justification
1.
Number of Setups Because each setup takes the same amount of
time, the best cost driver is number of setups.
Data is both plausible, reliable, and easy to
maintain.
2.
Setup Time
Longer setup times result in more consumption
of mechanics’ time. Simply using number of
setups as in situation 1 will not capture the
diversity associated with this activity.
3.
Cubic Feet
Assuming that all products are stored in the
warehouse for about the same time (that is
inventory turnover is about the same for all
products), and that products are stacked, the
volume occupied by products is the best cost
driver.
4.
Cubic Feet Weeks If some types of product are stored for more
time than others, the volume occupied must be
multiplied by a time dimension. For example, if
product A occupies 100 cubic feet for an
average of 2 weeks and product B occupies
only 40 cubic feet but for an average of 10
weeks, product B should receive twice as much
allocation of warehouse occupancy costs.
54
To download more slides, ebook, solutions and test bank, visit
2-28 (5-10 min.)
1.
Contribution margin = $900,000 - $500,000
Net income
= $400,000 - $350,000
2.
Variable expenses = $800,000 - $350,000 = $450,000
Fixed expenses
= $350,000 - $ 80,000 = $270,000
3.
Sales
Net income
= $600,000 + $340,000
= $340,000 - $250,000
55
= $400,000
= $ 50,000
= $940,000
= $ 90,000
To download more slides, ebook, solutions and test bank, visit
2-29 (10-20 min.)
1.
d
$720,000
b
f
=
=
=
=
=
c(a - b)
120,000($25 - b)
$19
d-e
$720,000 - $640,000 = $80,000
2.
d =
=
f =
=
c(a - b)
100,000($10 - $6) = $400,000
d-e
$400,000 - $320,000 = $80,000
3.
c =
=
e =
=
d ÷ (a - b)
$100,000 ÷ $5 = 20,000 units
d-f
$100,000 - $15,000 = $85,000
4.
d =
=
=
e =
=
c(a - b)
70,000($30 - $20)
$700,000
d-f
$700,000 - $12,000 = $688,000
5.
d
$160,000
a
f
=
=
=
=
=
c(a - b)
80,000(a - $9)
$11
d-e
$160,000 - $110,000 = $50,000
56
To download more slides, ebook, solutions and test bank, visit
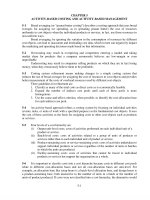
2-30 (10 min.)
$1,200,000
Dollars
$1,000,000
$800,000
$600,000
$400,000
$200,000
$0
0
50,000
100,000
150,000
Total Units Sold
Revenue
Fixed Cost
Variable Cost
Total Cost
Using the graph above, the estimated breakeven point in total units
sold is about 80,000. The estimated net income for 100,000 units sold
is $80,000 ($1,000,000 - $920,000).
57
To download more slides, ebook, solutions and test bank, visit
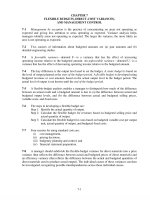
2-31 (10 min.)
$3,500,000
$3,000,000
Dollars
$2,500,000
$2,000,000
$1,500,000
$1,000,000
$500,000
$0
0
50,000
100,000
150,000
Total Units Sold
Revenue
Fixed Cost
Variable Cost
Total Cost
Using the graph above, the estimated breakeven point in total units
sold is about 65,000 (actual breakeven volume is 68,800). The
estimated net loss for 50,000 units sold is about $200,000 ($1,500,000
- $1,700,000). Actual net loss is $500,000 - $688,000 = $188,000.
58
To download more slides, ebook, solutions and test bank, visit
2-32 (20–25 min.)
Square
Feet
100,000
125,000
150,000
175,000
200,000
Labor
Cost
$24,000
24,000
24,000
24,000
24,000
Labor Cost per
Square Foot
$ 0.240
$ 0.192
$ 0.160
$ 0.137
$ 0.120
Supplies
Cost
$ 5,000
6,250
7,500
8,750
10,000
Supplies Cost
per Square Foot
$0.050*
0.050
0.050
0.050
0.050
* At 100,000 square feet on the second graph, the total supplies cost is $5,000
so the slope of the line is $0.05.
59
To download more slides, ebook, solutions and test bank, visit
Labor Cost per Square Foot
Labor Cost per Square Foot
$0.30
Fixed-Cost
per Unit
Behavior
$0.25
$0.20
$0.15
$0.10
$0.05
$100,000
125,000
150,000
175,000
200,000
Square Feet
Supplies Cost per Square
Foot
Supplies Cost per Square Foot
$0.06
$0.05
$0.04
$0.03
$0.02
Variable-Cost
per Unit
Behavior
$0.01
$100,000
125,000
150,000
175,000
Square Feet
60
200,000
To download more slides, ebook, solutions and test bank, visit
2-33 (20-25 min.)
Square
Feet
140,000
160,000
180,000
200,000
Labor Cost Per
Square Foot
(Estimated)
$0.13
0.11
0.10
0.09
Total
Labor
Cost*
$18,200
17,600
18,000
18,000
Supplies
Cost Per
Total Supplies
Square Foot
Cost
$0.06
$ 8,400
0.06
9,600
0.06
10,800
0.06
12,000
* The estimates for labor cost per square foot yield slightly different total
labor cost estimates. In the graph below, $18,000 is used.
61
To download more slides, ebook, solutions and test bank, visit
Total Labor Cost
Labor Costs
$20,000
$15,000
$10,000
$5,000
$140,000
160,000
180,000
200,000
Square Feet
Supplies Costs
Total Supplies Cost
$14,000
$12,000
$10,000
$8,000
$6,000
$4,000
$2,000
$140,000
160,000
180,000
Square Feet
62
200,000
To download more slides, ebook, solutions and test bank, visit
2-34 (10 min.)
1.
2.
Let TR
TR - .30(TR) -$42,000,000
.70(TR)
TR
=
=
=
=
total revenue
0
$42,000,000
$60,000,000
Daily revenue per patient = $60,000,000 ÷ 50,000 = $1,200. This may
appear high, but it includes the room charge plus additional charges for
drugs, x-rays, and so forth.
2-35 (15 min.)
1.
100% Full
50% Full
$7,300,000 a
$3,650,000 b
1,460,000
730,000
5,840,000
2,920,000
3,200,000
3,200,000
$2,640,000
$ (280,000)
Room revenue @ $50
Variable costs @ $10
Contribution margin
Fixed costs
Net income (loss)
a 400 x 365 = 146,000 rooms per year
146,000 x $50 = $7,300,000
b
2.
50% of $7,300,000 = $3,650,000
Let N
$50N -$10N - $3,200,000
N
Percentage occupancy
=
=
=
=
number of rooms
0
$3,200,000 ÷ $40 = 80,000 rooms
80,000 ÷ 146,000 = 54.8%
63
To download more slides, ebook, solutions and test bank, visit
2-36 (15 min.)
1.
$28. To compute this, let X be the variable cost that generates
$1 million in profits:
($48 - X ) x 800,000 - $15,000,000
= $1,000,000
($48 - X)= ($1,000,000 + $15,000,000) ÷ 800,000
$48 – X = $160 ÷ 8 = $20
X = $48 - $20 = $28
2.
Loss of $600,000:
($48 - $30) x 800,000 - $15,000,000
= ($18 x 800,000) - $15,000,000
= $14,400,000 - $15,000,000
= ($600,000)
2-37
(15-20 min.)
1.
Let R = pints of raspberries and 2R = pints of strawberries
sales - variable expenses - fixed expenses = zero net income
$1.00(2R) + $1.35(R) - $.65(2R) - $.85(R) - $14,400 = 0
$2.00R + $1.35R - $1.30R - $.85R -$14,400
= 0
$1.2R - $14,400
= 0
R = 12,000 pints of raspberries
2R = 24,000 pints of strawberries
2.
Let S = pints of strawberries
($1.00 - $.65) x S - $14,400 = 0
.35S - $14,400 = 0
S = 41,143 pints of strawberries
3.
Let R = pints of raspberries
($1.35 - $.85) x R - $14,400 = 0
$.50R - $14,400 = 0
R = 28,800 pints of raspberries
64