Consumer response on X2 coloured contact lens (A case study at PT alergan inti Indonesia in Jakarta as the of X2 coloured contact lens distributor)
Bạn đang xem bản rút gọn của tài liệu. Xem và tải ngay bản đầy đủ của tài liệu tại đây (829.62 KB, 18 trang )
Header Page 1 of 27.
VNU Journal of Science, Economics and Business 25, No. 5E (2009) 46-63
Consumer response on X2 coloured contact lens
(A case study at PT alergan inti Indonesia in Jakarta as the of
X2 coloured contact lens distributor)
PM. Budi Haryono*
Faculty Member of Christian University of Krida Wacana, Jakarta, Indonesia
Received 5 April 2009
Abstract. Branding has been around for centuries as a means to distinguish the goods of one
producer from those of another. A brand is a name, term, sign, symbol, or design, or a combination
of them, intended to identify the goods and services of one seller or group of sellers and to
differentiate them from those of competition, then, whenever a marketer creates a new name, logo
or symbol for a new product, he or she has created a brand. It should being recognized that many
practicing managers, however, refer to a brand as more than that, defining a brand in terms of
having actually created a certain amount of awareness, reputation, prominence, and so on in the
market place. The key to creating a brand is to be able to choose a name, logo, symbol, package
design, or other attribute that identifies a product and distinguishes it from others.
1. Introduction
contributed by the colored contact lens. In 2006,
the contact lens sales increase was 12.11% where
63.98% of it was the couloured type.
The introduction of the couloured contact
lens has affected the usage of coloured non
corrective lens, which means that contact lens
are no longer used only for people who has
eyesight problems, but it became a part of
fashion products or better said for cosmetic
purposes. The trend of using contact lens has
considerably increased, so there is a strong
competition between brands in the market.
A brand is very important asset for a
product, because it identity manifestation,
which can differentiate a certain product with
its competitor. Competitors can copy certain
brand features, but can not prevail with a same
name (brand). A brand for a product assists
customers in their buying decision process
since a certain brand, can be distinguished from
There are two types of contact lens products
that are widely distributed in Indonesia, which
is the colored and clear contact lens.
In 2003 - 2006, there was a significant growth
in the sales of those two types of contact lens.
With the fast changing fashion trend among the
youth, students, young executives and models,
artists and young housewifes in big cities such as
Jakarta, Bandung, Surabaya has been also an
increasing demand for the couloured contact lens.
This trend can be seen in Table 1, which show
that the sales in 2004 increased 22.8% compared
to the same period in 2003, as sales increase was
due to the popularity of the couloured contact
lens, which covers 49.48% of the market share. In
2005, there was an 11.64% increase in the total
contact lens market, and which 62.07% of it was
Footer Page 1 of 27.
46
Header Page 2 of 27.
B.Haryono / VNU Journal of Science, Economics and Business 25, No. 5E (2009) 46-63
other brands in the term of quality, customer
satisfaction, and can create a status symbol of
the users of attributes from a certain brand. A
brand plays an important role because it
accommodates consumer’s expectation in
buying a product, and besides creating an
emotional tie between the consumer and the
brand producer. Emotional ties are very
important for a company, because it can make a
customer buy a brand, rather than the product
itself. This trend is used by producers to grab
consumers' awareness in order to win the
positioning competition.
47
Realizing those factors above, in 2006, PT
Alergan Inti Indonesia the distributor of the X2
coloured contact lens was increasing it sales
until they reached in the 2nd position in the
coloured contact lens market. Since there are
other new contact lens brands entering the
market, PT Alergan Inti Indonesia has to
improve and maintain their brand strength. The
power of a brand can help a company to
overcome fierce competition, and with strong
brand, it will have strong brand equity. The
stronger brand equity a product has, the more
attractive it is to its consumer.
Table 1. Sales Market Share and Growth of the Soft Contact Lens Business in Indonesia 2003 - 2006
Type of
Contact
Lens
Qty
Share
Qty
Share
Qty
Share
Qty
Share
Durasoft
Clear
Clear
98200
18.20
71145
10.73
45746
6.18
48813
5.88
Acuvue Clear
Clear
209117
38.75
261396
39.44
221402
29.92
228221
27.51
Durasoft
Colour
Coloured
22950
4.25
30983
4.67
41862
5.66
52875
6.37
Freshlook
Coloured
116640
21.61
151200
22.81
237600
32.11
270655
32.63
Acuvue 2
Colour
Coloured
57240
10.61
69432
10.48
64800
8.76
68840
8.30
X2
Coloured
33792
6.26
48320
7.29
73848
9.98
89421
10.78
Freshkon
Fusion
Coloured
0
0.00
28000
4.22
41160
5.56
48963
5.90
Others
1689
0.31
2280
0.34
13488
1.82
21745
2.62
Total
539628
100
662756
100
739906
100
829533
100
Brand
Growth
(%)
2003
2004
22.82
2005
11.64
2006
12.11
Source: Association of Optical Business Indonesia
2. Conceptual Review
Brand
Branding a product is an important factor to
sustain a product life. A brand can be in the
form of a picture (symbol), a name, a written
statement or a mark that will create an identity
or a special feature/characteristic of a product,
Footer Page 2 of 27.
which differentiate it from a same product from
another producer. Branding is important to
maintain product competitiveness in the market.
A brand according to Aaker in his book
Managing Brand Equity (1991):
“A brand is a distinguishing name and/or
symbol (such as a logo, trademark, or package
designing intended to identify the goods or
Header Page 3 of 27.
48
B.Haryono / VNU Journal of Science, Economics and Business 25, No. 5E (2009) 46-63
services of either one seller or a group sellers,
an to differentiate those goods or services from
those of competitors”.
According to Kotler in Marketing
Management (2000), a brand is:
“Brand is a name, term, sign, symbol or
design or a combination of them, intended to
identify
the
“Brand is a name, term, sign,
goods
or
service of in symbol or design or a
seller or group combination of them, intended
of seller and to to identify the goods or service
of in seller or group of seller
differentiate
them
from and to differentiate them from
product
of product of competitors”.
Phillip Kotler
competitors”.A
s an identity a
brand can endow a significant impact for the
brand the producer and its consumer, a
competitor can offer a similar product but they
cannot offer the same emotional affirmation. In
other words, a brand is a seller’s promise to
give
constantly
a
certain
presentation/appearance, benefit, and service to
buyers. A good brand wills assure the quality
to a certain product.
According to Kotler in Marketing
Management (2000), a brand has six level of
understanding that is:
1. Attributes
A brand will endow an impact on a product,
for instance Mercedes, it present an image of
something expensive, best quality and design,
durable, fast, prestige.
2. Benefit
Brand is not only associated to attributes.
Customers do not buy attributes, they buy
benefits. Attributes must be developed into a
functional or an emotional benefit.
3. Value
Brand also expresses its producer’s values.
Mercedes is associated to high performance,
safety, prestige. The sales persons of the brand
Footer Page 3 of 27.
have to identify which groups of consumers are
interested in those values.
4. Culture
A brand represents a certain culture.
Mercedes represent the organized, efficient, the
high quality minded of the German culture.
5. Personality
A brand also represents a certain personality
that is the personality for its adherents/fanatic
users.
6. User
Brand will determine its consumer and user
group.
Brand
equity
“Brand equity is a set of
Brand
brand assets and liabilities
equity
linked to a brand, its name
according
to
and symbol that add to or
Aaker
in
subtract from the value
“Managing
Brand Equity” provided by a product or
service to a firm and/or to
(1991) is:
that firm’s customer”.
“Brand
Aaker
equity is a set
of brand assets
and liabilities linked to a brand, its name and
symbol that add to or subtract from the value
provided by a product or service to a firm
and/or to that firm’s customer”.
According to Aaker, brand equity has five
categories:
1. Brand awareness
The ability of a prospect buyer to remember
or recognizing a brand as a part of a certain
product category.
2. Brand association
The process of how a brand image can
create a certain impression for the buyers such
as habit, life style, product attribute, benefits,
price, status, competitor.
3. Perceived Quality
Create a perception in the consumer minds on
a certain quality/superiority of a product or service.
Header Page 4 of 27.
B.Haryono / VNU Journal of Science, Economics and Business 25, No. 5E (2009) 46-63
4. Brand Loyalty
The loyalty level of consumers to a certain
brand, which make them loyal to the product
and not easily attracted to another brand.
5. Other Brand Asset Property
Other brand assets such as trade mark,
patent rights. The first four element of brand
equity are the prominent factors of brand equity
while the fifth will get a direct impact from the
quality of the four prominent factors. The brand
equity concept will create values either for the
producer or for consumer.
The values will benefit the producer through:
a. Efficiency and affectivity in the company
marketing program
b. Consumer brand loyalty
c. Price or profit stability
d. Brand expansion
e. Trade increase/expansion
f. Competitive profit
The benefit of the values for the
customers/users is:
a. Will have a better interpretation or
information process
b. Be more confident from the buying
process
c. Getting more consumer satisfaction
Brand awareness
According to Aaker in “Managing Brand
Equity” (1991) Brand awareness is:
“Brand Awareness is the ability of a
potential buyer to recognize or recall that a
brand is a member of a certain product
category”.
Brand awareness is very important for a
company in order to get consumer’s loyalty,
which is the ability to ember and recognize a
brand of a certain product and the willingness
to buy it. Brand awareness means transferring
of a brand name in the consumer’s mind, which
in turn will play an important role in brand
equity. Improving brand awareness is one of the
Footer Page 4 of 27.
49
mechanisms to
enlarge brand
market,
and
brand
awareness can
influence
consumers’
perception and
behavior in a product buying process. Brand
awareness is the key to other brand equity
elements. Low brand awareness will certainly
cause a low brand equity. Below are the brand
awareness pyramided, from the lowest to the
highest:
1. Top of mind
Top of mind is the first brand that appears
on a respondent mind or which is spontaneously
remembered by a consumer for a certain
product category. Top of mind is a single
response question or a respondent can only give
one answer for the question.
2. Brand recall
Brand recall is how a respondent remembers
brands after recalling a brand in his/her mind.
Brand recall is a multi response question with an
unaided answer (unaided question).
3. Brand Recognition
Brand recognition is the minimal level of
brand awareness, where the respondents are
guided in giving an answer (aided question).
Product descriptions of the brand are given in
the questions. These questions are given to
measure the amount of respondents who needs
to be reminded of the existence of a certain
brand. Another tool besides questions to
measure customer brand awareness is through
photos of certain the brand, and usually this is
quite effective.
4. Brand Unaware
Brand Unaware is the lowest level of the
brand awareness pyramid. This is the situation
where consumers already forgot about the
existence of a brand. Brand unawareness can be
measured in a research of brand awareness, and
“Brand Awareness is the
ability of a potential buyer to
recognize or recall that a
brand is a member of a certain
product category”.
Aaker
Header Page 5 of 27.
50
B.Haryono / VNU Journal of Science, Economics and Business 25, No. 5E (2009) 46-63
a consumer answer that he/she does not know
or never knows the brand of a certain product in
a given picture.
3. How to achieve awareness
According to Aaker in Managing Brand
Equity (1991), brand recognition process
involves the recognition a name that is linked to
a product category. There are several ways to
reach and improve brand awareness:
1. Be different and memorable
The message must be simple, easy to
remember and different than others and yet a
connection between the brand and the product
category.
2. Involve a slogan or Jingle
Use an attractive slogan or a jingle that will
help customers to recognize and remember the
brand.
3. Symbol Exposure
If the product has a symbol, it must be
related to the brand, for example KFC with
Colonel Sanders.
4. Publicity
To strengthen brand awareness use an
appropriate
publicity that is Perceived Quality is “The
connected to the customer’s perception of
product
the overall quality or
category, brand superiority of a product or
or
both. service with respect to its
Publicity
is intended purpose relative
important
to alternatives”.
because it is
Aaker
cheaper
than
media
advertising.
5. Consider brand extensions
Brand extension is used to strengthen
consumer brand recognition amidst other
brands of the same category.
6. Sponsorship
Footer Page 5 of 27.
The main target of sponsorship is to
maintain brand awareness and showing the
existence of a brand.
7. Recall requires repetition
Repetition will stimulate recognition, since
building recognition is more complicated
compared to making an introduction. The
connection between the brand and product has
to be strong. Brand name must be prominent so
consumer will keep remember the brand even
the product has passed its prime time.
8. Recall bonus
To build a strong a consistent top of mind
recognition, the brand has to be able to block
the consumer mind in order not to remember
other brands.
Perceived quality
According to Aaker Perceived Quality is
“The customer’s perception of the overall
quality or superiority of a product or service
with respect to its intended purpose relative to
alternatives”. Quality perception is an important
dimension the brand equity since it can give the
following benefits
1. Reason to buy
Consumers are often unmotivated to get
objective information of a product quality
because the unavailability of the information it
self. Brand quality perception is important to
attract customer to buy. Brand quality
information will help customer to decide which
brand they are going to choose.
2. Differentiate/position
Brand characteristic will determine their
position through brand quality perception, will
it be in the super premium, premium, value of
money or economical. With quality perception
a brand will also be categorized as the best
product in the market or just being competitive
with other brands.
3. Price Premium
The benefit of quality perception is to give
choices in determining premium pricing.
Header Page 6 of 27.
B.Haryono / VNU Journal of Science, Economics and Business 25, No. 5E (2009) 46-63
Premium pricing will affect profit and resources
to reinvest in the brand.
4. Channel member interest
Quality perception is very important for
retailers, distributors and other channel
members, in order to offer products with high
quality perception with an attractive price and
controlling traffic distribution. Retailers are
motivated to distribute brands that are popular
among consumers.
5. Brand Extensions
Impression on quality can be exploited by
introducing brand extensions, launching a new
product category. A strong brand with respect to
perceived quality will have the ability to extend
father, and will attain a higher profitability
success compared to a weaker brand.
The dimensions that build quality perception
on a product, according to Aaker are:
1. Performance: involves the primary
operating characteristic of the product
2. Features: are secondary elements of
products, such as the type of VCR remote
control
3. Conformance with specifications: the
absence of defects, is a traditional manufacturing
oriented view of quality
4. Reliability: is the consistency of
performance from each purchase to the next.
And thump-time the percentage of time that the
product delivers an acceptable performance
5. Durability: reflects the economic life of
the product
6. Serviceability: reflects the ability to
service the product
7. Fit and finish: which refers to the appear
or feel of quality
Beside the dimensions above, there are
external elements that support product quality
such as the physical appearance/presentation of
the brand. While the dimensions of service
products, although almost the same said it still
has a difference in its product dimensions
Footer Page 6 of 27.
51
context compared to the contexts of the nonservice products.
Brand association
According to Aaker brand association is
anything linked in memory to a brand
Impression, which is associated to a brand,
will increase with consumers’ experiences in
consuming a brand or how often the brand is
introduced in its marketing communication
strategy. The impression will increase with the
support of other networks. The connection of
various brand association will create a brand
image. The greater factors are associated to a
brand, stronger the brand image is.
Brand association will create a brand image
that will affect consumer buying decision and
loyalty for a certain brand. In reality, there a lot
of variation of brand association that can add
value to a certain brand considered from either
the company or the consumer perspective.
Function association according to Aaker is:
1. Help process/retrieve information
Associations can accommodate facts and
specification that are difficult to be
access/comprehended by customers and which
can be expensive for the company to
communicate it. An associate can also give
solutions and handy information for consumers
of a certain brand.
2. Differentiate
An association can give important
reasons/grounds to make differentiations.
Association of two different brands plays an
important role to differentiate one and another.
Distinction associates can become an important
competitive advantage.
3. Reason to buy
A lot of brand association needs product
attributes or benefits that will attract customers
to buy or use the certain brand. This association
will become the base of buying decision or
brand loyalty. Some association will affect the
buying decision by creating credibility or
confidence of using the certain brand.
Header Page 7 of 27.
52
B.Haryono / VNU Journal of Science, Economics and Business 25, No. 5E (2009) 46-63
4. Create positive attitudes/feelings
Some association can stimulate positive
feeling for a certain brand. Some association
can create a positive feeling and create a
different experience when using a certain brand.
5. Basis for extension
An
association
can
become
the
consideration for a product extension by
generating a correlation between the brand and
a new product or by creating a reason for the
users to buy the extension product.
Associations that are involved in a brand
are usually connected to several brand
association types as according to Kotler (2000):
1. Product Attributes
Associate attributes or characteristic of a
product are frequently used as a positioning
strategy. This kind of association is effective
because if the attribute/ attributes are
significant, then the association can directly be
translated into an attention to buy a certain
product.
2. Intangible attributes
An intangible factor is a general attribute,
for instance quality perception, but factors as
technology advancement or value impression
can be considered as an objective attributes
3. Customer benefit
Because almost all products attributes give
benefits to the customers, so there is a close
relationship between the two. Benefits for the
customers can be categorized as follows:
a. Rational benefits, that is one or more
product attributes that can influence
the
rational decision making process
b. Psychological benefits, that is one or
more product attributes that can determine the
customer’s feelings when buying or using that
certain brand
4. Relative price
Evaluation on a certain brand in a product
class will start from brand positioning, which
Footer Page 7 of 27.
decide who are the users or customers of the
product.
5. Application
Associating a brand with the user or
customer type of the product.
6. User/Customer
Associating a brand with the user or
customer type of the product.
7. Celebrity Person
Using a celebrity or artist to endorse a brand
will deliver the association between the
celebrity and a product’s brand.
8. Life style/personality
Association of a brand with a certain life
style based on the life style, characteristic &
habits of the brand’s customer.
9. Product Class
Associating a brand with the product class.
10. Competitors
Recognizing the competitors and attempting
to be the same or surpassing the competitor.
11. Country/geographic area
A country can become a strong symbol
when it has a strong relation with a product, an
ingredient or a competency.
Brand loyalty
According to Aaker, brand loyalty is a
measure of the attachment that a customer has
to a brand
Brand loyalty is the core of brand equity,
which is the central idea of marketing, since it
is the adherence of a customer to a certain
brand. If their loyalty increases then their
vulnerability to competitors product influence
can be decreased. Brand loyalty can be used as
an indicator of the future profit in brand equity,
since
brand
loyalty can be “Brand loyalty is a measure
associated to the of the attachment that a
customer has to a brand”.
future sale.
Aaker
Brand loyalty
can also be used,
Header Page 8 of 27.
B.Haryono / VNU Journal of Science, Economics and Business 25, No. 5E (2009) 46-63
as a measurement of the possibility of a
customer will switch to another product,
especially when there are changes such as in
price or other attributes of the brand.
A very loyal customer of a brand will not
easily switch to another brand, although there
are changes in the brand
Brand loyalty is one of the indicators that
are directly connected with sales opportunity
and up coming profit of a company. A loyal
customer usually will still buy a certain brand
although there is many competitors’ alternative
brand with better attributes characteristic. If
brand loyalty is strong, then the brand has
strong brand equity.
A disloyal customer usually buy a brand not
because their attachment to a certain brand, but
rather to the product characteristic, price, usage
comfort or other attributes offered by the
alternative product. If most of the customer of
this brand is in this category, there is a
probability that this brand is weak.
Satisfaction is a direct measurement tool to
know consumers’ loyalty to a certain brand, and
is an important tool to measure service
products. As satisfaction is a measurement,
loyalty is the accumulation of usage experience
of a product. There are several stages in brand
loyalty. Each stage shows the level of
marketing challenge and an asset that needed to
be developed.
According to Aaker brand loyalty are as
follows:
1. Switcher/price buyer
The lowest loyalty level, they are
consumers who often switches from one brand
to another and are identified as disloyal. They
consider any brand is good, because other
people were also buying it and it is cheap.
2. Habitual buyer
Footer Page 8 of 27.
53
A consumer who is satisfied with a
product/brand, there is no strong reason for
him/her to buy another brand or switch brand
especially when it needs effort, cost or other
sacrifices. So they buy a certain brand because
of it is just a habit or because they are accustom
to the certain brand/ product.
3. Satisfied buyer
A buyer who is satisfied with the brand which
he/she consumes, but there is a possibility that
he/she will switch by risking the switching cost,
such as time, cost and risks that occur because of
the change. Offering products with multi benefits
can attract this kind of buyer.
4. Likes the brand
Consumers really like the brand. The
fondness is build because of the symbol.
Experiences in using the brand either selfexperience or other people’s experience, or
because of the high quality perspective
5. Committed buyer
Loyal consumers are buyers who have
pride in using a certain brand. A brand will
become very important either from its function
or as an expression of who is the user. Users of
this category will recommend/promote the
brand he/she are using.
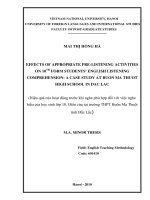
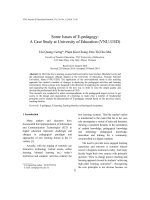
From the description above, brands with no
strong brand, equity will have more consumers
from the switcher category. The next portion is
the habitual consumer, and the smallest portion
is the committed buyer. As in Picture 1 of
Loyalty Pyramid.
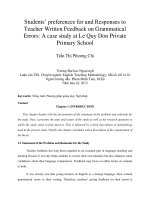
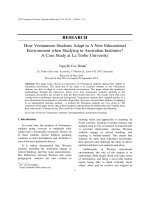
Brands with strong brand equity to have its
types of buyers the form of an upturned
pyramid as in Picture 2 the Upturned Loyalty
Pyramid, the committed buyer segment have to
be bigger than in the switcher type.
Header Page 9 of 27.
54
B.Haryono / VNU Journal of Science, Economics and Business 25, No. 5E (2009) 46-63
Committed
Buyer
Liking the Brand
Satisfied Buyer
Habitual Buyer
Switcher
Figure 1. Loyalty Pyramid.
Committed Buyer
Liking the Brand
Satisfied Buyer
Habitual Buyer
Switcher
Figure 2. Upturned Loyalty Pyramid.
Brand loyalty will not be achieved if there
is or introduction from if there is no buying
transaction and product usage by consumer.
According to Aaker, brand loyalty can be reach
with several approaches as follows:
1. Consumer satisfaction measurement on a
certain brand
Measurement
of
satisfaction
and
unsatisfied feedback from users. The main
target of this loyalty measurement is to know
how great the unsatisfactory level of the
customer toward a brand is. Questionnaires are
recommended to be used in this type of survey
to get accurate results.
2. Liking of the Brand
Measurement on the fondness or favoritism
level of consumers to a certain brand. Some
Footer Page 9 of 27.
variables of the measurement questionnaire are
liking, respect, friendship and trust.
3. Commitment
A strong brand will have a strong customer
base. One of the key indicators of a substantial
bond between the customer and the brand,
among others is the frequency of customer product interaction, and the effectiveness of
word of mouth.
4. Behavior Measurement
Behavior measurement is a direct way to
see customer loyalty, especially loyalty in
consumer buying pattern. Consumer loyalty can
drastically change depending on the number of
competitor’s products in the market.
Header Page 10 of 27.
B.Haryono / VNU Journal of Science, Economics and Business 25, No. 5E (2009) 46-63
4. Research Methodology
Research is done through randomly
distributed questionnaires in the period of 2003
- 2006 in Jakarta and Bandung.
55
Sales
Promotion
Girls
distribute
questionnaires on Sundays during exhibition in
malls, inshore promo at optical. The target of
this purposive survey are colour contact lens
users with the following form of questionnaire:
K;;uồgjh
Free X2 Sunglass for your feedback!
Thank you for allocating your time to fill this questionnaire.
Name:
Mobile No/Tell
Age :
Gender: Male/ Female (please cross the unneeded)
Education:
Help us to serve you better by answering questions regarding X2 and the same types of products that are
available in the market.
1. Mentioned one contact lens brand which you remember spontaneously
a. Freshlook
d. Freshkon
b. Acuvue Color
e. Durasoft
c. X2
2. Did you ever use contact lenses from another brand besides the one you are wearing now?
a. Yes
b. Never
3. How long have you been using X2 contact lens?
a. < 1 year
b. 1 - 2 years
c. > 2 years
4. Where did you get information about X2 from?
a. Magazine
d. Optic
b. Radio
e. Exhibition
c. Friend
f. Others, mentioned ……..
5. Is the available colours of X2 matched your skin characteristic?
a. Yes
b. No
6. Does the product specification of X2 meet your requirements and comfortable for your eyes?
a. Yes
b. No
7. According to you, is the X2 product affordable?
a. Yes
b. No
8. Do you already know X2 Contact lens?
a. Yes
b. No
9. According to you, does X2 have a complete range of contact lens care?
a. Yes
b. No
10. Do you think the X2 promotion is attractive?
a. Yes
b. No
Questionnaire Questions
Colored soft lens that match Indonesian Woman characteristic
a. Freshlook
b. Acuvue
c. X2
d. Freshkon
The easy to remembered brand according to you is
a. Freshlook
b. Acuvue
c. X2
d. Freshkon
The most comfortable lens according to you is
Footer Page 10 of 27.
DA
SD
D
SA
AV
Header Page 11 of 27.
56
B.Haryono / VNU Journal of Science, Economics and Business 25, No. 5E (2009) 46-63
a. Freshlook
b. Acuvue
c. X2
d. Freshkon
According to you the most affordable contact lens is:
a. Freshlook
b. Acuvue
c. X2
d. Freshkon
According to you which product has the most accessible information
a. Freshlook
b. Acuvue
c. X2
d. Freshkon
Which product is easily found in optics
a. Freshlook
b. Acuvue
c. X2
d. Freshkon
According to you which product is most durable
a. Freshlook
b. Acuvue
c. X2
d. Freshkon
According to you which product has the complete care range
a. Freshlook
b. Acuvue
c. X2
d. Freshkon
The most attractive promotion is from
a. Freshlook
b. Acuvue
c. X2
d. Freshkon
kkk
Note: DA = do not agreed at all
SA = slightly agreed
SD = slightly disagreed
AVM = agreed very much
D = disagreed
To get a clear description of the condition
of each variable, descriptive analytical method
issued in evaluating the research results.
The analyzed aspects are:
1. Brand awareness
Is to measure respondent’s impulsive
recognition of a colored contact lens’ brand.
2. Brand Association
Footer Page 11 of 27.
To analyze respondent impression on X2
coloured contact lens from the point of its
characteristic.
3. Perceived Quality
To analyze respondents response on the ten
characteristic of perceived quality from X2
coloured contact lens.
5. Sample determination
Sample is taken randomly from the total
5003 questionnaires responses, but only 11%
from the total are valid responses and it
represent each period from 2003 - 2006. Total
Header Page 12 of 27.
B.Haryono / VNU Journal of Science, Economics and Business 25, No. 5E (2009) 46-63
there are 300 responses that will be analyzed.
See Table 2 for result.
Average:
Average (x) is the middle score of answers
chosen by respondents
6. Likert scale, means (average), variants and
deviation standard
Likert scale is a scaling procedure where
the scales represent a bipolar continuum?
At the left side with a low score shows
negative answers, while at the right end with
high score shows positive answers so
respondent could answer according to their
perception/ satisfaction to a certain question.
Likert score are as follows:
Scale score:
1 = do not agreed at all
2 = disagreed
3 = slightly
4 = slightly agreed
5 = agreed very much
57
X
Fi Xi
n
Where:
X = average
Fi = frequency
Xi = weight value or respondent’s answer
score
N = number of respondents
Variant and deviation standard
To measure the average level of the mean of
each value (X1)
S2
2
1
Xi X 2 , S S
n 1
Where S2 = variant, S = deviation standard
Table 2. Respondent data, quantity of sample respondent of X2 couloured contact lens
Periode
Promo
Quarter 1
Quarter 2
Quarter 3
Quarter 4
Total
% Valid
Qty sample
(11%)
2003
Respondent Valid
225
144
173
93
280
151
335
204
1.013
593
59
2004
Respondent Valid
320
176
288
187
257
149
377
189
1.242
701
57
65
2005
Respondent Valid
231
116
375
195
405
182
413
198
1.424
691
49
77
2006
Respondent Valid
361
188
285
171
477
253
201
127
1.324
738
56
76
82
dhhj
Result and discussion
Below is some information about the
respondent profile in this survey:
1. Gender
In the table 3, there are 300 respondents,
297 respondents or 99% are female, and 3
respondent or 1% are male.
Footer Page 12 of 27.
Table 3. Gender
Description
Frequency
%
Female
297
99.0
Male
3
1.0
Total
300
100.0
2. Age
In the table 4, folowing respondent profile
according to age, most respondents are in the
Header Page 13 of 27.
58
B.Haryono / VNU Journal of Science, Economics and Business 25, No. 5E (2009) 46-63
age group of 18 - 25 that are 249 from 300
respondents or 83%.
Table 4. Age
Description
18 - 25 years
26 - 30 years
31 - 35 years
36 – 40 years
> 40 years
Total
Frequency
249
39
9
3
0
300
%
83.0
13.0
3.0
1.0
0.0
100.0
3. Education back ground
Table 5 the education background of
respondents, mostly had High School education,
which is 153 from 300 respondents or 51%.
Table 5. Education
Description
Secondary School
High school
Diploma
Under graduate
Master
Total
Frequency
0
153
9
3
0
300
%
0.0
51.0
3.0
1.0
0.0
100.0
Brand Awareness Analysis
Table 6, 7, 8 and 9 show the Brand
Awareness of the couloured X2 contact lens.
Table 6. The Spontaneous Reaction on Brand
Recognition
Description
Freshlook
Acuvue Color
X2
Freshkon
Durasoft
Total
Frequency
96
156
32
16
0
300
%
32.0
52.0
10.7
5.3
0.0
100.0
From the survey 156 respondents or around
52% from 300 respondents said that coloured
contact lens Acuvue Color was the first brand
they spontaneously remember, no one mention
Durasoft as the brand which they spontaneously
remembered.
Footer Page 13 of 27.
Table 7. The Usage of Other Brand than X2
Description
Yes
Never
Total
Frequency
178
122
300
%
59.3
40.7
100.0
From the survey most respondents have
used other colored contact lens other than X2,
which consists 178 respondent or 59.3% out of
300 respondents. While 122 respondents or
40.7% said that, they never used another brand.
Tabel 8. Period of using X2
Description
< 1 year
1 - 2 years98
> 2 years
Total
Frequency
62
140
300
%
20.7
32.7
46.7
100.0
From the survey, 140 respondents or 46.7%
from 300 respondents has used X2 coloured
contact lens more than 2 years, 62 respondents
or 2.0% has used less than 1 year or only for
certain occasions.
Table 9. Information source for X2
Description
Magazine &
Brochure
Radio Ad
Friends
Optic
Exhibition
Others
Total
Frequency
24
%
8.0
0
75
126
69
6
300
0.0
25.0
42.0
23.0
2.0
100.0
From the survey 128 or 42.0% from 300
respondents answered that they gained
information from optics, no respondent have the
information of the brand from advertisement or
radio.
Brand Association Analysis
Next are the tables showing the Brand
Analysis of the X2 coloured contact lens.
Header Page 14 of 27.
B.Haryono / VNU Journal of Science, Economics and Business 25, No. 5E (2009) 46-63
Table 10. The contact lens colour matched the
Indonesian Women skin tone character
Description
Yes
No
Total
Frequency
236
64
300
59
From the survey, 210 or 70% agreed that
X2 contact lens are popular coloured contact
lens, while 90 respondents said that it is
unpopular.
%
78.7
21.3
100
Table 14. Complete variant and types
From the survey 236 or 78.7% from 300
respondents agreed that the colour of the X2
contact lens match with their skin characteristic,
while 64 respondents or 21.3% disagreed.
Description
Yes
No
Total
Frequency
213
87
300
%
71.0
29.0
100
Table 11. Usage Comfort
Description
Yes
No
Total
Frequency
216
84
300
From the survey, most respondent that is
213 or 71% stated that X2 have a complete
variant of types, while 87 or 29% disagreed.
%
72.0
28.0
100
Table 15. Interesting promotion
From the survey, 216 or 72% from 300
respondents agreed that X2 contact lens are
comfortable for the eyes while 84 or 28% disagreed.
Description
Yes
No
Total
Table 12. Affordable Price
Description
Yes
No
Total
Frequency
270
30
300
%
90.0
10.0
100
Table 13. A Popular Brand
Frequency
210
90
300
%
85.7
14.3
100
From the survey 257 or 865.7% agreed that
X2 promotion is interesting while 43 or 14.3%
disagreed and find it uninteresting.
Perceived Quality Analysis
To know the Perceived Quality of X2
coloured contact lens questionnaire’s answers
are measured with the Likert scale from1 to 5
for answers : do not agreed at all (DA),
disagreed. Slightly (D), disagreed (D), slightly
agreed (SA), agreed very much (AVM).
From the survey 270 or 90% from 300
respondents agreed that the selling price of X2
colour contact lens is affordable, while 30
respondents or 10% stated that the selling price is
unaffordable.
Description
Yes
No
Total
Frequency
257
43
300
%
70.0
30.0
100
Table 16. The contact lens colour matched the Indonesian Women skin tone character
Question:
Coloured soft lens that match
Indonesian Woman characteristic
a. Freshlook
b. Acuvue
c. X2
d. Freshkon
Total Respondent
lk
Footer Page 14 of 27.
DA
SD
D
SA
AVM
Score
Mean
12
1
2
4
19
35
7
4
12
58
16
31
22
27
96
10
23
34
24
91
3
12
12
8
36
185
260
277
245
967
0.62
087
0.92
0.82
Total
300
Header Page 15 of 27.
60
B.Haryono / VNU Journal of Science, Economics and Business 25, No. 5E (2009) 46-63
As seen in the table above, X2 coloured contact lens has a score of 277 or 28.6% from the
respondents who agreed that the contact lens match with the Indonesian woman skin colour that is
ivory to dark brown.
Table 17. Easy to remember Brand
Question:
Easy to remember brand
a. Freshlook
b. Acuvue
c. X2
d. Freshkon
Total Respondent
DA
SD
D
SA
AVM
Score
Mean
0
0
3
7
10
0
0
7
9
16
9
9
3
6
27
35
20
25
30
110
31
47
37
22
137
322
342
311
273
1248
1.07
1.14
1.04
0.91
Total
300
The table above shows that X2 contact lens has a score of 3131 or 24.9% on the question of how
easy is the brand to be remembered, or more familiar compared to the others, which has entered
Indonesia since 1998.
Table 18. Usage Comfort
Question:
A comfortable to use contact lens
a. Freshlook
b. Acuvue
c. X2
d. Freshkon
Total Respondent
DA
SD
D
SA
AVM
Score
Mean
0
0
3
2
5
1
2
6
5
14
5
10
9
26
52
50
46
46
30
172
19
15
12
11
57
312
299
286
265
1162
1.04
1.00
0.95
0.88
Total
300
As seen at the table above, X2 contact lens has gain a score of 285 or 29.6% regarding usage
comfortability, because it uses a different type of the silicon as its main material.
Table 19. Affordable Price
Question:
Affordability
a. Freshlook
b. Acuvue
c. X2
d. Freshkon
Total Respondent
DA
SD
D
SA
AVM
Score
Mean
17
12
0
0
29
8
11
0
1
20
41
46
8
12
107
9
6
62
48
115
0
0
16
13
29
192
196
312
295
995
0.64
0.65
1.04
0.98
Total
300
From the table above, X2 contact lens get a score of 312 or 31.4% agreed that the price is
affordable for the product quality.
Table 20. Product Information Accessibility
Question:
Product Information Accessibility
a. Freshlook
b. Acuvue
c. X2
d. Freshkon
Total Respondent
Footer Page 15 of 27.
DA
SD
D
SA
AVM
Score
Mean
0
0
0
0
0
0
0
0
0
0
14
8
13
16
49
30
26
35
32
123
30
44
27
27
128
321
342
314
311
1279
1.04
1.14
1.05
1.04
Total
300
Header Page 16 of 27.
B.Haryono / VNU Journal of Science, Economics and Business 25, No. 5E (2009) 46-63
61
As seen in table 20, X2 contact lens has a score of 314 or 24.6% agreed that it is relatively easy to
get X2 product information from its website, print media, optical information and articles in health
magazines.
Table 21. Product availability at Optics
Question:
Product availability at optics
a. Freshlook
b. Acuvue
c. X2
d. Freshkon
Total Respondent
DA
SD
D
SA
AVM
Score
Mean
4
4
4
9
21
3
5
4
6
18
15
2
6
3
26
30
32
31
29
122
24
30
31
28
113
295
298
309
286
1188
0.98
0.99
1.03
0.95
Total
300
In table 21, X2 contact lens get a score of 309 or 26.0% who agreed that it is quite easy to find the
product at any optics, while others are only available at certain optics.
Table 22. Product Durability
Question:
Product Durability
a. Freshlook
b. Acuvue
c. X2
d. Freshkon
Total Respondent
DA
SD
D
SA
AVM
Score
Mean
9
19
0
0
28
24
24
1
0
49
40
30
4
3
77
1
2
45
42
90
0
0
26
30
56
181
165
324
327
997
0.60
0.56
1.08
Total
300
As seen in the table above, X2 contact lens has the score of 324 or 32.5% agreed on the product
durability of 3 - 6 months compared to others, which is only below 1 month.
Table 23. Accessories & contact lens care availability
Question:
Accessories & contact lens care availability
a. Freshlook
b. Acuvue
c. X2
d. Freshkon
Total Respondent
DA
SD
D
SA
AVM
Score
Mean
8
9
0
3
20
11
20
0
0
31
22
29
9
32
92
30
21
37
20
108
5
0
30
14
49
241
220
325
249
1035
0.50
0.73
1.08
0.83
Total
300
In table 23, X2 contact lens get the score of 325 or 31.4% agreed that the product has a complete
range of accessories/contact lens care such as, contact lens cleanser, protein solvent solution, contact
lens eye drops, soaking agent solution and other accessories.
Table 24. Attractive Promotion
Question:
Attractive Promotion
a. Freshlook
b. Acuvue
c. X2
d. Freshkon
Total Respondent
Footer Page 16 of 27.
DA
SD
D
SA
AVM
Score
Mean
4
3
1
2
10
20
16
1
5
42
27
26
1
22
78
17
19
47
26
109
5
11
26
21
63
218
244
324
267
1073
0.73
0.81
1.08
0.96
Total
300
Header Page 17 of 27.
62
B.Haryono / VNU Journal of Science, Economics and Business 25, No. 5E (2009) 46-63
In table 24 X2 contact lens get the score of 324 or 30.2% agreed that X2 has an attractive
promotion package with accessories and contact lens care bonuses.
The compilation of the survey result from four colour contact lens brands on quality character can
be read in Table 25.
Table 25. Quality Characteristic Comparison of four colour contact lens brands
Quality Characteristic
Fresh Look
Acuvue Color
X2
Freshkon
Matching color with Indonesian Women skin colour
characteristic
0.62
0.87
0.92
0.82
Easy to remember brand
1.07
1.14
1.04
0.91
Comfort Usage
0.64
0.65
1.04
0.98
Affordable price
1.04
1.14
1.05
1.04
Product Information accessibility
0.96
0.99
1.03
0.95
Product availability at optics
0.60
0.55
1.08
1.09
Product Durability
0.80
0.73
1.08
0.83
Accessories & contact lens care availability
0.73
0.81
1.08
0.96
Attractive Promotion
0.73
0.81
1.08
0.96
Means
0.84
0.88
1.03
0.94
y
5. Conclusion and Recommendation
Conclusion
1. Brand Awareness:
Only 10.7% respondent stated that contact
lens X2 is the first brand that they recall. 52%
mentioned Acuvue and 32% for Freshlook. As
a conclusion, X2 has not yet a become strong
brand that is easily remembered by colour
contact lens users, it is only positioned at the
third rank after Acuvue and Freshlook.
2. Brand Association:
60% respondents agreed to the six aspects
of brand association or confirm their good
impression on X2 contact lens according to its
characteristics.
3. Perceived Quality
X2’s Respondents give a positive response
that is 1.03 to the nine characteristic of perceived
quality, while Freshkon, Acuvue and Freshlook,
get a means of 0.94, 0.88 and 0.84 consecutively,
and it means that those three brands get less
positive response from the respondents.
Recommendation
Footer Page 17 of 27.
From the survey above, there are several
recommendations:
1. X2 coloured contact lens increase their
brand promotion through printed or electronic
media, in order to get more exposure and
recognition from contact lens users
2. Increase X2 coloured contact lens
publicity through seminars for opticians,
exhibition, continuous in store promo.
3. Develop research and development to get
a better quality comfortable and hygienic colour
contact lens. That specification can be met by
using a higher quality, more flexible and soft
silicone that can absorb more oxygen.
References
[1] Aaker, David A (1991), “Managing Brand
Equity”, The Free Press, New York, USA.
[2] Ambadar (2007), Jackie, Miranty Abidin, Yanty
Isa, “Mengelola Merk” ,Yayasan Bina Karsa
Mandiri, Jakarta, Indonesia.
[3] Keller, Kevin Lane (2003), “Strategy Brand
Management”, Pearson Education, Inc.Upper
Saddle River, New Jersey, USA.
Header Page 18 of 27.
B.Haryono / VNU Journal of Science, Economics and Business 25, No. 5E (2009) 46-63
[4] Kotler, Philip (2000), “Marketing Management:
Analysis, Planning, Implementation and Control”,
Prentice Hall, Int.Inc, New Jersey, USA.
[5] Kotler Philip Hermawan Kartajaya, Hooi Den
Huan, Sandra Liu
(2003), “Rethinking
Marketing”, PT.Prenhallindo, Jakarta, Indonesia.
[6] Moven, John C (1995), Consumer Behavior, Prentice
Hall, Inc, Englewood Cliffs, New Jersey, USA.
[7] Rangkuti, Freddy (2004), The Power of Brands,
PT Gramedia Pustaka Utama, Jakarta, Indonesia.
Footer Page 18 of 27.
63
[8] Schiffman, Leon G & Leslie Lazar Kanuk (2004),
Consumer Behavior, Pearson Education, Inc,
Upper Saddle River, New Jersey, USA.
[9] Sulaksana, Uyung (2003), Integrated Marketing
Communication, Pustaka Pelajar, Yogyakarta,
Indonesia.
[10] Taylor, David (2006), Brand Vision, John Wiley
& Son, Ltd. West Sussex, England.
[11] Tjiptono, Fandy (2005), Brand Management &
Strategy, Penerbit Andi, Yogyakarta, Indonesia.