Organic spectroscopy by LDS yadav
Bạn đang xem bản rút gọn của tài liệu. Xem và tải ngay bản đầy đủ của tài liệu tại đây (9.71 MB, 334 trang )
ÜRGANIC SPECTROSCOPY
Organi c
Spectro scopy
L.D.S. Yadav
Professor
Department of Chemistry
University of Allahabad
Allahabad-211 002, India
.....
••
Springer-Science+Business Media, B.V.
A C.l.P. catalogue record for the book is available from the Library of Congress
ISBN 978-94-017-2508-8
ISBN 978-1-4020-2575-4 (eBook)
DOI 10.1007/978-1-4020-2575-4
All rights reserved
Copyright © 2005 Springer Science+Business Media Dordrecht
Originally published by Kluwer Academic Publishers in 2005
Softcoverreprint ofthe bardeover 1st edition 2005
No part of the material protected by this copyright notice may be reproduced or utilized in
any form or by any means, electronic or mechanical, including photocopying, recording or
by any inforrnation storage and retrieval system, without written permission from the copyright
owner.
Preface
Nowadays spectoscopy is being used as the most popular technique for structure
determination and analysis. Thus, the knowledge of spectroscopy has become
necessary for all the students of organic chemistry. The present book is an
attempt to give the students the benefit of my over three decades experience of
teaching and research. The book deals with UV, visible, IR, Raman, 1H NMR,
13C NMR, ESR and mass spectroscopy along with an introduction to the subject,
and spectroscopic solution of structural problems.
The subject matter has been presented in a comprehensive, lucid and systematic
manner which is easy to understand even by self-study. I believe that learning by
solving problems gives more competence and confidence in the subject. Keeping
this in view, sufficient number of solved and unsolved problems are given in
each chapter. The answers to the unsolved problems at the end of the book are
to check the solution worked out by the students.
The book contains sufficient spectral data in the text, tables and figures. In
addition, a !arge number of spectra of various compounds have been incorporated
for the students to see how the spectra actually appears. The spectral data and
spectra tagether would help the reader familiarize with the interpretation.
In compiling this book I have drawn information from various sources available,
e.g. review articles, reference work on spectroscopy, spectral catalogues and
numerous books. Although individual acknowledgment cannot be made, I feel great
pleasure in recording my indebtedness to all the contributors to the above sources.
I express my heartfelt gratitude to Prof. H.P. Tiwari, form er Head, Department
of Chemistry, University of Allahabad, who was kind enough to spare time from
his busy schedule to go through the book and grateful to Prof. J.D. Pandey,
former Head, Department of Chemistry, University of Allahabad, for his valuable
discussion, especially on Raman Spectroscopy. I express my deep sense of gratitude
to Prof. J.P. Sharma for his discussion and suggestions on various aspects of the
subject and sincerely thank Prof. J.S. Chauhan and Prof. K.P. Tiwari for their
gracious help and encouragement. I am also thankful to aii my dear coiieagues,
particularly Prof. J. Singh, Dr. A.K. Jain, Dr. R.K.P. Singh and Dr. I.R. Siddiqui
for their readily available help in many ways, and to the research scholars
Mr. B.S. Yadav and Mr. V.K. Rai who proof read the entire manuscript.
I highly appreciate the work of publishing staff of M/s Anamaya Publishers,
especially that of Mr. Manish Sejwal, who handled the project promptly and
intelligently.
I hope that the book will be useful and successful in its objectives and will
gratefully acknowledge any suggestions and comments from the readers for
further improvements.
L.D.S. Yadav
Contents
Preface
V
1. Introduction to Spectroscopy (Spectrometry)
1.1 Spectroscopy and Electromagnetic Radiations 1
1.2 Characteristics of Electromagnetic Radiations 1
1.3 Solved Problems 2
1.4 Electromagnetic Spectrum 4
1.5 Absorption and Emission Spectra 5
Problems 6
References 6
1
2.
7
Ultraviolet (UV) and Visible Spectroscopy
2.1 Introduction 7
2.2 Absorption Laws and Molar Absorptivity 7
2.3 Instrumentation 8
2.4 Sampie Handling 9
2.5 Theory (Origin) of UV-Visible Spectroscopy 9
2.6 Electronic Transitions 9
2.7 Formation of Absorption Bands 12
2.8 Designation of Absorption Bands 13
2.9 Transition Probability: Allowed and Forbidden
Transitions 14
2.10 Certain Terms Used in Electronic Spectroscopy:
Definitions 15
2.11 Conjugated Systemsand Transition Energies 17
2.12 Solvent Effects 18
2.13 Woodward-Fieser Rules for Calculating Amax in
Conjugated Dienes and Trienes 20
2.14 Polyenes and Poly-ynes 26
2.15 Woodward-Fieser Rules for Calculating Amax in
a,ß-Unsaturated Carbonyl Compounds 27
2.16 Dicarbonyl Compounds 32
2.17 a,ß-Unsaturated Carboxylic Acidsand Esters 34
2.18 Benzene and Its Derivatives 34
2.19 Polynuclear Aromatic Compounds 40
2.20 Non-benzenoid Aromatic Compounds 42
2.21 Heteroaromatic Compounds 42
2.22 Applications of Ultraviolet and Visible Spectroscopy 43
Problems 46
References 50
viii
+ Contents
3. Infrared (IR) Spectroscopy
52
Introduction 52
Instrumentation 52
Sampie Handling 54
Theory (Origin) of Infrared Spectroscopy 55
Number of Fundamental Vibrations 58
Calculation of Vibrational Frequencies 61
Factors Affecting Vibrational Frequencies 62
Characteristic Absorptions in Common Classes of
Compounds 67
3.9 Fingerprint Region 92
3.10 Applications of Infrared Spectroscopy 92
3.11 Interpretation of Infrared Spectra 94
3.12 Some Solved Problems 96
Problems 100
References 105
3.1
3.2
3.3
3.4
3.5
3.6
3.7
3.8
4. Raman Spectroscopy
4.1
4.2
4.3
4.4
4.5
4.6
4.7
4.8
4.9
4.10
4.11
4.12
4.13
4.14
4.15
4.16
5. Proton Nuclear Magnetic Resonance
(PMR or 1H NMR) Spectroscopy
5.1
5.2
5.3
5.4
5.5
5.6
107
Introduction 107
Raman Effect and Origin of Raman Spectroscopy 107
Theories of Raman Effect and Raman Spectroscopy 109
Zero-Point Energy 113
Vibrational Raman Spectra 114
Pure Rotational Raman Spectra 115
Types of Molecules and Rotational Raman Spectra 116
Vibrational-Rotational Raman Spectra 117
Polarization of Raman Lines 118
Rule of Mutual Exclusion 118
Instrumentation 119
Sampie Handling 121
Applications of Raman Spectroscopy 121
Difference Between Raman and Fluorescence Spectra 124
Difference Between Raman and IR Spectra 124
Some Solved problems 125
Problems 129
References 132
Introduction 133
Theory 133
Instrumentation 140
Sampie Handling 141
Shielding, Deshielding and Chemical Shift 142
Measurement of Chemical Shift: NMR Scale 144
133
Contents
5.7
5.8
5.9
5.10
5.11
5.12
5.13
5.14
5.15
5.16
5.17
5.18
5.19
5.20
5.21
6.
13
+ ix
Factors Affecting ehemical Shift 145
Number of PMR Signals: Equivalent and Nonequivalent
Protons 153
Peak Area and Proton eounting 156
Spin-Spin Splitting: Spin-Spin eoupling 157
eoupling eonstant (J) 164
Analysis (Interpretation) of NMR Spectra 168
Nomenclature of Spin Systems 170
Magnetic Equivalence 172
Spin-Spin eoupling of Protons with Other Nuclei 172
Protons on Heteroatoms: Proton Exchange Reactions 174
Simplification of eomplex NMR Spectra 176
Nuclear Overhauser Effect (NOE) 181
Applications of PMR Spectroscopy 181
eontinuous Wave (eW) and Fourier Transform (FT)
NMR Spectroscopy 184
Some Solved Problems 184
Problems 190
References 194
C NMR Spectroscopy
195
6.1
6.2
6.3
6.4
6.5
6.6
6.7
Introduction and Theory 195
Sampie Handling 196
eommon Modes of Recording Be Spectra 196
ehemical Shift Equivalence 199
Be ehemical Shifts 202
Factors Affecting 13e ehemical Shifts 203
Be ehemical Shifts (ppm from TMS) of Some
eompounds 211
6.8 Spin-Spin eoupling 212
6.9 Effect of Deuterium Substitutionon eMR Signals 213
6.10 Use of Shift Reagents 214
6.11 Applications of eMR Spectroscopy 214
6.12 Some Solved Problems 215
Problems 220
References 223
7. Electron Spin Resonance (ESR) Spectroscopy
7.1
7.2
7.3
7.4
7.5
7.6
7.7
Introduction 224
Theory 224
ESR Absorption Positions: The g Factor 226
Instrumentation 227
Working of an ESR Spectrometer 230
Sampie Handling 231
Sensitivity of an ESR Spectrometer 232
224
x + Contents
7.8 Multiplet Structures in ESR Spectroscopy 232
7.9 Interpretation of ESR Spectra 237
7.10 Double Resonance (or Double Irradiation) in ESR
Spectroscopy 239
7.11 Applications of ESR Spectroscopy 240
7.12 Comparison Between NMR and ESR Spectroscopy 243
7.13 Some Solved Problems 243
Problems 247
References 248
8. Mass Spectroscopy (MS)
8.1
8.2
8.3
8.4
8.5
8.6
8.7
8.8
8.9
8.10
8.11
8.12
8.13
8.14
8.15
8.16
9. Spectroscopic Solutions of Structural Problems
9.1
9.2
250
Introduction 250
Ionization Methods 250
Molecular and Fragment Ions 252
Instrumentation 253
Double Focusing Mass Spectrometers 255
Mass Spectrum and the Base Peak 255
Recognition of the Molecular Ion (Parent) Peak and
Detection of Isotopes 256
Confirmation of the Recognized Molecular Ion Peak 257
Multiply Charged Ions 259
Metastahle Ions or Peaks 260
Applications of Mass Spectroscopy 260
Representation of Fragmentation Processes 262
Factors Governing General Fragmentation Processes 262
Examples of General Fragmentation Modes 262
Fragmentation Modes of Various Classes of Organic
Compounds 265
Some Solved Problems 287
Problems 292
References 293
295
lntroduction 295
Some Solved Problems 296
Problems 309
Answers to Problems
Index
316
321
ÜRGANIC SPECTROSCOPY
1
Introduction to Spectroscopy
(Spectrometry)
1.1
Spectroscopy and Electromagnetic Radiations
Organic chemists use spectroscopy as a necessary tool for structure determination.
Spectroscopy may be defined as the study of the quantized interaction of
electromagnetic radiations with matter. Electromagnetic radiations are produced
by the oscillation of electric charge and magnetic field residing on the atom.
There are various forms of electromagnetic radiation, e.g.light (visible), ultraviolet,
infrared, X-rays, microwaves, radio waves, cosmic rays etc.
1.2 Characteristics of Electromagnetic Radiations
Alltypes of radiations have the same velocity (2.998 x 10 10 cm/s in vacuum) and
require no medium for their propagation, i.e. they can travel even through vacuum.
Electromagnetic radiations are characterized by frequencies, wavelengths or
wavenumbers.
Frequency v is defined as the number of waves which can pass through a point
in one second, measured in cycles per second (cps) or hertz (Hz) (1Hz= 1 cps).
Wavelength A is defined as the distance between two consecutive crests C
or troughs T (Fig. 1.1) measured in micrometer (,um) or micron (,U) (1 ,um =
1 ,u =10-6m), nanometer (nm) or millimicron (m,u) (1 nm = 1 m,u =10-9 m) and
angstrom (Ä) (l A = w-IOm).
Fig. 1.1 Wavelength A. of an electromagnetic radiation
v
Wavenumber
is defined as the number of waves which can pass through
per unit length usually 1 cm. lt is the reciprocal of wavelength expressed in
centimeter (cm- 1), i.e.
2
+ ORGANIC SPECTROSCOPY
V=
1
-::--o"....:-_
A (in cm)
By their definitions, frequency and wavelength are inversely proportional,
i.e.
voci1
V= E._
or
lt
where c is velocity of light (2.998 x 10 10 cm/s).
Electromagnetic radiation is energy. When a molecule absorbs radiation, it
gains energy, and on emitting radiation, it Iosses energy. The emission or absorption
of electromagnetic radiations is quantized and each quantum of radiation is
called a quantum or photon. Energy E for a single photon
E = hv
= hc
lt
erg s).
where h is Planck's constant (6.626 x
The higher the frequency (or the shorter the wavelength) of the radiation, the
greater is its energy.
10-27
Energy for a mole of photons. One mole of photons is one Einstein.
E = Nhv =
Nhc
·
A (in cm)
= Nhv c erg
where N is Avogadro's number (6.023 x 10²³ molecules/mole).
E=
Or
Nhc
A (in cm)
= 2.86 X 10-3 = V x 2.86 X 10⁻³ kcal/mole
A (in cm)
(4.184 x 10⁷ erg = 4.184 J = 1 cal; 1 eV = 23.06 kcaUmole).
Solved Problems
1.3
1. Convert the following wavelengths into the corresponding wavenumbers in
cm- 1:
(i) 5 Ji and (ii) 104 nm
Solution
(l")
wavenum ber
- =
V
1 )
c·mcm
1
/1,
The given J.. = 5 and
Hence
v=
5
(ii) Wavenumber V- =
X
1
/1,
)i
=5
X
1
= 1 x 104 = 2000 cm -I
5
10-4
1
)
c·mcm
The given A = 104 nm = 104
Therefore
10-4 cm
X
10-7 = 10-3 cm (1 nm = 10-7 cm)
1-= 1 x 10 3 = 1000cm-•
v=10-3
lntroduction to Spectroscopy (Spectrometry)
+3
2. Convert wavenurnber 1755 crn- 1 into the corresponding wavelength in J.Lrn.
Solution
Wavelength ll (in crn)
= .l
V
1
ll = 1755
Hence
= 0.00057 crn
= 0.00057 x
104 J.Lrn (1 crn
= 104 J.Lrn) = 5.7 J.Lrn
3. Calculate the frequency of the electrornagnetic radiations corresponding to
the wavelengths (i) 2000 A and (ii) 4 J.Lrn.
Solution
(i) Frequency
I
v=
The given wavelength 2000
A = 2000 x
Hence v = 2.998 x 10 10 ern/sec
2000 X 10-8 crn
10-8 crn ( 1
= 1. 499 x
1015
A = 10-8 crn)
per sec
= 1.499 x 10 15 Hz (cps) or 1.499 x 10⁹ MHz
(ii) V= E._
ll
The given wavelength 4 J.Lrn
Therefore v =
=4 x
2.998 x 10 10 ern/sec
-4
4 X 10 crn
10-4 crn (1 J.Lrn
= 10-4 crn)
= 74.95 x 10 12
persec
= 74.95 x 10 12 Hz (cps) or 74.95 x 10⁶ MHz
4. Calculate the wavelength in Aof an electrornagnetic radiation having frequency
7 x 10 14 Hz.
Solution
ll = E...
v
= 2.998
x 1010 ern/sec
7 x 10 14 Hz (cps)
= 0.4283
x 10-4 cm or 4283
A (1
cm
= 108 A)
5. Calculate the energy associated with an ultraviolet radiation having wavelength
250 nm. Give the answer in kcal/rnole and also in kJ/mole.
Solution
E_
-
Nhc
1 ('
A
m crn )
The given ll = 250 nrn
Hence
= 250 X
_ 2.86 X 10⁻³
-
1 ('
A
m crn )
kcal/rnole
10-7 crn (l nrn = 10-7 cm)
E = 2 ·86 x 10 ~ = 114.4 kcallrnole
250 x 10-
= 114.4 x 4.184 = 478.65
kJ/rnole (1 kcal
= 4.184
kJ)
4
+ ORGANIC SPECTROSCOPY
6. Calculate the energy associated with an ultraviolet radiation having wavelength
286 mm. Give the answer in kcal/mole and also in kJ/mole.
Solution
2.86 x w-3
)
kcal!mole
1 ('
A
mcm
E=
The given A
= 286 ill).l = 286 X w-7 cm (1
ill).l
= w-7 cm).
Therefore
E
1.4
= 2.8 6 X
286 x
lO-J
= 100 kcal/mole or
w-7 = 418.4 kJ/mole
100
X
4.184 kJ/mole
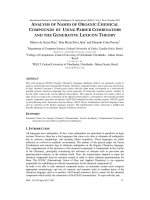
Electromagnetic Spectrum
Electromagnetic spectrum covers a very wide range of electromagnetic radiations
from cosmic rays (having wavelengths in fractions of an angstrom) to radio
waves (having wavelengths in meters or even kilometers) at the other end. The
arrangement of all types of electromagnetic radiations in order of their wavelengths
or frequencies is known as the complete electromagnetic spectrum (Fig. 1.2).
Decreasing energy
Frequency (Hz)
1015
I
lfr~
I
I
"'>,
....
"'
u
'§
u"'
0
I
10-15
"'>,
!::!
;:._
I
w-w
~
!::!
><
.!!
0
.!!
·;;: P-
't:l
~
" >"' .:::.E
!:I
5
"'
"'
0,)
0,)
;t
"'
;t
u
~
:>
8
~
w-s
I
:>
"'
"
~
I
I
Wavelength (m)
Fig. 1.2 Electromagnetic spectrum
The visible region ( 400-800 nm) represents only a small portion of the
electromagnetic spectrum. Similarly, ulraviolet (UV), X-rays, y-rays, cosmic
rays, infrared (IR), microwaves and radio waves are the other important regions
of the electromagnetic spectrum. The apprcximate wavelengths and frequencies
Introduction to Spectroscopy (Spectrometry)
+5
of various regions of the electromagnetic spectrum are given in Fig. 1.2. Except
the visible region, various regions overlap. The regions of greatest interest
to organic chemists are 200-400 nm (ultraviolet), 400-800 nm (visible) and
2.5-15 Jl. (infrared).
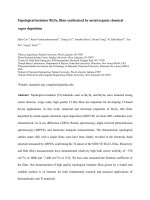
1.5 Absorption and Emission Spectra
When electromagnetic radiations are passed through an organic compound, they
may be absorbed to induce electronic, vibrational and rotational transitions in
the molecules. The energy required for each of these transitions is quantized.
Thus, only the radiation supplying the required quantum (photon) of energy is
absorbed and the remaining portion of the incident radiation is transmitted. The
wavelengths or frequencies of the absorbed radiations are measured with the
help of a spectrometer. Generally, a spectrometer records an absorption spectrum
as a plot of the intensity of absorbed or transmitted radiations versus their
wavelengths or frequencies. Such spectra which are obtained by absorption of
electromagnetic radiations are called absorption spectra (Fig. 1.3). UV, visible,
IR and NMR spectra are examples of absorption spectra. Absorption band in an
absorption spectrum can be characterized by the wavelength at which maximum
absorption occurs and the intensity of absorption at this wavelength.
1
=
·~ §
·a"'
"'
"::I
-~
Absorption band
....~0 'ö~
·-"'= ....."'=
~~
-= -=
jI
.!:! .!:!
14--' - - - - - - - - - - - ' - 1_
Wavelength or frequency of rnaximum
absorption (A",., or Vmax)
--------.4---------
.-----------------y--------Fig. 1.3 Schematic absorption spectrum
The spectra which are obtained by emission of electromagnetic radiations
from the excited substances are known as emission spectra, like atomic emission
spectra. The excitation is caused by heating the substance to a high temperature
either thermally or electrically. The excited substance emits certain radiations
when it comes to the ground state and a spectrometer records these radiations as
an emission spectrum.
6 + ORGANIC SPECTROSCOPY
PROBLEMS
1. What is spectroscopy? Explain absorption and emission spectra.
2. Describe important characteristics of electromagnetic radiations. Give expression
for calculating the energy for a mole of photons.
3. Arrange the following electromagnetic radiations in order of their decreasing
wavenumbers:
Radio waves, UV, visible, IR, X-rays and y-rays.
4. Write short notes on:
(a) Electromagnetic spectrum, (b) Absorption of radiations and (c) Electromagnetic
radiations.
5. Draw a typical absorption spectrum.
6. (a) Convert the following wavelengths in terms of wavenumbers in cm- 1:
(i) 2.5 11-
(ii) 285 nm
(iii) 2.98 IJ.m
(b) The wavelength range of visible radiation is 4000 to 8000 A. Calculate the
corresponding frequency range in MHz.
7. (a) Calculate the energy associated with an infrared radiation having wavelength
4.0 Jl.. Give your answer in kcal/mole.
(b) Calculate the frequency range in cycles per second of the near-ultraviolet
wavelength range 200 to 400 nm.
8. (a) Calculate the energy associated with a radiation having wavelength 6000 A.
Give your answer in kcal mole- 1 !lnd also in kJ mole- 1.
(b) The most useful region for infrared spectroscopy is 2.5 to 15 Jl.· Convert this
region into the corresponding wavenumber range in cm- 1•
(c) The energy difference between the two electronic states is 23.06 kcal
mole- 1. What will be the frequency of the radiation absorbed when the
electronic transition occurs from the lower energy state to the higher energy
state?
References
I. A.J. Bakerand T. Caims, Spectroscopic Techniques in Organic Chemistry, Heyden
London, 1965.
2. E.F.H. Britlain, W.O. George and C.H.J. Wells, Introduction to Molecular
Spectroscopy, Academic Press, London, 1970.
3. J.C.D. Brand and G. Eglinton, Applications of Spectroscopy to Organic Chemistry,
Oldbourne Press, London, 1965.
4. J.R. Dyer, Applications of Absorption Spectroscopy of Organic Compounds,
Prentice-Hall, Englewood Cliffs, N.J., 1965.
5. W.G. Richards and P.R. Scott, Structure and Spectra of Atoms, Wiley Eastern
Ltd., 1978.
2
Ultraviolet (UV) and Visible
Spectroscopy
2.1
Introduction
Ultravialet and visible spectroscopy deals with the recording of the absorption
of radiations in the ultraviolet and visible regions of the electromagnetic spectrum.
The ultaviolet region extends from 10 to 400 nm. It is subdivided into the near
ultraviolet (quartz) region (200-400 nm) and the far or vacuum ultraviolet region
(10-200 nm). The visible region extends from 400 to 800 nm.
The absorption of electromagnetic radiations in the UV and visible regions
induces the excitation of an electron from a lower to higher molecular orbital
(electronic energy Ievel). Since UV and visible spectroscopy involves electronic
transitions, it is often called electronic spectroscopy. Organic chemists use
ultraviolet and visible spectroscopy mainly for detecting the presence and
elucidating the nature of the conjugated multiple bonds or aromatic rings.
2.2 Absorption Laws and Molar Absorptivity
A UV-visible spectrophotometer records a UV or visible spectrum (Fig. 2.1) as
a plot of wavelengths of absorbed radiations versus the intensity of absorption in
terms of absorbance (optical density) A or molar absorptivity (molar extinction
coefficient) e as defined by the Lambert-Beer law. According to Lambert's law,
the fraction of incident. monochromatic radiation absorbed by a homogeneaus
medium is independent of the intensity of the incident radiation while Beer's
law states that the absorption of a monochromatic radiation by a homogeneaus
medium is proportional to the number of absorbing molecules. From these laws,
the remaining variables give the following equation which expresses the LambertBeer law
log 10
TIo
= A = Ecl
(2.1)
where / 0 is the intensity of incident radiation, I the intensity of radiation transmitted
through the sample solution, A the absorbance or optical density, E the molar
absorptivity or molar extinction coefficient, c the concentration of solute (mole/
litre) and l the path length of the sample (cm).
8
+ ORGANIC SPECTROSCOPY
The molar absorptivity of an organic compound is constant at a given
wavelength. The intensity of an absorption band in the UV or visible spectrum
is usually expressed as the molar absorptivity at maximum absorption, Ernax or
log 10 Emax· The wavelength of the maximum absorption is denoted by Amax·
When the molecular weight of a sample is unknown, or when a mixture is
being examined, the intensity of absorption is expressed as Ef~m (or Af~m)
value, i.e. the absorbance of a 1% solution of the sample in a 1 cm cell
E'%
I cm
-A
- cl
where c is the concentration in g/ 100 ml and l the path length of the sample in cm.
This value is easily related to e by the expression
10e = Ef~m x Molecular weight
2.3
Instrumentation
The desired parameter in spectroscopy is absorbance, but it cannot be directly
measured. Thus, a UV-visible spectrophotometer compares the intensity of the
transmitted radiation with that of the incident UV-visible radiation. Most UVvisible spectrophotometers are double-beam instruments and consist of a radiation
source, monochromator, detectors, amplifier and recording system as shown in
Fig. 2.1.
Reference
beam
source
Sampie
Fig. 2.1
(i)
Sampie
detector
Schematic diagram of a double-beam UV·visible spectrophotometer
Radiation Source
The hydrogen-discharge lamp is the most commonly used source of radiation in
the UV region (180-400 nm). A deuterium-discharge lamp is used in its place
when more (3-5 times) intensity is desired. A tungsten-filament lamp is used when
absorption in the visible region (400-800 nm) is tobe determined.
(ii) Monochromator
It disperses the radiations obtained from the source into their separate wavelengths.
The most widely used dispersing element is a prism or grating made up of quartz
because quartz is transparent throughout the UV range. Glass strongly absorbs
Ultravialet ( UV) and Visible Spectroscopy
+9
ultraviolet radiation, hence it cannot be used in this region. Glass can be
satisfactorily used in the visible region. The dispersed radiation is divided by the
beam divider into two parallel beams of equal intensity; one of which passes
through a transparent cell containing the sample solution and the other through
an identical cell containing the solvent. The former is called sample beam and
the latter reference beam.
(iii) Detectors
These have photocells or photomultiplier tubes which generate valtage proportional
to the radiation energy that strikes them.
(iv) Amplifier
The spectrophotometer has balancing electronic amplifier which subtracts the
absorption of the solvent from that of the solution electronically.
(v) Recorder
It automatically records the spectrum as a plot of wavelengths of absorbed
radiations against absorbance A or molar absorptivity E.
2.4 Sampie Handling
UV-visible spectra are usually recorded either in very dilute solutions or in the
vapour phase. Quartz cells of 1 cm square are commonly used for recording the
spectra. The sample is dissolved in some suitable solvent which does not itself
absorb radiation in the region under investigation. Commonly used solvents are
cyclohexane, 1,4-dioxane, water, and 95% ethanol. The chosensolvent should
be inert to the sample. Generally, 1 mg of the compound with a molecular weight
of 100-200 is dissolved in a suitable solvent and made up to, e.g. 100 ml
and only a portion of this is used for recording the spectrum.
2.5 Theory (Origin) of UV-Visible Spectroscopy
UV-visible absorption spectra originate from electronic transitions within a
molecule. These transitions involving promotion of valence electrons from the
ground state to the higher-energy state (excited state) are called electronic
excitations and are caused by the absorption of radiation energy in the UVvisible regions of the electromagnetic spectrum. Since various energy Ievels of
molecules are quantized, a particular electronic excitation occurs only by the
absorption of specific wavelength of radiation corresponding to the required
quantum of energy.
2.6 Electronic Transitions
According to molecular orbital theory, the excitation of a molecule by the absorption
of radiation in the UV-visible regions involves promotion of its electrons from
a bonding, or non-bonding (n) orbital to an antibonding orbital. There are a and
nbonding orbitals associated with a* and n* antibonding orbitals, respectively.
Non-bonding (n or p) orbitalsarenot associated with antibonding orbitals because
10 • ORGANIC SPECTROSCOPY
non-bonding or lone pair of electrons present in them do not form bonds. Following
electronic transitions are involved in the UV-visible region (Fig. 2.2):
(i) a
~
a*
(iii) n
~
(iii) rc ~ rc*
a*
(iv) n
~
rc*
Antibonding
a orbital
-a*
Antibonding :n: orbital
:n:*
E
n
Bonding :n: orbital
:n:
a
Non-bonding n orbital
n ~ :n:*
n ~ a*
:n:~:n:*
a~
Bonding a orbital
a*
Relative energies of electronic transitions
Fig. 2.2
The usual order of energy required for various electronic transitions is
a~
a* > n
~
a* >
n~
rc* > n
~
n*
Now we will discuss the electronic transitions involved in UV-visible
spectroscopy.
(i) u~ u* Transition
The transition or promotion of an electron from a bonding sigma orbital to the
associated antibonding sigma orbital is a ~ a* transition. It is a high energy
process because abonds are generally very strong. Thus, these transitions do not
occur in normal UV-visible regions (200-800 nm). For example, in alkanes only
a~ a* transition is available and they absorb high energy UV radiation around
150 nm; ethane shows Amax 135 nm. The region below 200 nm is called vacuum
UV region, since oxygen present in air absorbs strongly at -200 nm and below.
Similarly, nitrogen absorbs at -150 nm and below. Thus, an evacuated
spectrophotometer is used for studying such high energy transitions (below
200 nm). However, this region is less informative
"
/
-c-c/
"
" /
-c:c/
"
(ii) n ~ C1 * Transition
The transition or promotion of an electron from a non-bonding orbital to an
antibonding sigma orbital is designated as n ~ a* transition: Compounds
Ultravialet ( UV) and Visible Spectroscopy
+ 11
containing non-bonding electrons on a heteroatom are capable of showing
absorption due to n ~ a* transitions. These transitions require lower energy
than a~ a* transitions. Some organic compounds undergoing n ~ n* transitions
are halides, alcohols, ethers, aldehydes, ketones etc. For example, methyl chloride
shows Amax 173 nm, methyl iodide Amax 258 nm, methyl alcohol Arnax 183 nm
and water Arnax 167 nm
"
..
-c-c-x:
/
..
.
~
"
.
-C-'-X:
/
..
In alkyl halides, the energy required for n ~ a* transition increases as the
electronegativity of the halogen atom increases. This is due to comparatively
difficult excitation of non-bonding (n or p) electrons on increase in the
electronegativity. The difficult excitation means less probability of transition.
The molar extinction coefficient c: increases as the probability of the transition
increases. Thus, methyl iodide shows Arnax 258 nm, Emax 378 and methyl chloride
Amax 173 nm, Ernax -100. Since iodine is less electronegative than chlorine,
n ~ a* transition is more probable at low energy process in methyl iodide than
in methyl chloride. Similarly, amines show both higher Amax and Ernax than alcohols
owing to lesser electronegativity of nitrogen than oxygen, e.g. trimethylamine
Amax 227 nm, Emax 900 and methyl alcohol Arnax 183 nm, Emax 150. Protonated
trimethylamine does not show absorption due to n ~ a* transition, because it
has no non-bonded electrons.
(iii) n ~ n* Transition
The transition or promotion of an electron from a n bonding orbital to a n
antibonding orbital is designated n ~ n* transition. These type of transitions
occur in compounds containing one or more covalently unsaturated groups
like C=C, C=O, N0 2 etc. n ~ n* transitions require lower energy than
n ~ a* transitions. In unconjugated alkenes, this transition occurs in the range
170-190 nm; ethylene shows Amax 171 nm. Similarly, unconjugated carbonyl
compounds show n ~ n* transition in the range 180-190 nm; acetone shows
Amax 188 nm.
"C=C
"
/
'R---7
n*
~
'.
.
/
-C-'-C
/
/
"
n ~ n* Transition
The transition or promotion of an electron from a non-bonding orbital to a n
antibonding orbital is designated n ~ n* transition. This transition requires
lowest energy.
(iv)
'-
/
..
c=o:
n*
~
'-
/
.
c_:_o:
Saturated aldehydes and ketones show both types of transitions, i.e. low
energy n ~ n* and high energy n ~ n* occurring in the regions 270-300 nm
12
+ ORGANIC SPECTROSCOPY
and 180-190 nm, respectively; acetone shows n ~ n* at Amax 279 nm. The band
due to n ~ n* transition is more intense, i.e. it has high value of c than the
less intense bands due to n ~ n* transition. In addition, carbonyl compounds
also exhibit high energy n ~ er* transition around 160 nm; acetone shows
Amax 166 nm.
Because of different structural environments, identical functional groups in
different compounds do not necessarily absorb at exactly the same wavelength.
2.7
Formation of Absorption Bands
Since the energy required for each electronic transition is quantized, the UVvisible spectrum is expected to exhibit a single, discrete line corresponding to
each electronic transition. In practice, broad absorption bands are usually observed.
In a molecule, each electronic energy Ievel (either in ground state or in excited
state) is accompanied by a !arge number of vibrational (v 0 , u~> u 2 etc.) and
rotational (r0 , r 1, r 2 etc.) energy Ievels which are also quantized (Fig. 2.3). In
complex molecules having many atoms, there are still a !arge number of closer
vibrational energy Ievels.
-------'3
-------'z
rr* Expanded-
Vz
-------rl
r
o
VleW
Vibrational and rotational
energy Ievels accompanied by
electronic excited state, i.e. rr *
Vo
E
rr-> rr*
Tr
p ossible transitions
ac companied by,
e. g. Tr ...... Tr*
Expanded
view
-
Fig. 2.3
Vibrational and
rotational energy
Ievels accompanied
by electronic ground
state, i.e. rr
Vo
Schematic energy Ievel diagram of a diatornie molecule
The radiation energy passed through a sample is sufficient to induce various
electronic transitions as weil as transitions in accompanying vibrational and
rotational energy Ievels. However, these transitions have very small energy
differences, but the energy required to induce an electronic transition is !arger
than that required to cause transitions in the accompanying vibrational and rotational
energy Ievels. Thus, the electronic absorption is superimp.osed upon the
Ultraviolet (UV) and Visible Spectroscopy
+ 13
accompanying vibrational and rotational absorptions resulting in the formation
of broad bands. More clearly, not only a single but a large number of very close
wavelengths are absorbed and the closeness of the resulting discrete spectral
lines causes them to coalesce to give broad absorption bands in case of complex
molecules.
2.8 Designation of Absorption Bands
UV-visible absorption bands may be designated by the type of electronic transition
from which they originate, e.g. a~ a* band, n~ n* band etc., or by the letter
designation. The following letter designation was proposed because more than
one band may arise due to the same type of electronic transition.
K-Bands (Conjugated; German: Konjugierte). These bands originate from
n* transitions in compounds having an- nconjugated system (a system
having at least two multiple bonds separated by only one single bond), e.g.
1,3-butadiene shows K-band at ll..nax 217 nm, Emax 21,000 and acrolein at ll..nax
210 nm, Ernax 11,500. Aromatic compounds having a chromophoric substituent
also exhibit K-bands in their UV spectra, e.g. acetophenone shows K-band at
ilmax 240 nm, Emax 13,000 and styrene at ll..nax 244 nm, Emax 12,000. Usually, Kband have high molar absorptivity, Ernax > 104.
n~
R-Bands (Radical-like; German: Radikalartig). Thesebands originate from
n ~ n* transitions of a single chromophoric group, e.g. carbonyl or nitro
group. R-bands have low molar absorptivity, Ernax < 100, and are also called
forbidden bands. For example, acetone shows an R-band at ll..nax 279 nm,
Emax 15; acrolein at ll..nax 315 nm, Ernax 14 and acetophenone at ilmax 319 nm,
Ernax 50.
B-Bands (Benzenoid bands). Thesebands originate from n~ n* transitions
in aromatic or heteroaromatic compounds. For example, benzene shows a Bband at Amax 256, Ernax 200 and acetophenone at ilmax 278 nm, Ernax 1100.
E-Bands (Ethylenic bands). Similar to B-bands, these are characteristic of
aromatic and heteroaromatic compounds and originate from n ~ n* transitions
of the ethylenic bonds present in the aromatic ring. E-band which appears at a
shorter wavelength and is usually more intense is called E 1-band. The low intensity
band of the same compound appearing at a Ionger wavelength is called E2bandt. For example, benzene exhibits E 1- and Erbands near ilmax 180 nm,
Emax 60,000 and ll..nax 200 nm, Ernax 7900, respectively.
For more examples of K-, R-, B-andE-bands, see Tables 2.2, 2.6 and 2.7. A
compound may exhibit more than one band in its UV spectrum, either due to the
presence of more than one chromophore or due to more than one transition of a
single Chromophore. A typical UV spectrum is given in Fig. 2.4.
A band may be submerged under some more intense band. Thus, in certain
tln another notation it is designated K-band but we shall use the designation Erband for
this.
14
+ ORGANIC SPECTROSCOPY
10,000
1
8600
8000
"'
6000
·~c
Er band
('n ---7 n* transition)
Aniline (in water)
.8
..5
4000
B-band
(n---7 n*
transition)
2000
1430
200
250
Wavelength, nm
Fig. 2.4
UV spectrum of aniline showing E 2- and B-bands
cases, all the expected bands may not be observed. For example, 8-bands are
sometimes buried under K-bands (see Tables 2.6 and 2.7).
2.9 Transition Probability: Allowed and Forbidden
Transitions
On exposure to UV or visible radiation, a molecule may or may not absorb the
radiation, i.e. it may or may not undergo electronic excitation. The molar
absorptivity at maximum absorption
fmax
= 0.87
X
10 20 · P · a
where Pis the transition probability with values from 0 to 1 and a the target area
of the absorbing system, i.e. a chromophore.
A chromophore with a length of the order of 10 A or w- 7 cm and with unit
probability will have Emax value of -105 . Thus, there is a direct relationship
between the area of a chromophore and its absorption intensity ( Emax). Transitions
with Emax values > 104 are called allowed transitions and are generally caused by
n -7 n* transitions, e.g. in 1,3-butadiene, the absorption at 217 nm, Emax 21,000
results from the allowed transition. Transitions with Emax values < 104 are called
forbidden transitions. Theseare generally caused by n -7 n* transitions, e.g. in
carbonyl compounds, the absorption near 300 nm with Emax values
lü-1 00 results from the forbidden transition.
In addition to the area of a chromophore, there are also some other factors
which govern the transition probability. However, the prediction of their effects
on the transition probability is complicated because they involve geometries of
the lower and higher energy molecular orbitals as weil as the symmetry of the
molecule as a whole. Symmetrical molecules have more restrictions on their
transitions than comparatively less symmetrical molecules. Consequently,
Ultravialet ( UV) and Visible Spectroscopy
+ 15
symmetrical molecules like benzene have simple electronic absorption spectra
as compared to less symmetrical molecules. There are very less symmetry
restrictions for a highly unsymmetrical molecule, thus it will exhibit a complex
electronic absorption spectrum.
2.10 Certain Terms Used in Electronic Spectroscopy:
Definitions
Chromophore
A covalently unsaturated group responsible for absorption in the UV or
visible region is known as a chromophore. For example, C =C, C =C, C =0,
C =N, N =N, N0 2 etc. If a compound absorbs light in the visible region
(400-800 nm), only then it appears coloured. Thus, a chromophore may or may
not impart colour to a compound depending on whether the chromophore absorbs
radiation in the visible or UV region.
Chromophores like C =C or C =C having n electrons undergo n ~ n*
transitions and those having both n and non-bonding electrons, e.g. C =0,
C=N or N=N, undergo n~ n*, n ~ n* and n ~ a* transitions. Since the
wavelength and intensity of absorption depend on a nurober of factors, there are
no set rules for the identification of a chromophore. Characteristics of some
common unconjugated chromophores are given in Table 2.1.
Table 2.1
Characteristics of some common unconjugated chromophores
Chromophore
Example
"
Ethylene
171
15,530
n~n*
Vapor
Acetylene
150
173
-10,000
6000
11:~77:*
11:~77:*
Hexane
Vapor
160
180
290
166
188
279
204
178
220
211
201
274
20,000
10,000
/
C=C
"
/
-C=C-
"
/
C=O
Acetaldehyde
Acetone
-COOH
-CONH 2
-COOR
-N0 2
Acetic acid
Acetamide
Ethyl acetate
Nitromethane
A,nax
(nm)
t;nax
17
16,000
900
15
60
9500
63
57
5000
17
Transition
n~
a*
n~n*
n~n*
Water
Vapor
Ethanol
n~n*
n~
a*
11:~77:*
n~
n*
n~n*
11:~77:*
n~n*
n~n*
n~
n*
Acetoxime
190
5000
-C=N
-N=N-
Acetonitrile
Azomethane
167
338
Weak
11:~77:*
4
n~n*
C=N-
Vapor
Vapor
Hexane
Vapor
Hexane
Hexane
Water
Hexane
Water
Ethanol
Methanol
Methanol
11:~77:*
"
/
Solvent