Ineffective capital structure of ninh van bay joint stock company
Bạn đang xem bản rút gọn của tài liệu. Xem và tải ngay bản đầy đủ của tài liệu tại đây (11.08 MB, 64 trang )
MBA Final Thesis:
Ineffective capital structure of Ninh Van Bay Joint Stock Company
Instructor: Dr. Pham Phu Quoc
Student: Le Anh Mai Chi
MBA Class 5.2
1
TABLE OF CONTENTS
Executive summary......................................................................................................................... 5
CHAPTER 1: THE PROBLEM CONTEXT ............................................................................. 6
CHAPTER 2: SITUATION ANALYSIS .................................................................................... 7
2.1 Problems finding process ................................................................................................... 7
2.2 Problem symptoms ............................................................................................................. 7
2.2.1 Significant profit decrease ................................................................................................. 8
2.2.2 Profitability decrease ....................................................................................................... 10
2.2.3 Basic Earning Power ratio decrease ................................................................................ 13
2.3 Possible problems ............................................................................................................. 13
2.4 Main problems .................................................................................................................. 17
2.4.1 Interest expense increase................................................................................................ 17
2.4.2 Ineffective utilization of leverage factor ........................................................................ 18
2.5 Possible causes of the problem ........................................................................................ 23
2.6 Main causes of the problem ............................................................................................. 24
2.7 Cause – effect tree of problem ......................................................................................... 26
CHAPTER 3: SOLUTION DESIGN ........................................................................................ 27
3.1 Possible solutions for inefficient capital structure ......................................................... 27
3.2 Implementation of suitable plans .................................................................................... 28
3.3 Actions Plan ....................................................................................................................... 30
References ..................................................................................................................................... 34
Appendix ....................................................................................................................................... 38
2
LIST OF FIGURES
Figure 1. Revenue and Net profit of NVT from 2013 - 2015
Figure 2. Revenues of companies in the same industry with NVT 2013 - 2015
Figure 3. Profit margins of companies in the same industry with NVT 2013 - 2015
Figure 4. Cause – Effect tree
Figure 5. Actions plan
3
LIST OF TABLES
Table 1. Revenue and profit of NVT from 2013 – 2015
Table 2. Revenue and profit margin of companies in the same industry from 2013 – 2015
Table 3. NVT’s Profitability Ratios 2013 – 2015
Table 4. ROE, ROA and EPS of companies in same industry with NVT from 2013 - 2015
Table 5. The BEP ratios of NVT 2013 – 2015
Table 6. The possible problems and supportive theories
Table 7. NVT DuPont Analysis 2013 – 2015
Table 8. Interest Expense of NVT from 2013 to 2015
Table 9. Capital structure ratios of NVT and other companies from 2013 to 2015
Table 10. Income Statement of NVT from 2013 to 2015
Table 11. NVT’s net sales and total asset
Table 12. Possible causes and supportive theories
Table 13. Possible solutions
Table 14. Implementation of suitable plans
4
Executive summary
The main problem is inefficient capital structure by increasing debts over the period 2013
to 2015. In which, total debt to total equity increased from 46.60% to 52.68% that leads to
profitability decrease from 4.83% to -14.71% of ROE. Financial ratios are calculated from
company’s financial and accounting reliable sources as NVT had listed in the Ho Chi Minh Stock
Exchange over the period 2013 to 2015. The ratios are also in comparison with other corporates in
the industry associated with deep interviews of company’s leaders in order for trustable findings.
The main causes of the problem are high debts on total projects and financing interest cost
of debts. NVT has to borrow different resources of debts to finance the projects and operation,
especially the contract of issuing 230 billion VND of bonds. Using financial leverage sometimes
is good. However, using that method in a wrong time when the difficulties of the economy plus
the difficulties of the corporation in implementing projects may led to exhaustion of funds.
Continuing to borrow to maintain operating can be a temporary solution, but if it lasts, causing
serious consequences.
There are two solutions for company’s activities. Firstly, NVT should reduce
overinvestment and increase cash by reselling the project Six Senses Saigon River and transferring
and withdrawing the investment in Tan Phu JSC. Secondly, the company should increase sales in
the control of expenses to get profits for financing current debts.
5
CHAPTER 1: THE PROBLEM CONTEXT
NVT is a tourism real estate, specializing in investment, construction and luxury eco resorts
business in Vietnam. NVT is creating five star quality and superior products in Vietnamese style,
through inheriting and promoting deeply culture in Vietnam’s regions. The company was founded
in 2006 with the charter capital of 1 billion Vietnam dong. In 2009, the company raised the charter
capital up to 505 billion Vietnam dong. In 2016, the charter capital of the company is 905 billion
Vietnam dong.
Six Senses Ninh Van Bay Resort of the Company has become the destination of more than
150,000 inbound and outbound tourists. Especially, the resort has received 14 awards voted by
many travel agencies and organizations, well-known travel magazines such as Tatler world, World
Travel Awards, the Guide Magazine, Conde ‘Nast Traveller. A new development of the company
– Six Senses Saigon River Project (Appendix 1), was started on the 1st of May, 2009. This will not
only be a transit point for leisure from Saigon to Nha Trang, Phu Quoc, Dalat, Bangkok, Phnom
Penh, Singapore… but also the convergence of internally tourist.
However, according to the result of operating during the period of 2013 – 2015, profit has
decreased significantly and did not achieve the annual plan. In 2013, earning before tax (EAT) of
the company was 39.8 billion Vietnam dong but in 2014 EAT decreased to 25.6 billion Vietnam
dong while the plan for that year was 45 billion Vietnam dong. In 2015, EAT was -122.9 billion
Vietnam dong, which decreased significantly in comparison with 2014 and in comparison with the
plan of 9.1 billion Vietnam dong.
From NVT’s financial results, questions were raised: Is that a problem of the company? If
yes, what are the reasons and what are the solutions, organizations’ action plans to solve the
problem? This study was implemented to answer the questions.
6
CHAPTER 2: SITUATION ANALYSIS
2.1 Problems finding process
In order to identify these company problems, these following steps will be executed:
-
Group meeting with the company to understand the division symptoms and possible
problems. The division is Financial Department and the group meeting includes of three
staffs: Mr. Tran Kim Nhan, Mr. Truong Quang Phu and Mrs. Tran Nguyen Thi Mai
Suong, they are all financial executives of NVT;
-
Review the literatures related to the symptoms and further study of the company
financial and accounting reliable sources as NVT had listed in the Ho Chi Minh Stock
Exchange and their financial reports are audited regularly. The study also gathered
information from the industry and competitors in the market by reliable sources as the
information had listed in the Ho Chi Minh Stock Exchange. Then the literatures were
reviewed which related to any new discovery;
-
Deep interview with persons in charged for more details: Mr. Hoang Anh Dung - the
General Director of NVT, Mrs. Ngo Thi Thanh Hai – the Chief Accountant of NVT;
-
Additional intelligent information may be acquired from competitors for further
references.
2.2 Problem symptoms
From datas calculated from annual reports, supportive theories associated with the first
meeting with responsible members, the symptoms revealed company’s ineffective profitability as
the following details:
-
Profit has decreased significantly while revenue showed a different trend;
-
Profitability decreased sharply over the period 2013 to 2015;
7
-
Basic Earning Power ratio decreased under interest rate.
2.2.1 Significant profit decrease
The first symptom of NVT’s problem is gross profit, earning before tax (EBT), earnings
after tax (EAT) dropped significantly from 2013 to 2015 while revenue did not change much. In
comparison with companies in the same industry of NVT in the same period of time, their revenues
had the same trend with NTV. However, profit margin had the sharply down trend opposite to the
profit trends of other companies. This symptom can be proved by the financial data and ratios
below.
Table 1 below shows revenues and profits of NVT from 2013 to 2015 for a clearly picture
about the performance of the company.
Value (in billion VND)
Position (%)
Year
2013
2014
2015
2013
2014
2015
Revenue
207.5
210.7
189.1
100%
100%
100%
Gross profit
95.6
97.6
25.9
46.07%
46.32%
13.70%
EBT
39.8
25.6
-122.9
19.18%
12.15%
-64.99%
EAT
40.5
22.3
-127.6
19.52%
10.58%
-67.48%
Table 1. Revenue and profit of NVT from 2013 – 2015 (Unit: billion VND)
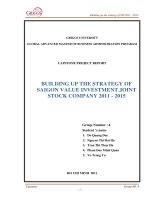
From table 1, revenue of the company slightly increased from 2013 - 2014 and a little
decreased from 2014 - 2015. In general, revenue of the company did not change much. On the
other hand, profits of the company significantly decreased throughout the years which have
opposite trends with revenues. Gross profit to revenue down from 46.07% in 2013 to 13.70% in
2015. EBT dropped sharply from 39.8 billion Vietnam dong in 2013 down to 25.6 billion Vietnam
dong in 2014 and dramatically decreased to -122.9 billion Vietnam dong in 2015. As a result, EAT
8
to revenue had a same sharply down-trend from 19.52% in 2013, 10.58% in 2014 and down to 67.48% in 2015. A more clearly picture of two opposite trends of profits and revenues is shown in
figure 1 below.
Revenue and Net profit of NVT 2013 - 2015
(billion VND)
300
210.7
207.5
189.1
200
100
40.5
22.3
0
2013
-100
2014
2015
-127.6
-200
Revenue
Net profit
Figure 1. Revenue and Net profit of NVT from 2013 - 2015
A comparison with other companies in the same industry with NVT was shown in table 2,
figure 2 and 3 below. Some companies in the same industry of tourism real estate are: Ocean
Hospitality (OCH), Sao Mai Group (ASM) and Thanh Thanh Cong Tourist (VNG).
Revenue (in billion
Percentage change (%)
Company
Profit margin
VND)
name
2013
2014
NVT
207.53
210.69 189.08
OCH
669.36
788.05 729.57 32.26% 17.73%
ASM
VNG
2015
2013
2014
0.65%
1.52% -10.26% 19.50%
1182.02 1222.98 952.78 -0.26%
57.56
54.84
87.96
2015
2014
60.39%
2015
10.06% -67.50%
-7.42% 17.80% -110.00%
3.47% -22.09%
7.37% -4.73%
2013
2.90%
2.20%
7.30%
9.00%
0.90%
0.90%
2.60%
Table 2. Revenue and profit margin of companies in the same industry from 2013 – 2015
9
Based on the comparison, NVT has the same trend in revenue with OCH and ASM:
increase from 2013 to 2014 and decreased from 2014 to 2015. However, profit margin of NVT
over the time has the significantly down-trend. In the meanwhile, the other three companies have
the up-trend profit margins. This illustrates the problem in decreased profit from 2013 – 2015.
Figure 2. Revenues of companies in the
Figure 3. Profit margins of companies in
same industry with NVT 2013 - 2015
the same industry with NVT 2013 - 2015
2.2.2 Profitability decrease
The second symptom of NVT is the remarkably decreased performance efficiency from
2013 to 2015 which has an opposite trend to other companies in the same industry.
Salim et al (1) indicated that firm performance, which is measured by return on asset
(ROA), return on Equity (ROE) and earning per share (EPS) have negative relationship with short
term debt (STD), long term debt (LTD), total debt (TD). Chen-Ying (2) used operating ratio and
return on assets (ROA) for the two kinds of profitability indicators to measure insurers’
profitability.
10
Therefore, in order to evaluate the profitability and performance of the company, return on
equity (ROE) is applied. Besides, return on asset (ROA), earning per share (EPS) and gross profit
margin were also calculated in table 3.
ITEMS
2013
2014
2015
ROA
2.92%
1.56%
-9.64%
ROE
4.83%
2.23%
-14.71%
Gross profit margin
46.14%
46.33%
27.05%
EPS (billion VND)
248
62
-1,411
Table 3. NVT’s Profitability Ratios 2013 – 2015
From table 3, the profitability ratios ROA and ROE of the firm have decreased from 4.83%
down to -14.71% in ROE and from 2.92% down to -9.64% in ROA. In 2013, the ROE was positive
and higher than ROA which means in 2013 the company’s business created profit. The ROE ratios
4.83% means if the investor invests in the company 100 dong, that investor will get 4.83 dong
profit. In 2014, even though the ROE and ROA of NVT decreased but still positive and ROE still
higher than ROA. However, in 2015, the ROE was down to negative which means if the investor
invests in the company 100 dong, the investor will lose 14.71 dong. With this ratio, no investors
actually want to invest in NVT. Besides, ROE in this year was much lower than ROA. The
company has used the leverage factor inefficiently. This can be understood that the company used
leverage but the profit was not enough to finance. This leads to EPS reducing significantly from
248 down to -1,411VND.
In the meanwhile, ROE and ROA of the companies in the same industry with NVT have the
different trends.
11
ROE
NVT
OCH
ROA
2013
2014
2015
4.83%
2.23%
-14.71%
5.8% -76.76%
2.07%
EPS (thousand VND)
2013
2014
2.92%
1.56% -9.64%
3.26% -25.43%
2015
2013
2014
2015
0.25
0.06
-1.41
0.79%
1
-4.38
0.13
ASM
-11.66%
0.69%
0.89%
-4.04%
0.24%
0.31%
0.63
1.7
0.62
VNG
0.33%
0.29%
1.46%
0.25%
0.21%
0.64%
0.04
0.03
0.19
Table 4. ROE, ROA and EPS of companies in same industry with NVT from 2013 - 2015
From table 4, the period from 2013 to 2014, from the ROA and ROE ratios, the companies
in the same industry in a general look have the different result trends with NVT. In period of 2013
– 2014, other companies had the down-trend results. For example, ROE of OCH was from 5.8%
in 2013 down significantly to -76.76% in 2014 and VNG from 0.33 to 0.29%. As a result, ROA of
both companies was in a down trend. In a general look, from 2013 to 2014, NVT got the
satisfactory results among the companies in the same industry. In the period of 2014 – 2015, all
the competitors had the up-trend and positive results such as OCH’s ROE from -76.76% in 2014
up remarkably to 2.07% in 2015. Another illustration is VNG’s ROE from a down trend of 0.29%
in 2014 up to 0.64% in 2015. In another hand, with an opposite trend, ROE and ROA decreased
unexpectedly to a negative and got the lowest result in among companies. That event caused NVT
a negative and lowest EPS of -1.41 in 2015. In the meanwhile, OCH, ASM and VNG got positive
results of 0.13, 0.62 and 0.19.
In conclusion, decreased performance efficiency in 2013 – 2015 is the second symptom of
the company.
12
2.2.3 Basic Earning Power ratio decrease
From 2013 to 2015, continuously reduction in Basic Earning Power ratio (BEP) is the third
symptom of the company’s problem. BEP is earning before interest and taxes (EBIT) divided by
Total Assets (TA).
The formula is: BEP = EBIT/TA
BEP is used to determine how effectively a firm uses its assets to generate income and
consider how leverage and tax rates affect the company. Nguyen et al (3) used BEP ratios to
measure the financial effect of factors that affect the enterprises which have foreign investment at
HCMC in stage 2007 – 2011. Burney et al (4) proved that in order for financial leverage to increase
ROE, the interest rate must be lower than BEP ratio. The below table 5 shows the BEP ratios of
NVT in period of 2013 to 2015:
2013
EBIT (billion VND)
TA (billion VND)
BEP
2014
2015
39.8
25.6
-123.0
1,390.4
1,432.5
1,311.8
0.028627
0.017896
-0.09375
Table 5. The BEP ratios of NVT 2013 – 2015
In the meanwhile, the average interest rate of saving in Vietnam’s market is around 6.5%.
From table above, all BEP in period of 2013 – 2015 were too low and in 2015 the figure was
negative. The figures stated that if the company uses financial leverage, the profit will get worse.
Therefore, company’s decreased and too low BEP is the third symptom of the company’s problem.
2.3 Possible problems
From the supportive theories, researches, datas and the following Dupont analysic, these
are possible problems of decreased profitability:
13
Ord.
1
Possible problems
Supportive theories
Poor management of cost and expenses Abdelmoneim et al (5)
leads to decreased profit margin
2
The ineffective utilization of asset leads Abdelmoneim et al (5)
to decreased asset turnover
Jovanovic et al (6)
Soliman et al (7)
3
Ineffective utilization of leverage factor
Yang (8)
Table 6. The possible problems and supportive theories
-
Abdelmoneim et al (5) carried out a study to propose a comprehensive strategic model to
manage profitability. Strategic management accounting concepts and tools are adopted to explore
and manage the main profitability drivers (cost, assets, and revenue). The results revealed that the
proposed comprehensive profitability model which contains cost, the assets and revenue
techniques was a better predictor of profitability than the alternative models, which contain a
combination of two variables.
-
Jovanovic et al (6) announced that one of the most important information is the level
of profitability of the company in terms of return on assets (ROA) and return on equity (ROE).
-
Soliman et al (7) conducted the study of the use of DuPont Analysis by Market Participants
and announced that DuPont analysis is a common form of financial statement analysis,
decomposes return on net operating assets into two multiplicative components: profit margin and
asset turnover.
-
Yang (8) aims to study the relationship among venture capital (VC), financial leverage and
enterprise performance by empirical study, utilizing the data from China's GEM (Growth
14
Enterprises Market) listed companies of 2010-2014. The empirical results show that: VC is
positively related to enterprise performance, and financial leverage is negatively correlated with
corporate performance.
In order to identify the possible problems of decreased profitability, the Dupont analysic is
applied. The DuPont identity is an expression that shows a company's return on equity (ROE) can
be represented as three other ratios: the profit margin, the total asset turnover and the equity
multiplier. The DuPont Analysis could show ROE is affected by operating efficiency, asset use
efficiency and financial leverage. Many researchers has conducted studies relevant to ROE and
Dupont analysic as the followings:
-
Muda et al (9) stated that ROE not only determines the profitability but also reflects the
extent of effectiveness of the management use of shareholders’ investments.
-
Penman (10) claim that ROE is best interpreted as a profitability measure, not a risk
measure and ROE indicates future profitability and thus distinguishes market-to-book ratios.
-
Klingenberg et al (11) proved that profitability ratios are Return on Asset (ROA), Return
on Equity (ROE) and Basic Earning Power (BEP).
-
Rao et al (12) used DuPont analysis in order to extend of ROE for deep analysis of financial
performance.
-
Jovanovic et al (6) used ROA and ROE to measure profitability in order to present financial
performances of 5 top companies in Serbian food industry, especially in meat industry (MI).
-
Khan et al (13) used profitability in the study measured by return on investment (ROI) and
return on equity (ROE).
-
Ibrahim (14) used three of accounting-based measures method to measure financial
performance, they are return on equity (ROE), return on assets (ROA), and gross profit margin.
15
The formula is:
ROE = Profit Margin x Asset Turnover x Leverage Factor
Net Income/Total Equity = (Net Income/Net Sales) x (Net Sales/Total Asset) x (Total Asset/Total
Equity)
According to calculations from financial reports, DuPont Analysis for NVT case is shown
in table below:
2013
DuPont (ROE) = (1) x (2) x (3)
2014
2015
4.83%
2.23%
-14.71%
Net Income/Net Sales (1)
19.58%
10.59%
-131.59%
Net Sales/Total Asset (2)
14.91%
14.70%
7.32%
Total Asset/ Total Equity (3) = (4) x (5)
165.57%
143.30%
152.68%
Total Asset/Total Debt (4)
355.31%
330.94%
289.83%
46.60%
43.30%
52.68%
Total Debt/ Total Equity (5)
Table 7. NVT DuPont Analysis 2013 - 2015
Table 6 shows an obvious analysis of components impacts ROE. Profit margin and Asset
turnover ratios decreased remarkably from 2013 to 2015 which caused decreased negative ROE.
Total Asset/Total Debt and Total Debt/Total Equity showed that NVT used leverage factor which
can affect the profitability of the company. Therefore, the possible problems of declined ROE are:
Poor management of cost and expenses or/and decreased net revenues leads to decreased
profit margin;
The ineffective utilization of asset or/and decreased net revenue leads to decreased asset
turnover;
Ineffective utilization of leverage factor.
16
2.4 Main problems
After using financial datas to analize three possible problems, main problems of decreased
profitability are increased interest expense and ineffective utilization of leverage factor which can
be supposed as the ineffective capital structure. This conclusion is proved as the following
analysics.
2.4.1 Interest expense increase
The table below shows an obvious look of financial expense from 2013 to 2015:
Value (In billion VND)
Position (%)
ITEMS
2013
2014
2015
2013
2014
2015
207.5
210.7
Financial income
33.8
29.1
20.8
16.3%
13.8% 11.0%
Financial expenses
-2.0
-1.8
-43.8
-1.0%
-0.9% -23.2%
Revenue
189.1 100.0% 100.0% 100.0%
Table 8. Interest Expense of NVT from 2013 to 2015
From table 8, financial expense were 1.8 billion VND with 0.9% increase to 43.8 billion
VND with 23.2%. In which, the interest expenses is 1.5 billion VND in 2014 and 37.7 billion VND
in 2015.
With the information from consolidated financial reports from 2013 to 2015, the
remarkable event which is the main reason why the interest expense increased significantly is
issuing the bonds. According to the contract buying bonds with warrant number 01-2100/HDDMTP/NVT, in November 11st 2014 the company successfully issued 23,000 bonds with total amount
of 230 billion VND to Nam Thanh CO.LTD (After that, Nam Thanh CO.LTD transferred all the
bonds to Vietnam Technological and Commercial Joint Stock Bank). The bond maturity is in 3
years and, the interest payment is half a year with the interest rate is 12% per year in two first
17
terms. The next rate is 3.5% plus basic interest rate of commercial bank department of Vietnam
Technological and Commercial Joint Stock Bank. Increasing debt lead to high interest expense
can be concluded as one of the main problems.
2.4.2 Ineffective utilization of leverage factor
With analysic from calculated datas of following table and supportive theories, ineffective
utilization of leverage factor as the ineffective capital structure using debt is the main problem of
the company:
NVT
RATIOS
2013
2014
OCH
2015
2013
2014
ASM
2015 2013
2014
VNG
2015
2013
2014
2015
STD to TA
19%
8%
10%
20%
45%
41%
33%
31%
24%
19%
22%
35%
LTD to TA
9%
21%
23%
21%
20%
20%
24%
17%
14%
6%
6%
21%
TD to TA
28%
30%
34%
41%
64%
62%
58%
48%
38%
25%
28%
56%
TD to TE
46%
43%
52%
72% 178% 163% 138%
94%
60%
34%
40% 127%
1,390 1,432 1,311 3,840 3,474 3,303 1,673 2,481 3,908
187
194
392
TA
TE
839
999
859 2,156 1,251 1,257
702 1,277 2,436
139
139
173
TD
391
432
456 1,555 2,223 2,046
969 1,203 1,422
47
55
219
STD
265
126
143
762 1,551 1,370
556
778
933
35
43
137
LTD
126
306
309
793
402
424
538
12
12
81
711
675
Table 9. Capital structure ratios of NVT and other companies from 2013 to 20 15
From the table above, the capital structure ratios showed that NVT used leverage factor
by increasing total debt. The company had a trend to reduce short-term debt from 265 billion VND
in 2013 down to 143 billion VND in 2015 and they increased long-term debt from 126 billion
VND in 2013 to 309 billion VND in 2015. The remarkable event in 2014, according to the contract
18
buying bonds with warrant number 01-2100/HDDM-TP/NVT, in November 11st 2014 the
company successfully issued 23,000 bonds with total amount of 230 billion VND. This event
partly made the long-term debt increase rapidly from 126 billion VND in 2013 up to 306 billion
VND in 2014.
In comparison with companies in the same industry, OCH has the much higher TD to TA
and TD to TE ratios than NVT and the ratios increased through the period of time, which means
OCH used higher leverage than NVT. From the table above, it is easy to proved that OCH used
leverage mainly on increasing STD than LTD. ASM also has the much higher TD to TA and TD
to TA ratios than NVT. However the company increased TE significantly from 702 to 2,436.
Therefore, TD to TA and TD to TE ratios increased throught the period of time. VNG used more
STD than LTD and tended to increase TD like the trend of NVT. The raised leverage from 25% to
56% of TD to TA. In a general look that other companies had trends to increase TD and TE in the
meanwhile NVT increased TD and decreased TE.
On another hand, with NVT’s situation, the BEP ratios in 2.2.3 stated that if the company
uses financial leverage, the profit will get worse. The illustration is the high financial expenses.
Vătavu (15) did a research to establish the relationship between capital structure and
financial performance in 196 Romanian companies listed on the Becharest Stock Exchange and
operating in the manufacturing sector, over a period of eight-years from 2003 to 2010. The results
indicated that performance in Romanian companies is higher when they avoid debt and operate
based on equity. The author also showed a preference for debt when they are in financial
difficulties and they face high business risks, or when they cannot settle their debts due to a lack
of cash.
19
Gill et al (16) sought to extend Abor's (2005) findings regarding the effect of capital
structure on profitability by examining the effect of capital structure on profitability of the
American service and manufacturing firms and they measured profitability by return on equity.
Therefore, the ineffective utilization of leverage factor as the ineffective capital structure
using debt is the main problem of the company.
High general and administrative expense and revenues deduction as well as the ineffective
utilization of asset and decreased revenues are considered to be one of the main problems.
Mohamed (17) stated that because revenue represents one of the most important drivers that
affect profitability, the aim in producing a model is to assist in the successful management
of profitability. However, the results from data analysics and information show that these problems
are unimportant problems.
The first unimportant problem is high general and administrative expense and revenues
deduction.
Value (In billion VND)
Position (%)
ITEMS
2013
2014
2015
2013
2014
2015
207.5
210.7
-0.2
-0.1
-93.0
207.3
210.6
96.1
-111.7
-113.0
Gross profit
95.6
97.6
26.0
46.1%
46.3% 13.7%
Financial income
33.8
29.1
20.8
16.3%
13.8% 11.0%
Financial expenses
-2.0
-1.8
-43.8
-1.0%
-0.9% -23.2%
-25.4
-26.6
Revenue
Revenue deduction
Net revenue
Cost of goods sold
Selling expenses
189.1 100.0% 100.0% 100.0%
-0.1%
0.0% -49.2%
99.9% 100.0% 50.8%
-70.1 -53.8% -53.6% -37.1%
-21.4 -12.2% -12.6% -11.3%
20
-62.3
-72.6
Operating profit
39.7
22.2
-123.6
19.1%
10.5% -65.4%
EBT
39.8
25.6
-123.0
19.2%
12.1% -65.0%
EAT
40.5
22.3
-127.7
19.5%
10.6% -67.5%
167.6
188.4
219.7 -39.7%
12.4% 16.6%
General and administrative expenses
Expenses growth
-102.6 -30.0% -34.5% -54.3%
Table 10. Income Statement of NVT from 2013 to 2015
From table 10, the cause of decreased profit margin is the revenue deductions dropped
down from -0.1 billion VND to -93 billion VND. The reason is from the project Six Senses Saigon
River of the Hai Dung CO.LTD. In 2010, Hai Dung CO.LTD recorded the revenue appropriate
with the foundation and civil work which were handed over to individual and enterprise customers
according to the buying and selling contracts of villas belongs to the resort Six Senses Saigon
River. However, until 2015, Hai Dung CO.LTD have not finished the interior work and the others
of the villas and the customer have not completed the payment of work items which were already
finished in 2010. In order to solve the problems of all parties in the contracts, they signed the
economic contract liquidation minutes. In which, Hai Dung CO.LTD would return the payment
which was payed to customers and receive all the documents, receipts relevant. Therefore, NVT
has recorded the returned goods in term in the revenue deductions.
From table 10, too high general and administrative expense is one of the problems that
affects profit margin. The position of this expense in 2013 was only 30.0% but increased to 54.3%
in 2015. In 2009, NVT bought 51% of Hong Hai Tourism JSC’s stocks with goodwill of 134.9
billion VND and 90% of Hai Dung CO.LTD capital with goodwill of 89.7 billion VND. Total
goodwill in the beginning of 2010 is 224.6 billion VND, allocated in 10 years and recorded in the
general and administrative expense. In 2015, the company recorded all the rest of goodwill from
21
buying Hai Dung CO.LTD into the general and administrative cost with the amount of 44.1 billion
VND on total general administrative cost of 102.6 billion VND. Therefore, the main reason is high
expense from goodwill allocation of buying subsidiaries.
With the above analysic of information and datas, the problems of high expense from
goodwill allocation of buying subsidiaries and revenue deductions will end from 2016. Therefore,
these problems can not be concluded as the main problems.
The second unimportant problem is the ineffective utilization of asset and decreased
revenues. Asset turnover ratio can often be used as an indicator of the efficiency. A company
deploys its assets in generating revenue. Asset turnover which is calculated by net sales/total asset
decreased during the period. Net sales as explained above was decreased significantly by the
revenue deductions of the problems happened to project Six Senses Saigon River. In the
meanwhile, total asset did not change significantly that decreased from 17.7% of growth in 2013
to -8.4% in 2015.
Value (In billion VND)
Growth (%)
ITEMS
2012
Net sales
Total asset
206.0
1,181.3
2013
207.3
2014
210.6
2015
2013
96.1
0.6%
1,390.4 1,432.5 1,311.8
17.7%
2014
2015
1.6% -54.4%
3.0%
-8.4%
Table 11. NVT’s net sales and total asset
The reason of ineffective utilization of asset is originally revenue deduction which will end
from 2015. Therefore, ineffective utilization of asset is not the main problem of decreased
profitability.
22
2.5 Possible causes of the problem
From supportive theories and information of the interview with Mr. Hoang Anh Dung, the
General Director of NVT’s, possible causes of inefficient capital structure using debts are:
Ord.
Possible causes
Supportive theories
1
Generating cash flow in order to finance the debts
Coricelli et al, Goel et al
2
Expanding by investing in the projects with high debt on Coricelli et al
total project investment
3
Tax shields
Jermias
4
Increasing efficiency
Jermias
5
Reducing the agency costs of free cash flow
Jensen
Table 12. Possible causes and supportive theories
Coricelli et al (18) demonstrated in their study that as leverage increases, the costs of debt
becomes larger and erode the net benefits to leverage. Highly-levered firms not only suffer from a
debt overhang problem, which reduces their incentives to invest in productive investment, their
attention is also diverted from productivity improvements by the need to generate cash flow in
order to service their debts.
Besides, Goel et al (19) proved that financial leverage shows the relationship between
borrowed funds and owner’s funds in the capital structure of a firm. It includes debt, common
equity and preferred equity that are used to finance the firm’s total assets, operations and financial
growth.
Jermias (20) analyzed the data of US manufacturing firms and observed that debt financing
not only offers the benefit of tax shields to cost leaders but also accords increased efficiency
due to constraints imposed by the debtholders.
23
Director of NVT’s, the problem of this company is the owner equity invested in the project are
much lower compared to the total investment such as Emeralda Ninh Binh project with equity 150
billion Vietnam dong but the total investment of 500 billion Vietnam dong, the Six Senses Saigon
River project with the equity of 110 billion Vietnam dong, but the total investment of 950 billion
Vietnam dong. In which, the pending project Six Senses Saigon River is the obviously direct
relevant reason to the results above. The cause of the disability to complete the project Six Sense
Saigon River leads to record of negative 92 billion Vietnam dong as revenue deduction is due to
depleted funds. The project which is uncompleted become the financial burden for Ninh Van Bay.
From Mr. Dung, the original and main reason in a long-term why business of Ninh Van
Bay inefficient is because the company has invested in projects right into the crisis, high interest
rates so the cost of capital much high leads to debts by debts.
According to Mrs. Ngo Thi Thanh Hai, the Chief Accountant of NVT and from Table 9, in
order to restructure the company's debt, increase working capital, invest in projects Six Senses
Saigon River, apart from the most notable financial debt of 230 billion Vietnam dong of bond
issuance in 2014, in December 31st 2014 Ninh Van Bay has had over 59 billion Vietnam dong in
short-term loan, of which more than 51 billion Vietnam dong as loans from shareholders and other
individuals with the interest rate from 12% to 17%, no security assets. This loan will be matured
before or in April 2015. In addition, there are more than 6.4 billion Vietnam dong of loan from the
Ninh Van Bay Holiday CO.LTD with the interest rate 15%, not with no security assets, maturing
on February 23rd 2015.
Mrs. Ngo Thi Thanh Hai claimed that although the company has successfully issued 230
billion Vietnam dong of bonds in 2014, but mostly the purpose is to finance the debt structure.
25
Jensen (21) suggested that debt reduces the agency costs of free cash flow by reducing the
cash flow available for spending at the discretion of managers.
From Mr. Hoang Anh Dung, the Six Senses Saigon River project has the equity of 110
billion Vietnam dong, but the total investment of 950 billion Vietnam dong. In the meanwhile, the
company invest in other big projects such as Emeralda Ninh Binh project with equity 150 billion
Vietnam dong but the total investment of 500 billion Vietnam dong. Therefore, the company could
not complete the project because of short of capital.
2.6 Main causes of the problem
Abor (22) conducted a research to examine the effect of debt policy (capital structure) on
the financial performance of small and medium-sized enterprises (SMEs) in Ghana and South
Africa. The results of his study indicated that capital structure influences financial performance,
although not exclusive. Moreover, he proved that the capital structure, especially long-term and
total debt ratios, negatively affect performance of SMEs.
Aivazian et al (23) showed that leverage is negatively related to investment and that this
negative effect is significantly stronger for firms with low growth opportunities than those with
high growth opportunities.
Zhong-qin et al (24) proved that a high leverage implies more monitoring efforts by
creditors on the firm's overinvestment and will have a negative effect on overinvestment.
Singh et al (25) used the data of US manufacturing firms and observed that higher leverage
adversely influences the future investment in R&D which may in turn leads to negative impact on
long-term operating performance and future growth opportunities.
Moreover, with the purpose to go further about the original and main reasons, a deep
interview with leaders of the company was conducted. From Mr. Hoang Anh Dung, the General
24