Fundamental planetary science physics chemistry and habitability 2
Bạn đang xem bản rút gọn của tài liệu. Xem và tải ngay bản đầy đủ của tài liệu tại đây (21.58 MB, 334 trang )
9.4 Mars
(a)
(b)
(c)
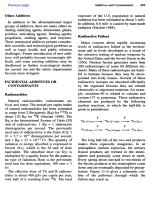
Figure 9.29 Image of a portion of the Kasei Vallis outflow channel system. (a) Large-scale view from Viking showing
flow patterns (arrows) in a portion of the Kasei Vallis outflow channel that created ‘islands’. The large white box shows
the outline of the Viking 1 image shown in panel (b), and the small white box outlines the area imaged by Mars Global
Surveyor (MGS), shown in panel (c). The large crater in the upper center of this overview scene is 95 km in diameter. Panel
(c) shows a 6-km-diameter crater that was once buried by about 3 km of martian ‘bedrock’. This crater was partly excavated
by the Kasei Valles floods more than a billion years ago. The crater is poking out from beneath an ‘island’ in the Kasei
Vallis. The mesa was created by a combination of the flood and subsequent retreat via small landslides of the scarp that
encircles it. (USGS Viking 1 mosaic; Viking 226a08; MOC34504)
Hills’. On approach, the rocks and soil changed.
The rocks became largely granular in appearance,
and both the rocks and soil in the hills are relatively rich in salts, suggestive of significant aqueous alteration compared with the rocks near the
landing site.
Opportunity landed in Eagle crater on Meridiani Planum, a landing site that was selected
because spectroscopic data from orbiting spacecraft revealed areas rich in the mineral hematite.
Hematite can form in various ways, some involving
the action of liquid water. With the rovers’ prime
Figure 9.30 Examples of landforms that contain martian gullies. These features are characterized by a half-circle-shaped
‘alcove’ that tapers downslope,
below which is an apron. The
apron appears to be made of
material that has been transported downslope through the
channels or gullies on the
apron. On the right is a larger
scale view of some such channels. (M03 00537, M07 01873;
Malin and Edgett 2000)
251
Terrestrial Planets and the Moon
Figure 9.31 COLOR PLATE A view from Mars Exploration Rover Spirit, taken during its winter campaign in 2006. In
the distance (850 m away) is ‘Husband Hill’ behind a dark-toned dune field and the lighter-toned ‘home-plate’. In the
foreground are wind-blown ripples along with a vesicular basalt rock. (NASA/JPL-Caltech/Cornell)
goal of searching for evidence of liquid water, in
the past or present, this appeared to be an opportune area for closer investigation. Opportunity
landed near a 30- to 50-cm high bedrock outcrop,
shown in Figure 9.32. The bedrock is mostly sandstone composed of materials derived from weathering of basaltic rocks, with several tens of percent (by weight) sulfate minerals, as magnesium
and calcium sulfates and the iron sulfate jarosite,
as well as hematite. Scattered throughout the outcroppings and partly embedded within, Opportunity discovered small (4– 6 mm across) gray/bluecolored spherules, ‘blueberries’, sometimes multiply fused, composed of >50% hematite by mass.
An image of the blueberries is shown in Figure 9.33. Blueberries are likely concretions that
Figure 9.32 A panoramic view from Mars Exploration Rover Opportunity of the ‘Payson’ outcrop on the western edge
of Erebus crater. One can see layered rocks in the ∼1 m thick crater wall. To the left of the outcrop, a flat, thin layer of
spherule-rich soil lies on top the bedrock. (NASA/JPL-Caltech/USGS/Cornell, PIA02696)
252
9.4 Mars
Figure 9.34 A false-color view of a mineral vein imaged
with the panoramic camera (Pancam) on NASA’s Mars
Exploration Rover Opportunity. The vein is about 2 cm wide
and 45 cm long. Opportunity found it to be rich in calcium
and sulfur, possibly the calcium–sulfate mineral gypsum.
(NASA/JPL/Cornell, PIA15034)
Figure 9.33 Small (millimeter-sized) spherules, dubbed
‘blueberries’, are scattered throughout the rock outcrop
near rover Opportunity’s landing site. The rocks show finely
layered sediments, which have been accentuated by erosion. The blueberries are lining up with individual layers,
showing that the spherules are concretions, which formed
in formerly wet sediments. (NASA/JPL/Cornell, PIA05584)
formed when minerals precipitated out of watersaturated rocks. In the same outcrops, small voids
or vugs in the rocks also hint at the past presence of
water; soluble materials, such as sulfates, dissolved
within the rocks, leaving vugs behind. Although
rocks partially dissolved or weathered away, the
hematite concretions fell out of the bedrock, covering the plains. The sulfate-rich sedimentary rocks
at Meridiani Planum, underneath a meter-thick
layer of sand, preserve a historic record of a climate that was very different from the martian conditions we know today. Liquid water most likely
covered Mars’s surface, at least intermittently, with
wet episodes being followed by evaporation and
desiccation.
While traversing Meridiani Planum, Opportunity investigated several craters. It reached Victoria
crater in September 2006 and ventured inside the
crater a year later. In Summer 2008, after climbing
out of Victoria crater, Opportunity set course to the
22-km-diameter Endeavour crater, where it arrived
in the summer of 2011. On its way, it investigated
Santa Maria crater. Layers of bedrock exposed
at Victoria and other locations revealed a sulfaterich composition indicative of an ancient era when
acidic water was present. After arriving at the
rim of the 22-km-diameter Endeavour crater, the
rover stumbled upon a vein, shown in Figure 9.34,
rich in calcium and sulfur, possibly made of the
calcium– sulfate mineral gypsum. This vein shows
that water must have flowed through underground
fractures in the rock, forming the chemical deposit
gypsum.
On August 6, 2012, the rover Curiosity landed on
Mars at Gale Crater. The HIRISE camera on MRO
captured the image of Curiosity and its parachute
shown in Figure 9.35. The overarching science goal
of this mission is to assess whether the landing area
has ever had or still has environmental conditions
favorable to microbial life, both its habitability and
its preservation.
9.4.7 Magnetic Field
Mars Global Surveyor detected surprisingly
intense localized magnetic fields, shown in Figure 9.36. The strongest field measured ∼0.16 nT
at an altitude of 100 km, which, in combination
with the ambient ionospheric pressure, is strong
enough to stand off and deflect the solar wind at
Mars. As at Venus, solar wind magnetic field lines
253
Terrestrial Planets and the Moon
Figure 9.35 NASA’s Curiosity rover and its parachute were photographed by HIRISE on MRO as Curiosity descended to the
surface on August 6, 2012. The parachute and rover are seen in the center of the white box; the inset image is a cutout of
the rover stretched to avoid saturation. (NASA/JPL-Caltech/Univ. of Arizona, PIA15978).
Utopia
Isidis
Hellas
Argyre
B (nT )
Figure 9.36 COLOR PLATE Smoothed magnetic map of Mars constructed from electron reflectometer data from Mars
Global Surveyor (MGS). The logarithmic color scale represents the crustal magnetic field magnitude at an altitude of 185
km overlaid on a topography map as derived from laser altimeter data on MGS. The lower limit of the color scale is the
threshold for unambiguously identified crustal features, and the scale saturates at its upper end. Black represents sectors
with fewer than 10 measurements within a 100-km radius. These regions are areas where there is a closed crustal magnetic
field and so the solar wind electrons cannot penetrate to the altitude of the spacecraft where they can be detected. The
four largest visible impact basins are indicated (dotted circles). (Adapted from Lillis et al. 2008)
254
Further Reading
are compressed and drape around the planetary
obstacle below the bow shock.
The localized magnetic fields on Mars are
caused by remanent crustal magnetism. Most of the
strong sources are located in the heavily cratered
highlands south of the crustal dichotomy boundary. There is no evidence for crustal magnetization
inside some of the younger giant ( 1000 km)
impact basins (e.g., Hellas, Utopia and Argyre).
These data suggest that early in the planet’s history, Mars may have had a geodynamo with a
magnetic moment comparable to, or larger than,
Earth’s dynamo at present.
Key Concepts
• The lunar surface is divided into two major
types of geological units. The highlands are old,
heavily cratered and relatively bright. The maria
are younger, dark basaltic units with few large
craters.
• Earth’s Moon is substantially depleted in iron
relative to all of the terrestrial planets and primitive meteorites. Nonetheless, it has a small Fedominated core.
• The Moon is also depleted in H2 O, but small
reservoirs of H2 O– ice exist in permanently
shadowed regions near the lunar poles. The polar
regions of Mercury also host H2 O– ice.
• Mercury is substantially enriched in iron relative
to all of the other terrestrial planets and primitive
•
•
•
•
•
•
•
meteorites. Mercury’s excess iron appears to be
concentrated in an Fe-dominated core. The outer
core is fluid, and a dipolar magnetic field is
generated in this region. Mercury’s surface is
depleted in Fe and Ti and enriched in the volatile
element sulfur.
Both the Moon and Mercury have very tenuous
atmospheres. The constituents of these atmospheres escape rapidly and must be continually replenished from the solar wind or internal
sources.
Venus has a thick CO2 -dominated atmosphere
that induces several hundred degrees of greenhouse warming at the surface.
Venus is enshrouded by SO2 -rich clouds that
give the planet a high albedo and obscure the
view of the surface.
Venus lacks plate tectonics and therefore has
a single-peaked altitude distribution in contrast
to the ocean– continent dichotomy seen on
Earth.
Mars’s radius is half that of Earth, and its
mountains and valleys are substantially higher
because of the lower surface gravity.
Mars has a thin CO2 -dominated atmosphere
with a surface pressure less than 1% that of
Earth.
At present, Mars is cold and dry. But dry river
beds imply that significant quantities of water
flowed on the martian surface billions of years
ago.
Further Reading
Excellent reviews of each of the planets, including
Earth as a planet, are provided in:
Encyclopedia of the Solar System, 2nd Edition. Eds.
L. McFadden, P.R. Weissman, and T.V. Johnson.
Academic Press, San Diego. 482pp.
255
Terrestrial Planets and the Moon
Problems
9-1. (a) Use the present-day lunar cratering rate
given in §6.4.4 to estimate the average crater
density (km−2 ) for craters more than 4 km
in size for a region that is 3.3 Gyr old.
(b) Explain why the same procedures cannot be used to provide a good estimate of the
lunar maria.
9-2. The secondary craters related to a primary
crater of a given size on Mercury typically
lie closer to the primary crater than do the
secondary craters of a similarly sized primary on the Moon. Presumably, this is the
result of Mercury’s greater gravity reducing
the distance that ejecta travel.
(a) Verify this difference quantitatively by
calculating the ‘throw distance’ of ejecta
launched at a 45◦ angle with a velocity of
1 km s−1 from the surfaces of Mercury and
the Moon.
(b) Typical projectile impact velocities are
greater on Mercury than they are on the
Moon. Why doesn’t this difference counteract the surface gravity effect discussed earlier?
9-3. By examining the morphology of craters of
various sizes in Figure 9.8, deduce:
(a) the direction to the Sun
(b) the form of the depth/diameter ratio for
craters as a function of diameter
9-4. Mercury’s mean density ρ = 5430 kg m−3 .
This value is very close to the planet’s
uncompressed density. If Mercury consists
entirely of rock (ρ = 3300 kg m−3 ) and iron
(ρ = 7950 kg m−3 ), calculate the planet’s
fractional abundance of iron by mass.
9-5. Does the shaking last longer for moonquakes
or for earthquakes? Why?
9-6. How cold can the inside of a shadowed crater
on the Moon be? Follow the derivation of
equilibrium temperature for a rapidly rotating planet in §4.1.3 but make a series of
assumptions to make the problem more realistic:
(a) Compute the usual equilibrium temperature for the Moon.
(b) Instead of assuming direct overhead
sunlight, adjust the incident light intensity
to be appropriate for a very high latitude on
the Moon. You will need to work out the
geometry to relate latitude to incident flux
and derive an equation relating equilibrium
temperature to latitude. What is the equilibrium temperature at 89◦ S?
(c) Make a plot showing the equilibrium
temperature as a function of latitude.
(d) What would be the surface temperature
at a location that sees only 1 hour of sunlight
per lunar day?
9-7. Estimate the temperature at the surface of
Mercury at the following places and times.
State the assumptions that you make for your
calculations.
(a) At the subsolar point when Mercury is
at perihelion
(b) At the subsolar point when Mercury is
at apohelion
256
Problems
(c) 45◦ from the subsolar point when
Mercury is at apohelion
Mars (other than elevation) and give one
possible explanation for the difference.
9-8. Although in some respects Earth and Venus
are ‘twin planets’, they have very different atmospheres. For example, the surface
pressure on Venus is almost 2 orders of
magnitude larger than that on Earth.
(a) Calculate the mass of each atmosphere;
state your answer in kilograms.
(b) Recalculate these values for Earth,
including Earth’s oceans as part of its
‘atmosphere’. (If all of the water above
Earth’s crust were spread evenly over the
planet, this global ocean would be ∼3 km
deep.)
(c) Compare the values for the two planets
and comment.
9-12. Consider the impact between an iron meteoroid (ρ = 7 000 kg m−3 ) with a diameter
of 300 m and the Moon.
(a) Calculate the kinetic energy involved
if the meteoroid hits the Moon at v = 12
km s−1 .
(b) Estimate the size of the crater formed
by a head-on collision and one in which the
angle of impact with respect to the local
horizontal is 30◦ .
(c) If rocks are excavated from the
crater with typical ejection velocities of
500 m s−1 , calculate how far from the main
crater one may find secondary craters.
9-9. State and explain two pieces of evidence,
one physical and the other chemical, that
Mars was warmer and wetter in the distant
past than it is at the present epoch.
9-10. (a) Estimate the typical collision velocity
of asteroids with Mars.
(b) Calculate the size of a crater produced
by the impact of a 10-km-radius stony
asteroid onto Mars at this speed.
9-11. Contrast the differences between the northern lowlands and southern highlands on
9-13. Repeat the same questions as in Problem
9-12 for Mercury. Comment on the similarities and differences.
9-14. After the Moon has been hit by the meteoroid from Problem 9-12, many rocks are
excavated from the crater during the excavation stage.
(a) If the ejection velocity is 500 m s−1 ,
calculate how long the rock remains in
flight if its ejection angle with respect to
the ground is 25◦ , 45◦ and 60◦ .
(b) Calculate the maximum height above
the ground reached by the three rocks
from (a).
257
CHAPTER 10
Planetary Satellites
I had now decided beyond all question that there existed
in the heavens three stars wandering about Jupiter as do
Venus and Mercury about the Sun, and this became plainer
than daylight from observations on similar occasions which
followed. Nor were there just three such stars; four
wanderers complete their revolution about Jupiter . . .
Galileo, The Starry Messenger, 1610
258
10.1 Moons of Mars: Phobos and Deimos
Six of the eight major planets in our Solar System, as well as many minor planets, are orbited
by smaller companion satellites, often referred to
as moons. The largest moons, Jupiter’s Ganymede
and Saturn’s Titan, are more voluminous than is
the planet Mercury, albeit not as massive. Jupiter’s
Callisto is almost as large as the aforementioned
three bodies, and Io and Europa, the other two
moons discovered by Galileo four centuries ago,
straddle Earth’s Moon in size. In contrast, most
known moons are tiny bodies, from a few kilometers to tens of kilometers in size. Objects classified as moons span a range of several thousand in
radius and one hundred billion (1011 ) in mass, so
it should come as no surprise that this is a very
heterogeneous category of celestial bodies.
Large moons are nearly spherical, whereas small
ones can be quite oddly shaped; the dividing line is
about 200 km in radius. Dynamically, moons fall
into two classes, regular satellites traveling on lowinclination, near-circular orbits within a few dozen
planetary radii of the planet and irregular satellites,
most of which orbit at much greater distances and
have large eccentricities and inclinations.
Most moons are airless, but Titan has a N2 /CH4 dominated atmosphere that has a higher surface
pressure than that which we experience on Earth.
Neptune’s Triton, the largest moon in our Solar
System not mentioned above, has a surface pressure only 10−5 times that of Titan yet still orders
of magnitude larger than that of any other known
moon.
The vast majority of moons are geologically
dead, and impact craters are the dominant features on most moons that are large enough to be
roundish. A few moons, however, form dramatic
exceptions to this general trend. Io is the most volcanically active body in the Solar System, and Saturn’s moon Enceladus spews out gigantic geysers
from its south pole. Europa’s icy crust, which has
solidified in the geologically recent past, lies above
a still-liquid H2 O ocean. This liquid water, warmed
by tidal heating, makes Europa a prime target for
speculations on the possible existence of a variety of life forms. Conditions may be analogous
to those near hot vents in the deep ocean on early
Earth. Liquid hydrocarbon lakes have been discovered near Titan’s poles, and numerous channel-like
features on Titan’s surface are indicative of liquid
flows. Triton and the much smaller moon Miranda
(which orbits Uranus) have varied and intriguing
surfaces. The Voyager 2 spacecraft discovered liquid nitrogen geysers on Triton.
In this chapter, we discuss the moons of the
five planets orbiting exterior to our Earth. The two
inner planets lack moons, although they may once
have had satellites that were long ago lost to tidal
decay (§2.7.2). Earth’s Moon, more analogous in
many ways to terrestrial planets than to the bodies considered here, is included in Chapter 9, and
satellites of minor planets are discussed with their
larger companions in Chapter 12.
Our treatment is organized by heliocentric distance, beginning with the moons of Mars and ending with those of Neptune. We concentrate on
moons that are the most interesting from a geological, and in some cases astrobiological, perspective.
10.1 Moons of Mars: Phobos
and Deimos
Mars has two small moons, Phobos and Deimos,
traveling on nearly circular orbits close to the
planet’s equatorial plane. Both their visual albedos, Av ∼ 0.07, and their spectral properties are
similar to those of carbonaceous asteroids. Their
densities, ∼2000 kg m−3 , suggest their composition to be either a mixture of rock and ice or
primarily rock with significant void space.
Phobos, the larger of the pair with mean radius
R ≈ 11 km, orbits Mars at a distance of 2.76 R♂ ,
which is well inside the synchronous orbit, and
tiny Deimos (R ≈ 6 km) orbits Mars outside synchronous orbit at 6.92 R♂ . Both satellites are in
259
Planetary Satellites
Phobos is heavily cratered, close to saturation.
Its most unusal features are the linear depressions
or grooves, typically 10– 20 m deep, which are
centered on the leading apex of Phobos in its orbit.
These grooves may have formed as (secondary)
crater chains from material ejected into space from
impacts on the surface of Mars. Deimos’s surface is
rather smooth and shows prominent albedo markings, varying from 6%– 8%. The images also show
a concavity 11 km across, twice as large as the
mean radius of the object.
10.2 Satellites of Jupiter
Figure 10.1 Image of Phobos, the inner and larger of the
two moons of Mars, taken by Mars Express in 2004. The spatial resolution is 7 m/pixel. (ESA/DLR/FU Berlin, G. Neukum)
synchronous rotation. Images of these two moons
are shown in Figures 10.1 and 10.2. It is not surprising that both objects, being so small (Table E.5),
are oddly shaped.
Figure 10.2 Image of Deimos taken 21 February 2009 at
a spatial resolution of 20 m/pixel. (HiRISE/MRONASA/JPL/
University of Arizona, PIA11826)
Jupiter’s four largest moons, shown in Figure 10.3,
range in size from Europa, which is slightly smaller
than Earth’s Moon, to Ganymede, the largest moon
in our Solar System. They are collectively referred
to as the Galilean satellites, named after Galileo
Galilei, who discovered them in 1610.
10.2.1 Io
Io’s mass and density are similar to those of Earth’s
Moon. However, in contrast to the Moon, no impact
craters have been seen on Io, and hence its surface
must be extremely young, less than a few Myr.
Io’s youthful surface and spectacular visual appearance result from the extreme volcanic activity on
this moon. Examples of plumes and eruptions are
shown in Figure 10.4.
Reflectance spectra, such as the one shown at the
top of Figure 10.5, reveal a surface rich in SO2 frost
and other sulfur-bearing compounds. In addition,
mafic minerals such as pyroxene and olivine have
been identified in Io’s dark (volcanic) calderas.
Io’s orbit is slightly eccentric and remains eccentric despite Jupiter’s strong tidal forces because
the satellite is locked in a 4:2:1 orbital resonance
with the satellites Europa and Ganymede. Jupiter’s
strong tidal variations cause daily distortions in Io’s
shape that are many tens of meters in amplitude.
260
10.2 Satellites of Jupiter
Figure 10.3 COLOR PLATE Galilean satellites: Io, Europa, Ganymede, and Callisto, shown (left to right) in order of
increasing distance from Jupiter. All satellites have been scaled to a resolution of 10 km/pixel. Images were acquired
in 1996 and 1997. (NASA/Galileo Orbiter PIA01299)
Because Io is not perfectly elastic, this leads to dissipation of massive amounts of energy in its interior, so much that Io’s global heat flux is ∼20– 40
times as large as the terrestrial value. This amount
of heat is too large to be removed by conduction
or solid-state convection. Melting therefore occurs,
and lavas erupt through the surface via giant volcanoes. More than 400 volcanic calderas, up to
200 km in size, are distributed over Io’s surface. Some of the lava flows from the calderas are
hundreds of kilometers long. Io further displays
a variety of geological features, such as ridges,
mountains, and calderas, all of which are probably connected to the satellite’s extreme volcanic
activity.
Observations of Io at (near-) infrared wavelengths reveal a body covered by numerous hot
spots, as exemplified in Figure 10.6. Hot spots are
usually associated with low-albedo regions at visible and near-infrared (1– 2.5 µm) wavelengths, as
visualized in the top panel of Figure 10.6. When
Io is in eclipse (i.e., in Jupiter’s shadow) its nearIR luminosity is dominated by thermal emission
from glowing hot spots, as shown in the lower
panel of Figure 10.6. Hot spots appear at random
times; because it takes time for the hot lava to cool
off, a hot spot usually lasts for weeks to months
and may stay ‘active’ for years. Blackbody fits to
near-infrared (1– 5 µm) spectra reveal temperatures in excess of 1000 K, indicative of silicate
volcanism, as on Earth. Some observations suggest temperatures exceeding 1700 K, which would
indicate volcanism driven by ultramafic magmas
(e.g., komatiites), a style of volcanism that has not
occurred for billions of years on Earth.
Some of the hot spots are associated with volcanic plumes, such as the Tvashtar eruption in
2007, shown in Figure 10.7a. Plumes are usually
dominated by SO2 gas and often also dust. These
volcanic gases have probably led to large areas
being covered by SO2 ice. Sublimation of this ice,
in addition to direct outgassing from the vents, produces Io’s atmosphere, which is largely composed
of sulfur dioxide. The spacecraft image of Io in
eclipse shown in Figure 10.7b reveals hot spots,
volcanic plumes, and auroral glows.
The combination of Io’s detailed shape and gravity field, both influenced by tidal and rotational
forces, provides constraints on the satellite’s internal properties. Io’s core extends to ∼40%– 50%
of its radius. Overlying Io’s core is a hot silicate mantle, topped off with a lower density crust
and lithosphere that may be ∼30– 40 km thick.
The observed eruption temperatures, as well as
measurements of variations in Jupiter’s magnetic
field near Io, are consistent with a partially molten
261
(a)
(b)
(c)
26 Nov 1999
22 Feb 2000
Figure 10.4 COLOR PLATE (a) A 140-km high plume rises above the bright limb of Io (see inset at upper right) on 28 June
1997. A second plume is located near the terminator (see inset at lower right). The shadow of the 75-km high plume
extends to the right of the eruption vent near the center of the bright and dark rings. The blue color of the plumes is
caused by light scattering off micron-sized dust grains, which makes the plume shadow reddish. (NASA/Galileo Orbiter
PIA00703). (b) Images of Pele taken on 4 April 1997, 19 September 1997, and 2 July 1999 show dramatic changes on lo’s
surface. Between April and September 1997, a new dark spot, 400 km in diameter, developed surrounding Pillan Patera,
just northeast of Pele. The plume deposits to the south of the two volcanic centers also changed, perhaps due to interaction
between the two large plumes. The image from 1999 shows further changes, such as the partial covering of Pillan by new
red material from Pele. A new eruption took place in Reiden Patera, northwest of Pillan, that deposited a yellow ring.
(NASA/Galileo, PIA02501) (c) A pair of images taken of Tvashtar Patera. The eruption site has changed locations over a
period of a few months in 1999 and early 2000. (NASA/Galileo, PIA02584)
10.2 Satellites of Jupiter
10.2.2 Europa
Figure 10.5 Spectra of the Galilean satellites. (Clark et al.
1986)
global magma layer that is concentrated in a 50km-thick asthenosphere.
Sublimation of SO2 frost from Io’s surface, volcanism and sputtering create a tenuous yet collisionally thick atmosphere around the satellite.
Ions corotating with Jupiter’s magnetosphere have
typical velocities of 75 km s−1 and hence readily overtake Io, which orbits Jupiter at the Keplerian speed of 17 km s−1 . The ions interact with
Io’s atmosphere, which leads to the formation of a
cloud of particles, including, for example, O, S, Na,
and K, around Io, referred to as the neutral cloud.
Upon ionization, the newly formed ions move with
Jupiter’s magnetic field and form the Io plasma
torus, a donut-shaped region of charged particles
surrounding Jupiter located near Io’s orbit. Io’s
neutral cloud and plasma torus are discussed in
more detail in §8.1.4.
Europa is slightly smaller and less dense than the
Moon. Its surface is very bright and has the spectral properties of nearly pure water-ice. Europa’s
moment of inertia ratio, I/(MR2 ) = 0.346, implies
a differentiated, centrally condensed body. Its
mean density of 3010 kg m−3 is indicative of
a rock/ice composition wherein the rocky mantle/core provides more than 90% of the mass.
Europa is therefore best modeled as a mostly rocky
body with perhaps a metal core overlain with an
H2 O ‘layer’ ∼100– 150 km thick. The top of the
H2 O layer is a solid ice crust, whose thickness may
be as small as a few kilometers or as large as a few
tens of kilometers. Part of the lower portion of the
H2 O layer must be liquid; an underground ocean
is suggested by details in surface topology and,
most convincingly, from measurements of Jupiter’s
magnetic field near Europa. This liquid ocean is
maintained by tidal heating and decouples the ice
shell from Europa’s interior.
Europa’s surface is relatively flat compared with
the surfaces of, for example, Io and the Moon.
Only a few tens of impact craters with radii over
2 km have been detected, implying a surface age
of tens to at most a few hundred million years.
Most of the geologic features that have been seen
on Europa’s surface were produced by diurnal
tidal stresses. The oldest terrain is characterized
by ridged plains, which are often criss-crossed
by younger bands. In many places, two parallel ridges are separated by a V-shaped trough, as
shown in Figures 10.8 and 10.9. These wedgeshaped ridges may have formed by an expansion
of the crust or when two ice plates pulled slightly
apart. Warmer, slushy, or liquid material may have
been pushed up through the crack, forming a ridge.
The brownish color suggests that the slush consists in part of rocky material, hydrated minerals
or clays, or salts.
Although most ridges are linear in shape, some
of them, the cycloids (Fig. 10.8a), are curved. The
263
Planetary Satellites
Figure 10.6 Images of Io at 2.2 µm (left) and 3.8 µm (right), taken with the Keck telescope, equipped with adaptive optics.
(top): Io in sunlight. At both wavelengths, Io’s emission is dominated by sunlight reflected off the satellite. Because the
Sun’s intensity is lower at 3.8 µm than at 2.2 µm and 3.8 µm is closer to the peak of a typical hot spot’s blackbody curve,
hot spots are easier to recognize at a wavelength of 3.8 µm than at 2.2 µm. Note that some volcanoes (Loki, Dazhbog)
show up as hot spots at 3.8 µm but as low-albedo features at 2.2 µm. (bottom): Io in eclipse. Images of Io taken 2 hours
later, after the satellite had entered Jupiter’s shadow. Without sunlight reflecting off the satellite, even faint hot spots can
be discerned by taking images with longer exposure times. The difference in brightness between the two wavelengths
gives an indication of the temperature of the spot. Both Loki and Dazhbog, very bright at 3.8 µm, are low-temperature
(∼500 K) hot spots. Surt and Janus, on the other hand, are also very bright at 2.2 µm, indicative of higher temperatures
(∼800 K). (Adapted from de Pater et al. 2004a)
cycloidal shape results from the propagation of a
crack in the surface caused by diurnal stresses,
producing a curved rather than straight feature.
One of the youngest features on the satellite’s surface is the chaotic terrain, displayed in
Figure 10.9. The morphology of these features
resembles kilometer-scale blocks or sheets of ice
‘floating’ on softer or slushy ice below. Some of
these broken-up plates have been rotated, tilted, or
moved. They can be reassembled like a jigsaw puzzle. In these areas, ocean water may have reached
the surface and produced new crust.
Other intriguing extremely young features are
lenticulae, the Latin term for freckles (Fig. 10.8b).
Their morphology suggests that they originate
from convective upwelling of warm buoyant ice in
264
10.2 Satellites of Jupiter
(a)
(b)
Figure 10.7 (a) An image of the 2006–2007 Tvashtar eruption, captured by the New Horizons spacecraft, 28 February 2007.
Io’s day side is overexposed to bring out faint details in the plumes and on the moon’s night side. On the night side, at
the ‘center’ of the eruption, the glow of the hot lava is visible as a bright point of light. Another plume is illuminated
by Jupiter just above the lower right edge. (b) A LORRI New Horizons image of Io in eclipse, showing only glowing
hot lava (the brightest points of light), as well as auroral displays in Io’s tenuous atmosphere and the moon’s volcanic
plumes. The edge of Io’s disk is outlined by the auroral glow produced as charged particles from Jupiter’s magnetosphere
bombard the (patchy) atmosphere. Both images are composites of images taken at wavelengths between 350 and 850
nm. (NASA/APL/SWRI, PIA09250, PIA09354)
(a)
(b)
Figure 10.8 (a) Europa’s southern hemisphere. The upper left portion of the image shows the southern extent of
the ‘wedges’ region, an area that has undergone extensive disruption. The image covers an area approximately 675
by 675 km, and the finest details that can be discerned are about 3.3 km across. (NASA/Galileo Orbiter, PIA00875)
(b) Reddish spots and shallow pits pepper the surface of Europa. The spots and pits on this image are about 10 km
across. (PIA03878; NASA/JPL/University of Arizona/University of Colorado)
265
Planetary Satellites
(a)
(b)
(c)
Figure 10.9 COLOR PLATE (a) The 26-km diameter impact crater Pwyll, just below the center of the image, is likely one of
the youngest major features on the surface of Europa. The central dark spot is ∼40 km in diameter, and bright white rays
extend >1000 km in all directions from the impact site. One can also discern several dark lineaments, called ‘triple bands’
because they have a bright central stripe surrounded by darker material. The order in which these bands cross each other
can be used to determine their relative ages. The image is 1240 km across. (NASA/Galileo Orbiter, PIA01211) (b) A closeup
of the X-shaped ridges north of the Pwyll crater. The area covered in this panel is ∼250 × 200 km. Surface features such
as domes and ridges, as well as ‘disrupted terrain’, can be distinguished. (NASA/Galileo Orbiter, PIA01296) (c) Amplified
view of a small region of the thin, disrupted ice crust in the Conamara region of Europa, the disrupted terrain displayed
in panel b. The white and blue colors outline areas that have been blanketed by a fine dust of ice particles ejected at the
time of formation of the large crater Pwyll. The image covers an area of 70 × 30 km; north is to the right. (NASA/Galileo
Orbiter, PIA01127)
266
10.2 Satellites of Jupiter
Figure 10.10 A region just
south of the multiring impact
crater Asgard on Callisto reveals
numerous bright, sharp knobs,
approximately 80–100 m high.
They may consist of material
thrown outward from a major
impact billions of years ago.
These knobs, or spires, are very
icy but also contain some darker
dust. As the ice erodes, the
dark material appears to slide
down and accumulate in lowlying areas. The lower close-up
image shows somewhat older
terrain, judging from the number of impact craters. Comparison of these images suggests
that the spires erode away over
time. (NASA/JPL/Arizona State
University, PIA03455)
diapirs, somewhat analogous to lava lamps. This
could lead to domes when the diapirs reach the
surface and depressions where the diapir does not
break through to the surface but instead weakens
or melts the ice above it, which subsequently sags
down.
Because Europa’s surface is covered by waterice, it is not surprising that this satellite has a
tenuous oxygen atmosphere. Sputtering processes
knock water molecules off Europa’s surface; upon
dissociation, this H2 O breaks up into hydrogen
and oxygen. Hydrogen escapes the low gravity
field of Europa, leaving an oxygen-rich atmosphere
behind. In addition to O, both Na and K have
been detected in Europa’s extremely tenuous atmosphere.
10.2.3 Ganymede and Callisto
The outer two Galilean satellites represent a fundamentally different type of body from the inner
two. Their low densities, ρ = 1940 kg m−3 for
Ganymede and ρ = 1830 kg m−3 for Callisto, are
suggestive of a mixture of comparable amounts
(by mass) of rock and ice. Global views of these
two huge moons are shown in Figure 10.3, and
Figures 10.10 and 10.11 show close-up images of
specific regions on Callisto and Ganymede, respectively. Ice has been observed in the spectra of both
bodies (Fig. 10.5), but it is far more contaminated
than the ice on Europa’s surface.
Impact craters are ubiquitous on both satellites. Callisto’s surface is essentially saturated with
medium-sized craters, although there is a dearth
of (sub-) kilometer-sized craters. Most craters on
both moons are flatter than those on our Moon, and
some show unique features. These characteristics
have been attributed to the relatively low (compared with rock) viscosity of the icy crust, even at
low temperatures. Craters 2– 3 km in diameter
reveal the classic bowl-shaped morphology (§6.4),
and at larger sizes, central peaks appear. In some
cases, all that can be distinguished from an impact
crater is a large bright circular patch, some with
267
Planetary Satellites
Figure 10.11 View of the Marius Regio and Nippur Sulcus
area on Ganymede showing the dark and bright grooved
terrain, which is typical on this satellite. The older, more
heavily cratered dark terrain is rutted with furrows, shallow troughs perhaps formed as a result of ancient giant
impacts. Bright grooved terrain is younger and was formed
through tectonics, probably combined with icy volcanism.
The image covers an area ∼664 × 518 km at a resolution of
940 m/pixel. (NASA/Galileo Orbiter, PIA01618)
and others without concentric rings around them.
These features, called palimpsests, are similar to
large impact basins but lack any topographic relief;
such relief was probably present initially but was
erased by relaxation caused by flowing subsurface
ice.
Callisto’s surface shows signs of weakness or
crumbling at small scales, which can be seen in
Figure 10.10. This crumbling or degradation may
be produced by sublimation of a volatile component of the crust and may bury or destroy craters,
leading perhaps to the above-mentioned lack of
(sub-) kilometer-sized craters.
The geology of Ganymede is more diverse than
that of Callisto. At low resolution Ganymede
resembles the Moon, in that both dark and light
areas are visible (Fig. 10.3). However, in contrast
to the Moon, the dark areas on Ganymede’s surface are the oldest regions, being heavily cratered,
nearly to saturation. The lighter terrain is less
cratered, albeit more than the lunar maria, so it
must be younger than the dark terrain, although
probably still quite old. The light-colored terrain
shown in Figure 10.11 is characterized by a complex system of parallel ridges and grooves, up to
tens of kilometers wide and maybe a few hundred
meters high. These features are clearly of endogenic origin.
Ganymede’s low moment of inertia ratio,
I/(MR2 ) = 0.312, implies that its mass is heavily
concentrated towards the center. Most intriguing
was the discovery of a magnetic field of intrinsic
origin around this satellite, and hence Ganymede
must have a liquid metallic core, most likely with
a small solid inner core. Best fits to the gravity,
magnetic field, and density data are obtained with
a three-layer internal model in which each layer is
∼900 km thick. The innermost layer is a metallic core surrounded by a silicate mantle, which is
topped off by a thick H2 O– ice shell. The water
may be liquid at a depth of ∼150 km (2 kbar),
where the temperature (253 K) corresponds to the
minimal melting point of water.
Callisto’s moment of inertia, I/(MR2 ) = 0.355,
is slightly less than expected for a pressure compressed, yet compositionally homogeneous, mixture of ice and rock. The data are not conclusive,
but it has been speculated that Callisto may be
partially differentiated, with an icy crustal layer (a
few hundred kilometers) and an ice/rock mantle
that is slightly denser towards the center of the
satellite. The magnetometer on board the Galileo
spacecraft discovered magnetic field disturbances
that suggest the presence of a salty ocean within
Callisto. As on Ganymede, such an ocean may exist
at a depth of ∼150 km.
268
10.3 Satellites of Saturn
60 km
Figure 10.12 The four small, irregularly shaped ‘ring’ moons that have orbits within Jupiter’s ring system. The moons are
shown in their correct relative sizes. From left to right, arranged in order of increasing distance from Jupiter, are Metis,
Adrastea, Amalthea, and Thebe. (NASA/Galileo Orbiter, PIA01076)
10.2.4 Jupiter’s Small Moons
Jupiter has dozens of known moons, but the others
are all very small compared with the Galilean satellites. Their combined mass is about 1/1000 that of
Europa, the smallest of the Galilean satellites.
Inner Satellites
Four moons have been detected inside the orbit of
Io; images of all four are shown in Figure 10.12.
The largest, Amalthea, with a mean radius of
83.5 km, is distinctly nonspherical in shape, dark
and red, and heavily cratered. Its low density,
860 ± 100 kg m−3 , combined with a presumed
rocky composition, implies substantial voids, suggestive of a ‘rubble pile’ composition. Shock waves
from impacts on such a porous body are quickly
damped, which might explain how Amalthea can
have several craters almost half its size. The low
density itself hints at a violent collisional history.
The other inner satellites of Jupiter, Thebe, Metis
and Adrastea, are also dark and red. All four of
these moons are obviously associated with, and
likely provide most of the particles in, Jupiter’s
dusty rings (§13.3.1).
Irregular Satellites
Jupiter’s outer moons are much farther away from
Jupiter than are the Galilean satellites. Their orbits
are highly eccentric and inclined, in many cases
retrograde. Collectively they are referred to as the
irregular satellites. As of early 2013, almost 60
such satellites had been discovered.
The orbital elements of Jupiter’s irregular satellites are not randomly distributed but reveal the
presence of dynamical groupings. Five such ‘families’ have been identified. Each of these families most likely resulted from the breakup of
a body (likely an asteroid, judging from spectra) subsequent to capture by Jupiter. The giant
planet is also known to have captured Jupiterfamily comets in the past. Some such bodies
orbited Jupiter for decades before being ejected
from the system or colliding with the planet (e.g.,
comet D/Shoemaker– Levy 9; §8.1.2) or with a
satellite.
10.3 Satellites of Saturn
Saturn has more than 60 known satellites, many
of which are discussed in the following subsections. Titan is by far the largest satellite, with a
mass more than 20 times that of all other saturnian satellites combined (Table E.5). In addition to
Titan, we also devote an entire subsection (§10.3.3)
to Enceladus, which is a most enigmatic small
moon.
269
Planetary Satellites
10.3.1 Titan
Titan, Saturn’s largest satellite, was discovered in
1655 by Christiaan Huygens. With a radius of
2575 km, Titan is similar in size to Ganymede,
Callisto, and Mercury. Its mean density of
1880 kg m−3 puts Titan in the ‘icy’ satellite class
(∼50% rock, 50% ice by mass).
Titan’s most distinctive attribute is its dense
atmosphere, with a surface pressure of 1.44 bar.
This atmosphere is composed primarily of nitrogen and a small but significant amount of methane.
Methane is easily dissociated by solar photons;
photolysis would destroy all CH4 in Titan’s atmosphere within ∼20– 30 million years. Hence, its
(presumably) continued presence of methane in
Titan’s atmosphere is a puzzle. Methane must
somehow be resupplied to Titan’s atmosphere, perhaps via a methane cycle analogous to the hydrological cycle on Earth (i.e., via evaporation of
oceans, formation of clouds, and precipitation).
As on the giant planets, photolysis of methane
gas should lead to the production of numerous hydrocarbons, including acetylene (C2 H2 ),
ethylene (C2 H4 ), and ethane (C2 H6 ). Because
of the low stratospheric temperature, C2 H6 and
other such photochemically produced complex
molecules condense to form a dense layer of smog
in Titan’s atmosphere. Laboratory measurements
by Carl Sagan and coworkers in a simulated Titan
atmosphere show the formation of such ‘gunk’, a
reddish-brown powder referred to as tholins. The
smog particles ultimately sediment out and fall to
the ground, where they might have built up, over
the eons, a few-hundred-meter thick layer of hydrocarbons.
Titan is covered globally by an optically thin
methane-ice cloud at altitudes of 25– 35 km. A
persistent light methane drizzle below this cloud
is present, at least near the Xanadu mountains.
During the summer, distinct clouds were seen near
Titan’s south pole. In addition, cloud features have
been seen regularly at southern mid-latitudes, near
−40◦ . Although the former clouds may have been
triggered by the high surface temperature during
the summer, the latter ones may be confined latitudinally by Titan’s geography and/or by a global
atmospheric circulation pattern. Large, but shortlived, clouds were observed over tropical latitudes near the epoch of the saturnian equinox. The
Cassini spacecraft identified a large cloud of ethane
over Titan’s north (winter) pole in the upper troposphere, and some smaller (presumably methane)
clouds at lower altitudes, which have been hypothesized as lake effects. At much higher altitudes,
in the stratosphere and mesosphere, distinct haze
layers are present.
The dense (photochemical) smog layer in Titan’s
atmosphere makes it impossible to remotely probe
the satellite’s surface at visible wavelengths. The
smog is transparent, however, at longer wavelengths, so the surface can be imaged at infrared
wavelengths outside of the methane absorption
bands. An example of such an infrared image is
shown in Figure 10.13a, with a view of the Huygens
probe landing site near the Xanadu mountains
taken by the Cassini Orbiter presented in panel
b. Both images show significant surface albedo
variations.
The combined observations of the Cassini
Orbiter and photographs such as those shown in
Figure 10.14 that were taken below the haze by
the Huygens probe reveal a surface that has been
etched by fluids. Cassini radar images show numerous channels that cut across different types of terrain. Radar-bright rivers may be filled with boulders, and radar-dark channels suggest the presence
of either liquids or smooth deposits. Lakes filled
with hydrocarbon liquids have been discovered at
high latitudes. One area with lakes is shown in Figure 10.15. The depth and extent of these lakes have
been observed to vary over time. However, even if
all of the radar-dark features over both poles, which
combined cover more than 600 000 km2 (about 1%
270
10.3 Satellites of Saturn
(a)
(b)
Figure 10.13 (a) An image of Titan’s surface at a wavelength of 2.06 µm, obtained with the adaptive optics system on
the W.M. Keck telescope one day after the descent of the Huygens probe on 14 January 2005. (Adapted from de Pater
et al. 2006c) (b) Map of the region on Titan’s surface as outlined (approximately) in panel (a), taken by the Cassini
Orbiter at a wavelength of 938 nm. The Huygens probe landing site is indicated by an arrow. (NASA/JPL Cassini Orbiter,
PIA08399)
Only a handful of craters have been detected
on Titan, indicative of a geologically young
surface, perhaps a few hundred million years old.
Many radar-bright ‘flows’ may be cryovolcanic
of Titan’s total surface area), are filled with liquids,
it may not be enough to explain Titan’s methane
cycle in a manner analogous to the hydrological
cycle on Earth.
(a)
(b)
Figure 10.14 (a) Mosaic of
three frames from the Huygens probe shows a remarkable view of a ‘shoreline’
and channels, from an altitude of 6.5 km. The bright
‘island’ is about 2.5 km long.
(NASA/ JPL/ ESA/ University
of Arizona, PIA07236) (b)
After landing, the Huygens
probe obtained this view
of Titan’s surface, including 0.1–0.15 mm sized rocks,
presumably made of ice.
(ESA/NASA/JPL/University of
Arizona, PIA06440)
271
Planetary Satellites
10.3.2 Midsized Saturnian Moons
Figure 10.15 Cassini radar images of lakes of liquid hydrocarbons near Titan’s north pole. The lakes are darker
than the surrounding terrain, indicative of regions of
low backscatter. The strip of radar imagery is foreshortened to simulate an oblique view of the highest latitude
region, seen from a point to its west. (NASA/JPL/USGS,
PIA09102)
lava flows, resurfacing Titan at a rapid rate. Such
volcanic activity would also supply methane gas
to the atmosphere. One ∼180-km-wide feature
may be a shield volcano, with a ∼20-km diameter
caldera at its center and sinuous channels and/or
ridges radiating away from the caldera. Numerous
longitudinal dunes, shown in Figure 10.16, dark
both in radar echoes and at infrared wavelengths,
are present in the equatorial region. These dunes
are all oriented in the east– west direction and are
up to thousands of kilometers long. The orientation of the dunes has been used to derive the wind
direction, which contrary to expectation is towards
the east rather than the west.
Saturn’s six midsized moons range in radius from a
little under 200 km (Mimas) up to 750 km (Rhea).
Their densities range from just under 1000 kg m−3
(Tethys) up to 1600 kg m−3 (Enceladus), implying
that they are ice-rich bodies with different amounts
of rock. All of these moons are relatively spherical,
suggestive of relatively low viscosities in their interiors at some point in their histories. Apart from one
hemisphere of Iapetus, Saturn’s midsized satellites
are quite bright, with albedos, Av , ranging from
about 0.3 up to 1.0. All show water-ice in their
surface spectra.
Detailed images taken by various spacecraft
show that each satellite has its own unique characteristics. We defer discussion of Enceladus to
the next subsection and show images of Saturn’s four other midsized satellites that orbit interior to Titan in Figure 10.17. The surfaces of
Mimas, Tethys, and Rhea are heavily cratered.
Mimas is characterized by one gigantic crater
near the center of its leading hemisphere, about
140 km in diameter, one-third the moon’s own
size. The crater is about 10 km deep, and the
central peak is ∼6 km high. The impacting body
must have been ∼10 km across. Tethys displays
an ∼2000-km-long complex of valleys or troughs,
Ithaca Chasma, which stretches three-quarters of
the way around the satellite. Dione exhibits variations in surface albedo of almost a factor of two,
which is much larger than those seen on Rhea
but much less extreme than Iapetus’s hemispheric
asymmetry.
Iapetus, shown in Figure 10.18, is a bizarre
body, with its trailing hemisphere ∼10 times
as bright as the leading hemisphere (Av ≈ 0.5
vs. Av ≈ 0.05). The black material on its leading hemisphere is reddish and might consist of
organic, carbon-bearing compounds. Iapetus may
just sweep up low albedo ‘dirt’ from Saturn’s magnetosphere, such as dust from the dark satellite
Phoebe. Iapetus’s most remarkable topographic
272
10.3 Satellites of Saturn
Figure 10.16 Part of Titan’s surface as mapped by the Cassini radar instrument. Three of Titan’s major surface features –
dunes, craters and the Xanadu mountains – are shown. The hazy bright area at the left that extends to the lower center
of the image marks the northwest edge of Xanadu. In the upper right is the crater Ksa, and the dark lines between these
two features are linear dunes, similar to sand dunes on Earth in Egypt and Namibia. These longitudinal dunes make up
most of Titan’s equatorial dark regions. These ∼100-km-long features run east–west on the satellite, are 1–2 km wide
and spaced similarly, and are roughly 100 m high. They curve around the bright features in the image – which may be
high-standing topographic obstacles – following the prevailing wind pattern. Unlike Earth’s (silicate) sand dunes, these
may be solid organic particles or ice coated with organic material. The image covers an area 350 km × 930 km, with a
resolution of about 350 m/pixel. (NASA/JPL Cassini Orbiter, PIA14500)
feature is a mysterious ∼1300-km-long ridge, up
to 20 km high at places, that coincides almost
exactly with its geographic equator, as shown in
Figure 10.18. Crater counts suggest the ridge to
be ancient. Isolated peaks are observed at many
of the places where segments of the ridge are
absent.
10.3.3 Enceladus
Enceladus, with a radius of only 250 km, is a most
remarkable satellite. Parts of this moon are heavily cratered, but large regions on the surface show
virtually no impact craters at all. The youngest
parts are probably no more than one million years
old, and the oldest terrain solidified billions of
years ago. Enceladus’s surface reflectivity is very
high, implying fresh, uncontaminated ice. With a
bulk density of 1600 kg m−3 , the satellite probably
has a rocky core (R ≈ 170 km, ρ ≈ 3000 kg m−3 )
and an ∼80-km-thick icy crust. As on Ganymede
and Europa, the crust displays regions of grooved
terrain, indicative of tectonic processes, and
smoother parts, possibly resurfaced by water flows.
Enceladus orbits Saturn between Mimas and
Tethys. Cassini’s discovery of giant plumes of
vapor, dust, and ice emanating from Enceladus’s
south pole was unexpected. The first evidence for
active geysers came from Cassini’s magnetometer data, which found a bending of field lines
around the moon, indicative of mass-loading processes such as observed on Io (§§8.1.4 and 10.2.1).
The plumes emanate from ‘cracks’ in the satellite’s south polar region. Figure 10.19 shows these
cracks, dubbed tiger stripes. Cassini detected temperatures of at least 180 K along some of the brightest tiger stripes, well above the 72-K background
temperatures at other places in the south polar
region. When flying through the plume, Cassini
measured a gas composition similar to that seen
273
Planetary Satellites
Mimas
Tethys
Dione
Rhea
Figure 10.17 Images (not to scale) of Saturn’s inner midsized satellites other than Enceladus. The cratered surface of
Mimas shows its 140-km-diameter crater Herschel (PIA06258). Tethys shows its anti–Saturn-facing hemisphere. The rim
of the 450-km-diameter impact basin Odysseus lies on the eastern limb, making the limb appear flatter than elsewhere. Other large craters seen here are Penelope (left of center) and Melanthius (below center) (PIA08870). The
trailing hemisphere of Dione shows many bright cliffs. At lower right is the feature called Cassandra, exhibiting linear rays extending in multiple directions (PIA08256). Rhea’s crater-saturated surface shows a large bright blotch and radial
streaks, which were likely created when a geologically recent impact sprayed out bright, fresh ice ejecta (PIA08189).
(All images taken by the Cassini spacecraft; NASA/JPL/SSI)
274
10.3 Satellites of Saturn
10.3.4 Small Regular Satellites of Saturn
Figure 10.18 The leading side of Iapetus, displayed in this
image, is about ten times darker than its trailing side. An
ancient, 400-km-wide impact basin shows just above the
center of the disk. Along the equator is a conspicuous, 20km-wide topographic ridge that extends from the western (left) side of Iapetus almost to the day/night boundary
on the right. On the left horizon, the peak of the ridge
rises at least 13 km above the surrounding terrain. (Cassini,
NASA/JPL/SSI, PIA06166)
in comets. These plumes are likely the source of
most of the material in Saturn’s E ring. An image of
Enceladus in Saturn’s E ring is displayed in Figure
10.20.
The observed geyser activity on Enceladus
requires a substantial heat source, the cause of
which is still a puzzle. Primordial heat or radioactive decay is not sufficient, and tidal heating
resulting from orbital eccentricities excited by its
2:1 orbital resonance with Dione may only be
marginally adequate. Because the plume is composed primarily of water, it may erupt from chambers of liquid water just below the surface. The jets
may also be ‘driven’ by diapirs, where warmer
buoyant material (mushy ice or liquid) moves
upwards through the ice shell to ‘explode’ into
jets on the surface.
All of Saturn’s small inner moons are oddly
shaped, heavily cratered and as reflective as Saturn’s larger satellites. Hyperion, shown in Figure
10.21, is ∼400 × 250 × 200 km and saturated with
craters that appear to be deeply eroded. Its jagged
and decidedly nonspherical shape implies that it is
a collisional remnant of a larger body. Hyperion is
the only satellite that displays a chaotic rotation.
The small inner moons of Saturn are shown
to scale in Figure 10.22. Two of these moons,
Janus and Epimetheus, share the same orbits and
change places every four years (§2.2.2). Calypso
and Telesto are located at the L4 and L5 Lagrangian
points of Tethys’s orbit, and Helene and Polydeuces reside in Dione’s Lagrangian points. Atlas
is a small moon orbiting just outside the A ring.
Prometheus and Pandora are the inner and outer
shepherds of Saturn’s F ring and play a key
role in shaping the kinky appearance of this ring
(Fig. 13.24). The Cassini spacecraft discovered the
satellites Pallene and Methone between the orbits
of Mimas and Enceladus. Pallene is embedded
within a faint ring of material. Pan and Daphnis orbit within the Encke and Keeler gaps within
Saturn’s A ring, respectively. The densities of these
inner moons are very low, less than that of water
(Table E.5). Such low densities imply that the
moons are very porous.
10.3.5 Saturn’s Irregular Moons
A large number of smaller irregular satellites
orbit Saturn at relatively large distances ( 20 ×
106 km). These moons typically move in highly
eccentric and inclined orbits, many of which are
retrograde, suggestive of captured objects rather
than formation within Saturn’s subnebula.
Phoebe is by far the largest of Saturn’s irregular
moons and the only one for which we have resolved
images. The moon is very dark (Av ≈ 0.06), similar to that of C-type asteroids and comets. Phoebe’s
275