Mankiew Chapter 4 - Tài liệu kinh tế học công cộng - nguyên lý kinh tế
Bạn đang xem bản rút gọn của tài liệu. Xem và tải ngay bản đầy đủ của tài liệu tại đây (2.8 MB, 63 trang )
4
The Market Forces of Supply and
Demand
PRINCIPLES OF
FOURTH EDITION
N. G R E G O R Y M A N K I W
PowerPoint® Slides
by Ron Cronovich
© 2007 Thomson South-Western, all rights reserved
In this chapter, look for the answers to
these questions:
What factors affect buyers’ demand for goods?
What factors affect sellers’ supply of goods?
How do supply and demand determine the price of
a good and the quantity sold?
How do changes in the factors that affect demand
or supply affect the market price and quantity of a
good?
How do markets allocate resources?
CHAPTER 4
THE MARKET FORCES OF SUPPLY AND DEMAND
2
Markets and Competition
A market is a group of buyers and sellers of a
particular product.
A competitive market is one with many buyers
and sellers, each has a negligible effect on price.
A perfectly competitive market:
• all goods exactly the same
• buyers & sellers so numerous that no one can
affect market price – each is a “price taker”
In this chapter, we assume markets are perfectly
competitive.
CHAPTER 4
THE MARKET FORCES OF SUPPLY AND DEMAND
3
Demand
Demand comes from the behavior of buyers.
The quantity demanded of any good is the
amount of the good that buyers are willing and
able to purchase.
Law of demand: the claim that the quantity
demanded of a good falls when the price of the
good rises, other things equal
CHAPTER 4
THE MARKET FORCES OF SUPPLY AND DEMAND
4
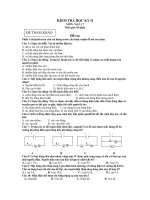
The Demand Schedule
Demand schedule:
A table that shows the
relationship between the
price of a good and the
quantity demanded.
Example:
Helen’s demand for lattes.
Notice that Helen’s
preferences obey the
Law of Demand.
CHAPTER 4
Price Quantity
of
of lattes
lattes demanded
$0.00 16
1.00 14
2.00 12
3.00 10
4.00 8
5.00 6
6.00 4
THE MARKET FORCES OF SUPPLY AND DEMAND
5
Helen’s Demand Schedule & Curve
Price of
Lattes
Price Quantity
of
of lattes
lattes demanded
$0.00 16
1.00 14
2.00 12
3.00 10
4.00 8
5.00 6
6.00 4
Quantity
of Lattes
CHAPTER 4
THE MARKET FORCES OF SUPPLY AND DEMAND
6
Market Demand versus Individual Demand
The quantity demanded in the market is the sum of
the quantities demanded by all buyers at each price.
Suppose Helen and Ken are the only two buyers in
the Latte market.
(Qd = quantity demanded)
Price
Helen’s Qd
Ken’s Qd
Market Qd
$0.00
16
+
8
=
24
1.00
14
+
7
=
21
2.00
12
+
6
=
18
3.00
10
+
5
=
15
4.00
8
+
4
=
12
5.00
6
+
3
=
9
6.00
4
+
2
=
6
The Market Demand Curve for
Lattes
P
P
Qd
(Market)
$0.00 24
1.00 21
2.00 18
3.00 15
4.00 12
5.00 9
6.00 6
Q
CHAPTER 4
THE MARKET FORCES OF SUPPLY AND DEMAND
8
Demand Curve Shifters
The demand curve shows how price affects
quantity demanded, other things being equal.
These “other things” are non-price determinants
of demand (i.e., things that determine buyers’
demand for a good, other than the good’s price).
Changes in them shift the D curve…
CHAPTER 4
THE MARKET FORCES OF SUPPLY AND DEMAND
9
Demand Curve Shifters: # of buyers
An increase in the number of buyers causes
an increase in quantity demanded at each price,
which shifts the demand curve to the right.
CHAPTER 4
THE MARKET FORCES OF SUPPLY AND DEMAND
10
Demand Curve Shifters: # of buyers
P
Suppose the number
of buyers increases.
Then, at each price,
quantity demanded
will increase
(by 5 in this example).
Q
CHAPTER 4
THE MARKET FORCES OF SUPPLY AND DEMAND
11
Demand Curve Shifters: income
Demand for a normal good is positively related
to income.
• An increase in income causes increase
in quantity demanded at each price, shifting
the D curve to the right.
(Demand for an inferior good is negatively
related to income. An increase in income shifts
D curves for inferior goods to the left.)
CHAPTER 4
THE MARKET FORCES OF SUPPLY AND DEMAND
12
Demand Curve Shifters: prices of
related
goods
Two goods are substitutes if
an increase in the price of one causes
an increase in demand for the other.
Example: pizza and hamburgers.
An increase in the price of pizza
increases demand for hamburgers,
shifting hamburger demand curve to the right.
Other examples: Coke and Pepsi,
laptops and desktop computers,
compact discs and music downloads
CHAPTER 4
THE MARKET FORCES OF SUPPLY AND DEMAND
13
Demand Curve Shifters: prices of
related
goods
Two goods are complements if
an increase in the price of one causes
a fall in demand for the other.
Example: computers and software.
If price of computers rises, people buy fewer
computers, and therefore less software.
Software demand curve shifts left.
Other examples: college tuition and textbooks,
bagels and cream cheese, eggs and bacon
CHAPTER 4
THE MARKET FORCES OF SUPPLY AND DEMAND
14
Demand Curve Shifters: tastes
Anything that causes a shift in tastes toward a
good will increase demand for that good
and shift its D curve to the right.
Example:
The Atkins diet became popular in the ’90s,
caused an increase in demand for eggs,
shifted the egg demand curve to the right.
CHAPTER 4
THE MARKET FORCES OF SUPPLY AND DEMAND
15
Demand Curve Shifters:
expectations
Expectations affect consumers’ buying
decisions.
Examples:
• If people expect their incomes to rise,
their demand for meals at expensive
restaurants may increase now.
• If the economy turns bad and people worry
about their future job security, demand for
new autos may fall now.
CHAPTER 4
THE MARKET FORCES OF SUPPLY AND DEMAND
16
Summary: Variables That Affect Demand
Variable
A change in this variable…
Price
…causes a movement
along the D curve
No. of buyers
…shifts the D curve
Income
…shifts the D curve
Price of
related goods
…shifts the D curve
Tastes
…shifts the D curve
Expectations
…shifts the D curve
CHAPTER 4
THE MARKET FORCES OF SUPPLY AND DEMAND
17
ACTIVE LEARNING
Demand curve
1:
Draw a demand curve for music downloads.
What happens to it in each of the following
scenarios? Why?
A. The price of iPods
falls
B. The price of music
downloads falls
C. The price of
compact discs falls
18
1:
A. price of iPods falls
ACTIVE LEARNING
Music
Music downloads
downloads
and
and iPods
iPods are
are
complements.
complements.
A
A fall
fall in
in price
price of
of
iPods
iPods shifts
shifts the
the
demand
demand curve
curve for
for
music
music downloads
downloads
to
to the
the right.
right.
Price of
music
downloads
P1
D1
Q1
Q2
D2
Quantity of
music downloads
19
1:
B. price of music downloads falls
ACTIVE LEARNING
Price of
music
downloads
The
The D
D curve
curve
does
does not
not shift.
shift.
Move
Move down
down along
along
curve
curve to
to aa point
point with
with
lower
lower P,
P, higher
higher Q.
Q.
P1
P2
D1
Q1
Q2
Quantity of
music downloads
20
ACTIVE LEARNING
C. price of CDs falls
1:
CDs
CDs and
and
music
music downloads
downloads
are
are substitutes.
substitutes.
A
A fall
fall in
in price
price of
of CDs
CDs
shifts
shifts demand
demand for
for
music
music downloads
downloads
to
to the
the left.
left.
Price of
music
downloads
P1
D2
Q2
Q1
D1
Quantity of
music downloads
21
Supply
Supply comes from the behavior of sellers.
The quantity supplied of any good is the
amount that sellers are willing and able to sell.
Law of supply: the claim that the quantity
supplied of a good rises when the price of the
good rises, other things equal
CHAPTER 4
THE MARKET FORCES OF SUPPLY AND DEMAND
22
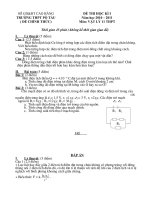
The Supply Schedule
Supply schedule:
A table that shows the
relationship between the
price of a good and the
quantity supplied.
Example:
Starbucks’ supply of lattes.
Notice that Starbucks’
supply schedule obeys the
Law of Supply.
CHAPTER 4
Price
of
lattes
Quantity
of lattes
supplied
$0.00 0
1.00 3
2.00 6
3.00 9
4.00 12
5.00 15
6.00 18
THE MARKET FORCES OF SUPPLY AND DEMAND
23
Starbucks’ Supply Schedule & Curve
Price
of
lattes
P
Quantity
of lattes
supplied
$0.00 0
1.00 3
2.00 6
3.00 9
4.00 12
5.00 15
6.00 18
Q
CHAPTER 4
THE MARKET FORCES OF SUPPLY AND DEMAND
24
Market Supply versus Individual Supply
The quantity supplied in the market is the sum of
the quantities supplied by all sellers at each price.
Suppose Starbucks and Jitters are the only two
sellers in this market.
(Qs = quantity supplied)
Price
Starbucks
Jitters
Market Qs
$0.00
0
+
0
=
0
1.00
3
+
2
=
5
2.00
6
+
4
=
10
3.00
9
+
6
=
15
4.00
12
+
8
=
20
5.00
15
+
10
=
25
6.00
18
+
12
=
30