Managerial accounting, 5th by jiambalvo test bank ch14
Bạn đang xem bản rút gọn của tài liệu. Xem và tải ngay bản đầy đủ của tài liệu tại đây (275.65 KB, 71 trang )
CH A PTER 14
Analyzing Financial Statements: A Managerial Perspective
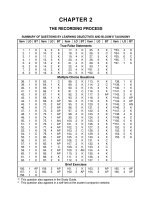
Summary of Questions by Objectives and Bloom’s Taxonomy
Item SO
BT Item
True-False Statements
1.
1
K
7.
2.
1
K
8.
3.
1
C
9.
4.
1
C
10.
5.
1
K
11.
6.
2
C
12.
Multiple Choice Questions
31.
1
K
53.
32.
1
K
54.
33.
6
K
55.
34.
5
K
56.
35.
2
C
57.
36.
5
K
58.
37.
5
K
59.
38. 5,6
K
60.
39. 5,6
C
61.
40.
2
K
62.
41.
5
K
63.
42.
6
K
64.
43.
2
K
65.
44.
2
K
66.
45.
2
K
67.
46.
2
K
68.
47.
2
K
69.
48.
2
C
70.
49.
2
C
71.
50.
2
AP
72.
51.
3
C
73.
52.
2
K
74.
Matching
139. 1,2,
K
4,5
Exercises
140.
2
AP 144.
141.
2
AP 145.
142.
2
AN 146.
143.
2
AN 147.
Challenge Exercises
156.
7
AN 157.
Short-Answer Essays
159.
1
K
161.
160.
1
K
162.
SO
BT
Item
SO
BT
2
2
2
2
3
2
C
K
K
C
K
K
13.
14.
15.
16.
17.
18.
2
2
2
2
3
3
K
K
K
K
K
K
7
5
5
7
5
5
5
5
5
6,7
5
5
5
5
5
5
5
5
5
5
5
5
K
K
C
K
K
C
K
K
K
C
C
AP
AP
AP
AP
AN
AN
AP
AP
AP
AP
AP
75.
76.
77.
78.
79.
80.
81.
82.
83.
84.
85.
86.
87.
88.
89.
90.
91.
92.
93.
94.
95.
96.
5
6
6
6
6
6
6
6
6
6
6
6
6
6
6
6
6
6
7
7
7
7
AP
K
K
K
K
K
K
AP
AP
AP
AP
AP
K
K
C
AP
AP
AP
K
K
C
C
2
4
4
5
AN
AN
AN
AN
148. 5,6,7 AN
149. 5
AP
150. 6
AP
151. 6 AN
6
AN
158.
5
AN
2
5
K
C
163.
164.
4
6
C
C
Item
SO
BT
19.
20.
21.
22.
23.
24.
4
4
5
5
5
5
K
K
K
K
K
C
97.
98.
99.
100.
101.
102.
103.
104.
105.
106.
107.
108.
109.
110.
111.
112.
113.
114.
115.
116.
117.
118.
7
7
7
7
7
2
5
5
2
2
2
5
5
5
5
6
6
6
6
7
7
7
C
AP
AP
AP
AP
AP
AP
AP
AP
AP
C
AP
AP
AP
C
AP
AP
AP
AP
AP
AP
AP
152. 5,6,7
153.
7
154.
7
155.
7
165.
166.
5
6
AN
AN
AN
AP
C
C
Item
SO
BT
25.
26.
27.
28.
29.
30.
6
6
7
7
7
7
K
K
K
K
K
K
119.
120.
121.
122.
123.
124.
125.
126.
127.
128.
129.
130.
131.
132.
133.
134.
135.
136.
137.
138.
7
2
5
5
2
5
5
5
6
6
6
6
7
7
7
7
7
7
7
7
AP
AP
AP
AP
C
AP
AP
AP
AP
AP
AP
C
AP
AP
AP
AP
AP
AN
AN
AN
14-2
Test Bank to accompany Jiambalvo Managerial Accounting, 5th Edition
TRUE-FALSE
1.
A managerial accountant may analyze his/her company’s own financial statements in order to
assess the appearance of his/her firm to investors.
2.
One reason a managerial accountant might need to analyze financial statements of other firms is
to assess the viability of a vendor.
3.
To assess control of operations, managers expect that successful implementation of their plan will
be reflected in subsequent financial statements as substantially increased profits.
4.
It is important for managers to analyze their company’s financial statements so that they can
anticipate and answer questions from investors and creditors.
5.
In general, managers should analyze financial statements primarily from the perspective of their
customers.
6.
Whenever an asset increases, the corresponding part of the transaction will always be an increase
to net income.
7.
Vertical analysis is performed on the balance sheet because it represents a point in time, while
horizontal analysis is performed on the income statement because it covers a period of time.
8.
An increase in gross margin of 7% from one period to the next implies that the company’s net
income will have increased by 7% as well.
9.
The statement of cash flows divides a company’s profitability into operating, investing, and
financing activities.
10.
If sales revenue of a retail company increases by 10% because the company sells more units of
product, the company’s cost of goods sold will increase by 10% as well.
11.
If a company records fictitious sales, income will increase, but operating cash flows will not be
affected.
12.
Common size financial statements are an example of horizontal analysis.
13.
Horizontal analysis examines the change in financial statement amounts over time.
14.
One example of vertical analysis is the determination that long-term assets increased by 2.5%
over time.
15.
One example of vertical analysis is the determination that interest expense rose from 1.2% of net
sales to 1.4% of net sales from one period to the next period.
16.
When the amount of net sales is used as the base amount for all income statement items,
horizontal analysis is being performed.
17.
If net income is substantially less than operating cash flows, this is a sign of possible accounting
irregularities.
Chapter 14 Analyzing Financial Statements: A Managerial Perspective
14-3
18.
Recording fictitious sales will cause operating cash flows and net income to increase.
19.
The management discussion and analysis section of the annual report explains financial results
that are not obvious simply from reading the basic financial statements.
20.
News articles and credit reports are valuable sources of financial information.
21.
Financial leverage relates to a company’s use of debt financing to acquire and use productive
assets.
22.
Earnings per share is the amount of net income earned in a company that is paid out as cash
dividends to shareholders.
23.
The gross margin percentage is a turnover ratio that measures the efficiency with which a
company sells its products.
24.
If a company’s return on total assets is higher than its return on common stockholders’ equity, a
company is using financial leverage effectively.
25.
An increase in inventory turnover implies that a company is selling its inventory and collecting
cash from customers more quickly.
26.
Turnover ratios involve both a balance sheet and an income statement account.
27.
Debt-related ratios reveal the ability of a company to pays its obligations when they become due.
28.
A high debt-to-equity ratio implies that a company has more risk than a company with a low ratio.
29.
Times interest earned measures how many times operating income is able to pay the company’s
interest expense.
30.
The acid-test ratio is a more stringent test of a company’s ability to pay its short-term debt
compared to the current ratio.
Answers
1
2
3
4
5
6
T
T
F
T
F
F
7
8
9
10
11
12
F
F
F
T
T
F
13
14
15
16
17
18
T
F
T
F
F
F
19
20
21
22
23
24
T
T
T
F
F
F
25
26
27
28
29
30
F
T
T
T
T
T
14-4
Test Bank to accompany Jiambalvo Managerial Accounting, 5th Edition
MULTIPLE CHOICE
31.
Which of the following is not a reason that managers need to analyze financial reports?
A.
To assess control of operations
B.
To assess the ability of customers to pay their bills
C.
To assess the viability of suppliers
D.
To maximize annual bonuses
32.
Which of the following is a reason that managers use financial statements?
A.
To assess the company’s image
B.
To assess the product cost of competitors
C.
To assess competitors’ contribution margins
D.
To assess the long-term viability of key customers
33.
Which of the following does accounts receivable turnover measure?
A.
The ability of a company to pay its short-term obligations
B.
The number of times receiveables are collected during the period
C.
The efficiency with which a company generates sales on credit
D.
The length of time it takes to collect receivables
34.
Which of the following indicates the amount investors are willing to pay per dollar of earnings?
A.
Market price per share of a company’s stock
B.
Earnings per share
C.
Price-earnings ratio
D.
Return on total assets
35.
Using the balance sheet equation, which of the following is not a possible transaction?
A.
Increase an asset and increase stockholders’ equity
B.
Increase a liability and decrease stockholders’ equity
C.
Increase an asset and decrease a liability
D.
Decrease an asset and decrease a liability
36.
Which of the following is the return a company is able to earn on funds invested by shareholders?
A.
Return on total assets
B.
Return on common stockholders’ equity
C.
Price-earning ratio
D.
Dividends paid
37.
Which of the following is not an operating activity on the statement of cash flows?
A.
Paying a dividend
B.
Paying for inventory purchases
C.
Collecting cash from the sale of merchandise
D.
Paying cash for income taxes
38.
Which of the following is not a profitability ratio?
A.
Price-earnings ratio
B.
Return on total assets
C.
Earnings per share
D.
Asset turnover
Chapter 14 Analyzing Financial Statements: A Managerial Perspective
14-5
39.
Which of the following changes is the least favorable?
A.
An increase in inventory turnover
B.
A decrease in operating expenses
C.
An increase in the price-earnings ratio
D.
A decrease in the asset turnover
40.
Net cash provided by operations represents
A.
net income converted to a cash basis.
B.
the net increase in cash and cash equivalents for a period.
C.
the cash provided by selling inventory to customers.
D.
a measure of profitability.
41.
What does financial leverage measure?
A.
How quickly a company generates profit from its assets
B.
How quickly a company is turning its net income into cash
C.
The overall efficiency with which a company uses assets to generate revenues
D.
How effectively the company uses debt financing to acquire economic resources
42.
What is asset turnover?
A.
How quickly a company generates profit from its assets
B.
How quickly a company is turning its net income into cash
C.
The overall efficiency with which the company uses assets to generate revenues
D.
How quickly the company acquires economic resources
43.
Which of the following is true concerning vertical analysis?
A.
It is a technique for evaluating a series of financial statement data over a period of time.
B.
It is used to determine the increase or decrease that has taken place over a period of time.
C.
It is expressed as a percentage of the base year amount of the same account.
D.
It is also called common size analysis.
44.
Which of the following is true concerning horizontal analysis?
A.
It is also called common size analysis.
B.
It consists of analyzing changes in financial statement amounts across time.
C.
It consists of analyzing financial statements in terms of a base amount.
D.
It restates each income statement line item as a percentage of net sales.
45.
Which type of analysis would highlight the percentage increase in sales from one year to the
next?
A.
Horizontal analysis
B.
Vertical analysis
C.
Common size analysis
D.
Comprehensive analysis
46.
What type of analysis will you perform to compare the gross margin percentage from one year to
the next?
A.
Debt-related analysis
B.
Turnover analysis
C.
Horizontal analysis
D.
Vertical analysis
14-6
Test Bank to accompany Jiambalvo Managerial Accounting, 5th Edition
47.
In which of the following will the percentage increase in sales from one year to the next be most
obvious?
A.
Profitability analysis
B.
Turnover analysis
C.
Horizontal analysis
D.
Vertical analysis
48.
If the rate of growth in sales is greater than the rate of growth in cost of goods sold from one year
to the next, which of the following will you most likely expect?
A.
The gross margin percentage is increasing.
B.
The gross margin percentage is decreasing.
C.
Accounts receivable turnover is declining.
D.
Inventory turnover is declining.
49.
Which of the following will vertical analysis allow managers to readily identify?
A.
Sales are increasing at a faster rate than selling expenses
B.
The percentage change in sales from the prior year
C.
Sales are growing at a faster rate than assets
D.
Income taxes are a larger percentage of sales in the current year compared to a previous
year
50.
Gross margin in 2014 for Beaver Enterprises totaled $1,000,000. If cost of goods sold is 60% of
sales, how much is sales?
A.
$400,000
B.
$600,000
C.
$1,666,667
D.
$2,500,000
51.
If management is manipulating earnings to achieve performance targets, what outcome may
result?
A.
Net income may exceed cash from operations.
B.
Cash from investing activities will exceed cash from financing activities.
C.
Cash will experience a net decrease.
D.
Total assets will increase.
52.
Where can you find insight of why sales has increased by 32% from a prior period?
A.
Common size financial statements
B.
Management’s discussion and analysis
C.
The balance sheet
D.
Horizontal analysis
53.
Which of the following is a stringent measure of a company’s ability to repay obligations in a
short period of time?
A.
Return on total assets
B.
Current ratio
C.
Acid-test ratio
D.
Debt turnover
Chapter 14 Analyzing Financial Statements: A Managerial Perspective
14-7
54.
Which of the following ratios measures how many multiples of the firm’s earnings that investors
are willing to pay for the company’s stock?
A.
Return on total assets
B.
Earnings per share
C.
Price-earnings ratio
D.
Time interest earned
55.
Which of the following most likely indicates that a company is making good use of financial
leverage?
A.
The price-earnings ratio exceeds that of competitors.
B.
Earnings per share is higher than the dividends paid per share.
C.
Net income is higher than cash from operations.
D.
Return on common stockholders’ equity is higher than the return on total assets.
56.
What effect does financing with debt have on a company?
A.
It will increase financial risk.
B.
It will decrease the potential return for shareholders.
C.
It will create a requirement to pay dividends.
D.
It will decrease turnover.
57.
Which of the following is not a profitability ratio?
A.
Inventory turnover
B.
Gross margin percentage
C.
Earnings per share
D.
Return on total assets
58.
Which ratio measures the rate earned on a company’s total economic resources?
A.
Price-earnings ratio
B.
Earnings per share
C.
Return on total assets
D.
Return on common stockholders’ equity
59.
Which ratio is a measure of the profit available to common shareholders on each share of
common stock outstanding?
A.
Price-earnings ratio
B.
Earnings per share
C.
Return on total assets
D.
Return on common stockholders’ equity
60.
Which statement is true concerning the gross margin percentage?
A.
It indicates how much a company earns per dollar of sales taking into account the cost of
items it sells.
B.
It indicates how much earnings are generated on each share of common stock.
C.
It indicates the amount of sales generated for each dollar of assets.
D.
It measures the amount of net income generated for each dollar of sales.
61.
Which of the following ratios is a measure of the company’s profitability to its market price?
A.
Price-earnings ratio
B.
Earnings per share
C.
Return on total assets
D.
Return on common stockholders’ equity
14-8
Test Bank to accompany Jiambalvo Managerial Accounting, 5th Edition
62.
Which of the following is not used to measure the efficiency with which a firm uses its assets?
A.
Inventory turnover ratio
B.
Current ratio
C.
Accounts receivable turnover ratio
D.
Asset turnover
63.
Which of the following is a common effect when return on common stockholders’ equity is
greater than return on total assets?
A.
Financial leverage is being used effectively.
B.
The company has no debt.
C.
The company’s profit is declining.
D.
Earnings per share will be extremely large.
64.
Cost of goods sold in 2014 for Reno Parts Company totaled $4,530,000. If the gross margin
percentage is 56%, how much are sales ?
A.
$10,295,454
B.
$7,066,800
C.
$8,089,286
D.
None of these answer choices are correct.
65.
The gross margin amount in 2014 for the Billings Corporation totaled $800,000. If cost of goods
sold is 80% of sales, how much is sales?
A.
$960,000
B.
$4,000,000
C.
$3,200,000
D.
$1,440,000
66.
Bonanza, Incorporated’s net income in 2014 was $378,000. The company had 75,000 shares of
common stock outstanding and 35,000 shares of preferred stock outstanding. No shares were
issued or repurchased during the year. The company paid dividends of $1.50 per share on the
common stock and $1.80 per share on the preferred stock. How much is earnings per share for
2014?
A.
$3.44
B.
$4.20
C.
$4.34
D.
$5.04
67.
Best Corporation’s net income in 2014 was $1,295,000. The company had 500,000 shares of
common stock outstanding and 90,000 shares of preferred stock outstanding. No shares were
issued or repurchased during the year. The company paid dividends of $0.70 per share on the
common stock and $0.80 per share on the preferred stock. How much profit did Best generate for
each share of outanding common stock in 2014?
A.
$1.15
B.
$2.45
C.
$2.59
D.
$2.19
Chapter 14 Analyzing Financial Statements: A Managerial Perspective
68.
14-9
Bread Enterprises had a current ratio of 3.5 on December 31 of the current year. On that date, the
company’s assets were as follows:
Cash
Accounts receivable, net
Inventory
Prepaid expenses
Equipment, net
Total assets
$ 200,000
600,000
960,000
25,000
2,200,000
$3,985,000
What impact will issuing common stock for cash have on the company’s earnings per share?
A.
It will increase earnings per share.
B.
It will decrease earnings per share.
C.
There will be no change.
D.
The number of common shares outstanding is needed to determine the answer.
69.
Bread Enterprises had a current ratio of 2.5 on December 31 of the current year. On that date, the
company’s assets were as follows:
Cash
Accounts receivable, net
Inventory
Prepaid expenses
Equipment, net
Total assets
$ 100,000
600,000
960,000
25,000
2,200,000
$3,985,000
What impact will an increase in the market price of the company’s common stock from $24.50 to
$37.20 have on a company’s price-earnings ratio?
A.
It will increase the price-earnings ratio.
B.
It will decrease the price-earnings ratio.
C.
There will be no change.
D.
There is not enough information to determine the answer.
70.
Lane Class Company had 50,000 shares of common stock outstanding and 10,000 shares of
preferred stock outstanding. No shares were issued or repurchased during the year. The company
paid a dividend of $0.80 per share of common stock and $0.60 per share of preferred stock. If the
company reports earnings per common share of $0.85, how much is net income?
A.
$42,500
B.
$56,500
C.
$48,500
D.
$57,000
71.
Blue Corporation reported earnings per share of common stock at $12 in 2014 and paid dividends
of $3 per share. The current market price per share is $102 and the book value per share is $54.
Blue Corporation has no preferred stock. How much is the company’s price-earnings ratio?
A.
$11.80
B.
$1.90
C.
$8.50
D.
$11.30
14-10
Test Bank to accompany Jiambalvo Managerial Accounting, 5th Edition
72.
McDonald Company’s net income in 2014 was $200,000. The company paid preferred dividends
of $32,000 and common stock dividends of $10,000. It average common stockholders’ equity was
$850,000 during 2014. How much is the company’s return on common stockholders’ equity for
2014?
A.
19.8%
B.
23.5%
C.
18.6%
D.
4.3%
73.
The following is from Nantucket Limited’s records for 2014:
Account Balances
Common stock
Additional paid-in-capital
Retained earnings
January 1
$210,000
95,000
105,000
December 31
$250,000
110,000
195,000
During 2014, the company paid dividends of $15,000 on its common stock. The company’s net
income for the year was $105,000. How much is the company’s return on common stockholders’
equity for the year ending December 31, 2014?
A.
18.9%
B.
16.2%
C.
22.0%
D.
25.6%
74.
Relish Holdings had 250,000 shares of common stock outstanding and 40,000 shares of preferred
stock outstanding. No shares were issued or repurchased during the year. The company paid a
dividend of $1.50 per share of common stock and $2 per share of preferred stock. If the company
reported earnings per common share of $1.60, how much would net income have been?
A.
$480,000
B.
$400,000
C.
$156,250
D.
$320,000
75.
Denton Limited Company reported earnings per share of common stock $2 in 2014 and paid
dividends of $1.50 per share. Denton has no preferred stock issued. The current market price per
share is $15 and the book value per share is $14. How much is Denton’s price-earnings ratio?
A.
$6.75
B.
$7.50
C.
$7.00
D.
$30.00
76.
Asset turnover is
A.
net income divided by sales.
B.
net sales divided by total assets.
C.
net sales divided by current assets.
D.
earnings per share divided by the market price per share of stock.
77.
Asset turnover is a measure of
A.
how quickly a company is replacing its old plant assets with new plant assets.
B.
how quickly a company is turning its sales into cash.
C.
the overall efficiency with which the company uses assets to generate revenues.
D.
how rapidly the stock market believes the company will grow.
Chapter 14 Analyzing Financial Statements: A Managerial Perspective
14-11
78.
Inventory turnover
A.
is a measure of the profitability of selling inventory.
B.
is used to calculate how quickly customers pay for inventory they purchased.
C.
is an indicator of how quickly suppliers are being paid by the company.
D.
measures how efficiently a company sells it inventory.
79.
The higher the amount of a company’s accounts receivable turnover,
A.
the shorter time period it takes to collect a receivable.
B.
the more assets a company has tied up in receivables.
C.
the longer it takes a company to collect its receivables.
D.
the more likely a company will experience cash flow problems.
80.
Which statement is true concerning the current ratio?
A.
It is usually a larger amount than the acid-test ratio.
B.
It is a more stringent test of a company’s ability to pay its short-term obligations.
C.
It measures a company’s ability to manage its assets efficiently.
D.
It measures a company’s ability to make interest payments on debt.
81.
Wangley Company has an inventory turnover of 8. Which statement is true?
A.
Wangley has about 2 months of sales in its inventory.
B.
Wangley takes about 46 days from the time an item is sold until Wangley collects the
cash.
C.
Wangley takes about one month from the time an item is purchased until the cash is
collected from the sale of the inventory.
D.
Wangley sells it inventory 8 times faster than other companies.
82.
Redzone Corporation reported $400,000 in sales on account plus another $60,000 in cash sales
last year. Cost of goods sold for the period totaled $220,000. The beginning balance in accounts
receivable was $32,000 and the ending balance was $50,000. How much is the company’s
accounts receivable turnover?
A.
9.2 times
B.
4.8 times
C.
8.0 times
D.
12.5 times
83.
Fenwick Holdings reported cash sales in 2014 of $220,000. Accounts receivable at the beginning
of the year totaled $420,000, with a balance of $490,000 at the end of the year. If the company’s
accounts receivable turnover is 3.5 for the year, how much are its total sales for the year?
A.
$2,250,000
B.
$1,715,000
C.
$1,495,000
D.
$1,935,000
84.
Real Crisp Company reported cost of goods sold of $800,000 last year. The company’s beginning
inventory balance was $58,000 and the ending inventory balance was $54,000. How many days
will it take the company to sell its inventory as of year end?
A.
13.8 days
B.
14.8 days
C.
24.6 days
D.
26.5 days
14-12
Test Bank to accompany Jiambalvo Managerial Accounting, 5th Edition
85.
Benzo Limited reported an inventory turnover of 14.5 times last year. Beginning inventory was
$290,000 and ending inventory was $260,000. How much was cost of goods sold?
A.
$3,770,000
B.
$3,987,500
C.
$4,205,000
D.
$7,975,000
86.
Zin Company repoted cost of goods sold of $1,500,000 last year. The company’s beginning
inventory balance was $110,000 and the ending inventory balance was $86,000. How many days
will it take the company to sell off all of its inventory?
A.
13.6 days
B.
17.4 days
C.
20.9 days
D.
26.8 days
87.
Which of the following is the most stringent test of a company’s ability to meet its current
obligations?
A.
Current ratio
B.
Quick ratio
C.
Debt-equity ratio
D.
Times interest earned
88.
Which of the following is included in the calculation of the current ratio, but not the quick ratio?
A.
Inventory
B.
Cash
C.
Accounts receivable
D.
Marketable securities
89.
Wilker Industries has a current ratio of 1.8. If Wilker collects a payment from a customer on
account, what is expected to happen to the company’s current ratio?
A.
It will increase.
B.
It will decrease.
C.
It will stay the same.
D.
The effect is based on the amount of debt a company holds at the end of the period.
90.
Organic Ways is a large food and drug retailer with more than 1,700 stores in the U.S. and
Canada. The following financial information relates to fiscal years, 2013 and 2014.
(In Millions)
Sales
Cost of goods sold
Accounts receivable
Merchandise inventory
2014
$34,286
32,000
577
2,905
2013
$38,185
34,000
461
2,510
How much is the company’s inventory turnover for 2014?
A.
9.08 times
B.
11.02 times
C.
11.80 times
D.
33.12 times
Chapter 14 Analyzing Financial Statements: A Managerial Perspective
91.
14-13
Waylon Appliances is a large applicance retailer with more than 800 stores in the U.S. The
following financial information relates to fiscal 2013 and 2014.
(In Millions)
Sales
Cost of goods sold
Accounts receivable
Merchandise inventory
2014
$42,286
33,000
820
2,900
2013
$40,185
31,000
960
2,700
How much is the company’s days’ sales in inventory for 2014 and 2013, respectively?
A.
32.08, 31.79 days
B.
41.52, 41.91 days
C.
11.38, 11.48 days
D.
2.13; 3.15 days
92.
Brick Works, Inc. had a current ratio of 1.5 to 1 on December 31 of the current year. On that date,
the company’s assets were as follows:
Cash
Accounts receivable, net
Inventory
Prepaid expenses
Equipment, net
Total assets
$ 100,000
800,000
960,000
25,000
2,600,000
$4,485,000
What impact will collecting $56,000 due from customers have on Brick Work’s inventory
turnover?
A.
It will increase.
B.
It will decrease.
C.
It will have no effect.
D.
The amount of current liabilities is needed to determine the answer.
93.
A company has a high debt-to-equity ratio. What other amount will most likely be high for the
company?
A.
The company’s level of risk
B.
The company’s assets
C.
Earnings per share
D.
Net income
94.
What does times interest earned measure?
A.
The ability of a company to make interest payments on its debt
B.
The ability of a company to pay its interest-bearing debt obligations
C.
The increase in interest expense as a result of new debt obligations acquired during the
period
D.
The average interest rate incurred on the company’s debt
95.
What does a quick ratio of less than one typically indicate?
A.
The company does not have enough quick assets to settle its current liabilities.
B.
The company is unprofitable.
C.
The company has a very high debt-to-equity ratio.
D.
All of the answer choices are correct.
14-14
Test Bank to accompany Jiambalvo Managerial Accounting, 5th Edition
96.
RT Enterprises has a current ratio of less than one, and a very high debt-to-equity ratio. Which of
the following will management of other companies most likely be reluctant to do?
I.
Sign an agreement with RT Enterprises to become a major supplier
II.
Sell RT Enterprises goods on credit
III.
Expand capacity to better serve the needs of RT Enterprises
A.
I and II
B.
II and III
C.
I and III
D.
I, II, and III
97.
Which of the following is not a communication by a company’s management that may help
alleviate investors and creditors concerns of the company’s financial statements?
A.
News articles
B.
Notes to their financial statements
C.
Assessment of vendors and customers
D.
Press releases
98.
Cramer Cooling Company reported the following results for the year just ended:
Cash
Accounts receivable
Prepaid insurance
Inventory
$50,000
45,000
10,000
51,300
Cramer Cooling’s acid-test ratio is 1.25. How much are the company’s current liabilities?
A.
$76,000
B.
$84,000
C.
$125,040
D.
$117,040
99.
Planter Zone’s working capital is $32,500 and its current assets are $85,100. How much is the
company’s current ratio?
A.
0.72
B.
1.62
C.
2.62
D.
1.38
100.
Seekers Limited reported the following results for the year just ended:
Cash
Accounts receivable
Inventory
$ 30,000
90,000
150,000
The company’s quick ratio was 0.90 for the year. How much are the company’s current liabilities?
A.
$120,000
B.
$133,333
C.
$266,667
D.
$108,000
Chapter 14 Analyzing Financial Statements: A Managerial Perspective
14-15
101.
Kerwin Holdings has total assets of $450,000 and shareholders’ equity of $120,000, of which
$45,000 of the equity is common stock. How much is the company’s debt-to-equity ratio?
A.
3.75
B.
2.75
C.
6.00
D.
4.40
102.
Comparative financial statements for Bent Stew Enterprises are shown below:
December 31
2014
2013
Assets
Current assets:
Cash
Accounts receivable
Inventory
Prepaid expenses
Total current assets
Property, plant, and equipment, net
Intangible assets, net
Total assets
Liabilities and Stockholders’ Equity
Current liabilities:
Accounts payable
Other current liabilities
Total current liabilities
Long-term debt
Total liabilities
Stockholders’ equity:
Common stock
Additional paid-in capital
Retained earnings
Total stockholders’ equity
Total liabilities and stockholders’ equity
Sales
Cost of goods sold
Gross margin
Operating expenses
Operating income
Interest expense
Earnings before income taxes
Income taxes
Net earnings
$ 3,000
8,500
12,000
1,400
24,900
103,600
64,000
$192,500
$
800
6,000
8,200
900
15,900
123,300
47,000
$186,200
$ 11,000
11,800
22,800
120,000
142,800
$ 12,000
3,200
15,200
128,000
143,200
15,000
20,000
14,700
49,700
$192,500
15,000
20,000
8,000
43,000
$186,200
Year Ended December 31
2014
2013
$250,000
$ 230,000
164,000
142,300
86,000
87,700
64,000
54,000
22,000
33,700
7,500
5,900
14,500
27,800
7,800
7,140
$ 6,700
$ 20,660
Using horizontal analysis, how much is the percentage change in cash for Bent Stew Enterprises
from 2013 to 2014?
A.
375.00% increase
B.
73.33% increase
C.
26.67% increase
D.
275.00% increase
14-16
Test Bank to accompany Jiambalvo Managerial Accounting, 5th Edition
103.
Comparative financial statements for Bent Stew Enterprises are shown below:
December 31
2014
2013
Assets
Current assets:
Cash
Accounts receivable
Inventory
Prepaid expenses
Total current assets
Property, plant, and equipment, net
Intangible assets, net
Total assets
Liabilities and Stockholders’ Equity
Current liabilities:
Accounts payable
Other current liabilities
Total current liabilities
Long-term debt
Total liabilities
Stockholders’ equity:
Common stock
Additional paid-in capital
Retained earnings
Total stockholders’ equity
Total liabilities and stockholders’ equity
Sales
Cost of goods sold
Gross margin
Operating expenses
Operating income
Interest expense
Earnings before income taxes
Income taxes
Net earnings
$ 3,000
8,500
12,000
1,400
24,900
103,600
64,000
$192,500
$
800
6,000
8,200
900
15,900
123,300
47,000
$186,200
$ 11,000
11,800
22,800
120,000
142,800
$ 12,000
3,200
15,200
128,000
143,200
15,000
20,000
14,700
49,700
$192,500
15,000
20,000
8,000
43,000
$186,200
Year Ended December 31
2014
2013
$250,000
$ 230,000
164,000
142,300
86,000
87,700
64,000
54,000
22,000
33,700
7,500
5,900
14,500
27,800
7,800
7,140
$ 6,700
$ 20,660
How much is the company’s gross margin percentage for 2014?
A.
(1.98%)
B.
34.40%
C.
98.16%
D.
7.80%
Chapter 14 Analyzing Financial Statements: A Managerial Perspective
104.
14-17
Comparative financial statements for Bent Stew Enterprises are shown below:
December 31
2014
2013
Assets
Current assets:
Cash
Accounts receivable
Inventory
Prepaid expenses
Total current assets
Property, plant, and equipment, net
Intangible assets, net
Total assets
Liabilities and Stockholders’ Equity
Current liabilities:
Accounts payable
Other current liabilities
Total current liabilities
Long-term debt
Total liabilities
Stockholders’ equity:
Common stock
Additional paid-in capital
Retained earnings
Total stockholders’ equity
Total liabilities and stockholders’ equity
Sales
Cost of goods sold
Gross margin
Operating expenses
Operating income
Interest expense
Earnings before income taxes
Income taxes
Net earnings
$ 3,000
8,500
12,000
1,400
24,900
103,600
64,000
$192,500
$
800
6,000
8,200
900
15,900
123,300
47,000
$186,200
$ 11,000
11,800
22,800
120,000
142,800
$ 12,000
3,200
15,200
128,000
143,200
15,000
20,000
14,700
49,700
$192,500
15,000
20,000
8,000
43,000
$186,200
Year Ended December 31
2014
2013
$250,000
$ 230,000
164,000
142,300
86,000
87,700
64,000
54,000
22,000
33,700
7,500
5,900
14,500
27,800
7,800
7,140
$ 6,700
$ 20,660
Bent Stew Enterprises had 10,000 shares of common stock outstanding during both 2013 and
2014. How much was earnings per share in 2014?
A.
$0.15
B.
$0.67
C.
$1.49
D.
$19.25
14-18
Test Bank to accompany Jiambalvo Managerial Accounting, 5th Edition
105.
Comparative financial statements for Bent Stew Enterprises are shown below:
December 31
2014
Assets
Current assets:
Cash
Accounts receivable
Inventory
Prepaid expenses
Total current assets
Property, plant, and equipment, net
Intangible assets, net
Total assets
Liabilities and Stockholders’ Equity
Current liabilities:
Accounts payable
Other current liabilities
Total current liabilities
Long-term debt
Total liabilities
Stockholders’ equity:
Common stock
Additional paid-in capital
Retained earnings
Total stockholders’ equity
Total liabilities and stockholders’ equity
Sales
Cost of goods sold
Gross margin
Operating expenses
Operating income
Interest expense
Earnings before income taxes
Income taxes
Net earnings
2013
$ 3,000
8,500
12,000
1,400
24,900
103,600
64,000
$192,500
$
800
6,000
8,200
900
15,900
123,300
47,000
$186,200
$ 11,000
11,800
22,800
120,000
142,800
$ 12,000
3,200
15,200
128,000
143,200
15,000
20,000
14,700
49,700
$192,500
15,000
20,000
8,000
43,000
$186,200
Year Ended December 31
2014
2013
$250,000
$ 230,000
164,000
142,300
86,000
87,700
64,000
54,000
22,000
33,700
7,500
5,900
14,500
27,800
7,800
7,140
$ 6,700
$ 20,660
Using vertical analysis, how would you best describe the change in the company’s operating
expenses from 2013 to 2014?
A.
Operating expenses increased from 1.63% of net earnings to 9.55% of net earnings from
2013 to 2014.
B.
Operating expenses increased by $10,000 from 2013 to 2014.
C.
Operating expenses increased from 23.5% to 25.6% of sales from 2013 to 2014.
D.
Operating expenses increased by 18.5% from 2013 to 2014.
Chapter 14 Analyzing Financial Statements: A Managerial Perspective
106.
14-19
Comparative financial statements for Bent Stew Enterprises are shown below:
December 31
2014
2013
Assets
Current assets:
Cash
Accounts receivable
Inventory
Prepaid expenses
Total current assets
Property, plant, and equipment, net
Intangible assets, net
Total assets
Liabilities and Stockholders’ Equity
Current liabilities:
Accounts payable
Other current liabilities
Total current liabilities
Long-term debt
Total liabilities
Stockholders’ equity:
Common stock
Additional paid-in capital
Retained earnings
Total stockholders’ equity
Total liabilities and stockholders’ equity
Sales
Cost of goods sold
Gross margin
Operating expenses
Operating income
Interest expense
Earnings before income taxes
Income taxes
Net earnings
$ 3,000
8,500
12,000
1,400
24,900
103,600
64,000
$192,500
$
800
6,000
8,200
900
15,900
123,300
47,000
$186,200
$ 11,000
11,800
22,800
120,000
142,800
$ 12,000
3,200
15,200
128,000
143,200
15,000
20,000
14,700
49,700
$192,500
15,000
20,000
8,000
43,000
$186,200
Year Ended December 31
2014
2013
$250,000
$ 230,000
164,000
142,300
86,000
87,700
64,000
54,000
22,000
33,700
7,500
5,900
14,500
27,800
7,800
7,140
$ 6,700
$ 20,660
Using horizontal analysis, how would you best describe the change in the company’s operating
expenses from 2013 to 2014?
A.
Operating expenses increased from 1.63% of net earnings to 9.55% of net earnings from
2013 to 2014.
B.
Operating expenses increased by $10,000 from 2013 to 2014.
C.
Operating expenses increased from 23.5% to 25.6% of sales from 2013 to 2014.
D.
Operating expenses increased by 18.5% from 2013 to 2014.
14-20
Test Bank to accompany Jiambalvo Managerial Accounting, 5th Edition
107.
Comparative financial statements for Bent Stew Enterprises are shown below:
December 31
2014
2013
Assets
Current assets:
Cash
Accounts receivable
Inventory
Prepaid expenses
Total current assets
Property, plant, and equipment, net
Intangible assets, net
Total assets
Liabilities and Stockholders’ Equity
Current liabilities:
Accounts payable
Other current liabilities
Total current liabilities
Long-term debt
Total liabilities
Stockholders’ equity:
Common stock
Additional paid-in capital
Retained earnings
Total stockholders’ equity
Total liabilities and stockholders’ equity
Sales
Cost of goods sold
Gross margin
Operating expenses
Operating income
Interest expense
Earnings before income taxes
Income taxes
Net earnings
$ 3,000
8,500
12,000
1,400
24,900
103,600
64,000
$192,500
$
800
6,000
8,200
900
15,900
123,300
47,000
$186,200
$ 11,000
11,800
22,800
120,000
142,800
$ 12,000
3,200
15,200
128,000
143,200
15,000
20,000
14,700
49,700
$192,500
15,000
20,000
8,000
43,000
$186,200
Year Ended December 31
2014
2013
$250,000
$ 230,000
164,000
142,300
86,000
87,700
64,000
54,000
22,000
33,700
7,500
5,900
14,500
27,800
7,800
7,140
$ 6,700
$ 20,660
What does vertical analysis for 2014 versus 2013 reveal for Bent Stew Enterprises?
A.
There was no change in the proportion of common stock to total assets from 2013 to
2014.
B.
Inventory levels have decreased from 2013 to 2014 in proportion to total assets.
C.
Gross margin declined to 34.4% in 2014, down from 38.19% in 2013.
D.
The company has a higher proportion of long-term debt in 2014 compared to 2013.
Chapter 14 Analyzing Financial Statements: A Managerial Perspective
108.
14-21
Comparative financial statements for Bent Stew Enterprises are shown below:
December 31
2014
Assets
Current assets:
Cash
Accounts receivable
Inventory
Prepaid expenses
Total current assets
Property, plant, and equipment, net
Intangible assets, net
Total assets
Liabilities and Stockholders’ Equity
Current liabilities:
Accounts payable
Other current liabilities
Total current liabilities
Long-term debt
Total liabilities
Stockholders’ equity:
Common stock
Additional paid-in capital
Retained earnings
Total stockholders’ equity
Total liabilities and stockholders’ equity
Sales
Cost of goods sold
Gross margin
Operating expenses
Operating income
Interest expense
Earnings before income taxes
Income taxes
Net earnings
2013
$ 3,000
8,500
12,000
1,400
24,900
103,600
64,000
$192,500
$
800
6,000
8,200
900
15,900
123,300
47,000
$186,200
$ 11,000
11,800
22,800
120,000
142,800
$ 12,000
3,200
15,200
128,000
143,200
15,000
20,000
14,700
49,700
$192,500
15,000
20,000
8,000
43,000
$186,200
Year Ended December 31
2014
2013
$250,000
$ 230,000
164,000
142,300
86,000
87,700
64,000
54,000
22,000
33,700
7,500
5,900
14,500
27,800
7,800
7,140
$ 6,700
$ 20,660
The company’s stock is selling for a market price of $31.00 per share at the end of 2014, up from
$28.00 per share at the end of 2013. There are 5,000 shares of common stock outstanding at the
end of 2014. How much is the company’s price-earnings ratio at the end of 2014?
A.
$23.13
B.
$1.34
C.
$4.32
D.
$41.55
14-22
Test Bank to accompany Jiambalvo Managerial Accounting, 5th Edition
109.
Comparative financial statements for Bent Stew Enterprises are shown below:
December 31
2014
2013
Assets
Current assets:
Cash
Accounts receivable
Inventory
Prepaid expenses
Total current assets
Property, plant, and equipment, net
Intangible assets, net
Total assets
Liabilities and Stockholders’ Equity
Current liabilities:
Accounts payable
Other current liabilities
Total current liabilities
Long-term debt
Total liabilities
Stockholders’ equity:
Common stock
Additional paid-in capital
Retained earnings
Total stockholders’ equity
Total liabilities and stockholders’ equity
Sales
Cost of goods sold
Gross margin
Operating expenses
Operating income
Interest expense
Earnings before income taxes
Income taxes
Net earnings
How much is Bent Stew’s asset turnover in 2014?
A.
1.034
B.
0.027
C.
0.770
D.
1.299
$ 3,000
8,500
12,000
1,400
24,900
103,600
64,000
$192,500
$
800
6,000
8,200
900
15,900
123,300
47,000
$186,200
$ 11,000
11,800
22,800
120,000
142,800
$ 12,000
3,200
15,200
128,000
143,200
15,000
20,000
14,700
49,700
$192,500
15,000
20,000
8,000
43,000
$186,200
Year Ended December 31
2014
2013
$250,000
$ 230,000
164,000
142,300
86,000
87,700
64,000
54,000
22,000
33,700
7,500
5,900
14,500
27,800
7,800
7,140
$ 6,700
$ 20,660
Chapter 14 Analyzing Financial Statements: A Managerial Perspective
110.
Comparative financial statements for Bent Stew Enterprises are shown below:
December 31
2014
Assets
Current assets:
Cash
Accounts receivable
Inventory
Prepaid expenses
Total current assets
Property, plant, and equipment, net
Intangible assets, net
Total assets
Liabilities and Stockholders’ Equity
Current liabilities:
Accounts payable
Other current liabilities
Total current liabilities
Long-term debt
Total liabilities
Stockholders’ equity:
Common stock
Additional paid-in capital
Retained earnings
Total stockholders’ equity
Total liabilities and stockholders’ equity
Sales
Cost of goods sold
Gross margin
Operating expenses
Operating income
Interest expense
Earnings before income taxes
Income taxes
Net earnings
2013
$ 3,000
8,500
12,000
1,400
24,900
103,600
64,000
$192,500
$
800
6,000
8,200
900
15,900
123,300
47,000
$186,200
$ 11,000
11,800
22,800
120,000
142,800
$ 12,000
3,200
15,200
128,000
143,200
15,000
20,000
14,700
49,700
$192,500
15,000
20,000
8,000
43,000
$186,200
Year Ended December 31
2014
2013
$250,000
$ 230,000
164,000
142,300
86,000
87,700
64,000
54,000
22,000
33,700
7,500
5,900
14,500
27,800
7,800
7,140
$ 6,700
$ 20,660
How much is return on common stockholders’ equity for Bent Stew for 2014?
A.
15.26%
B.
44.67%
C.
19.14%
D.
13.48%
14-23
14-24
Test Bank to accompany Jiambalvo Managerial Accounting, 5th Edition
111.
Comparative financial statements for Bent Stew Enterprises are shown below:
December 31
2014
Assets
Current assets:
Cash
Accounts receivable
Inventory
Prepaid expenses
Total current assets
Property, plant, and equipment, net
Intangible assets, net
Total assets
Liabilities and Stockholders’ Equity
Current liabilities:
Accounts payable
Other current liabilities
Total current liabilities
Long-term debt
Total liabilities
Stockholders’ equity:
Common stock
Additional paid-in capital
Retained earnings
Total stockholders’ equity
Total liabilities and stockholders’ equity
Sales
Cost of goods sold
Gross margin
Operating expenses
Operating income
Interest expense
Earnings before income taxes
Income taxes
Net earnings
2013
$ 3,000
8,500
12,000
1,400
24,900
103,600
64,000
$192,500
$
800
6,000
8,200
900
15,900
123,300
47,000
$186,200
$ 11,000
11,800
22,800
120,000
142,800
$ 12,000
3,200
15,200
128,000
143,200
15,000
20,000
14,700
49,700
$192,500
15,000
20,000
8,000
43,000
$186,200
Year Ended December 31
2014
2013
$250,000
$ 230,000
164,000
142,300
86,000
87,700
64,000
54,000
22,000
33,700
7,500
5,900
14,500
27,800
7,800
7,140
$ 6,700
$ 20,660
The income tax rate is 54%. How would you best describe the company’s use of financial
leverage in 2014?
A.
The company is highly leveraged and is using leverage well to generate a high return for
stockholders.
B.
The company is poorly leveraged.
C.
The company is highly leveraged, but the leverage has a negative impact on stockholders.
D.
The company has no financial leverage.
Chapter 14 Analyzing Financial Statements: A Managerial Perspective
112.
Comparative financial statements for Bent Stew Enterprises are shown below:
December 31
2014
Assets
Current assets:
Cash
Accounts receivable
Inventory
Prepaid expenses
Total current assets
Property, plant, and equipment, net
Intangible assets, net
Total assets
Liabilities and Stockholders’ Equity
Current liabilities:
Accounts payable
Other current liabilities
Total current liabilities
Long-term debt
Total liabilities
Stockholders’ equity:
Common stock
Additional paid-in capital
Retained earnings
Total stockholders’ equity
Total liabilities and stockholders’ equity
Sales
Cost of goods sold
Gross margin
Operating expenses
Operating income
Interest expense
Earnings before income taxes
Income taxes
Net earnings
How much is Bent Stew’s inventory turnover for 2014?
A.
7.32 times
B.
26.70 times
C.
49.86 times
D.
13.67 times
2013
$ 3,000
8,500
12,000
1,400
24,900
103,600
64,000
$192,500
$
800
6,000
8,200
900
15,900
123,300
47,000
$186,200
$ 11,000
11,800
22,800
120,000
142,800
$ 12,000
3,200
15,200
128,000
143,200
15,000
20,000
14,700
49,700
$192,500
15,000
20,000
8,000
43,000
$186,200
Year Ended December 31
2014
2013
$250,000
$ 230,000
164,000
142,300
86,000
87,700
64,000
54,000
22,000
33,700
7,500
5,900
14,500
27,800
7,800
7,140
$ 6,700
$ 20,660
14-25