Introduction to quantitative methods for financial markets
Bạn đang xem bản rút gọn của tài liệu. Xem và tải ngay bản đầy đủ của tài liệu tại đây (2.49 MB, 190 trang )
Compact Textbooks in Mathematics
Hansjoerg Albrecher
Andreas Binder
Volkmar Lautscham
Philipp Mayer
Introduction
to Quantitative
Methods for
Financial Markets
Compact Textbooks in Mathematics
For further volumes:
/>
Compact Textbooks in Mathematics
This textbook series presents concise introductions to current topics in mathematics and mainly addresses advanced undergraduates and master students.
The concept is to offer small books covering subject matter equivalent to 2- or
3-hour lectures or seminars which are also suitable for self-study. The books provide students and teachers with new perspectives and novel approaches. They
feature examples and exercises to illustrate key concepts and applications of the
theoretical contents. The series also includes textbooks specifically speaking to
the needs of students from other disciplines such as physics, computer science,
engineering, life sciences, finance.
Hansjoerg Albrecher • Andreas Binder
Volkmar Lautscham • Philipp Mayer
Introduction
to Quantitative Methods
for Financial Markets
Hansjoerg Albrecher
Volkmar Lautscham
Department of Actuarial Science
University of Lausanne
Lausanne
Switzerland
Andreas Binder
Kompetenzzentrum Industriemathematik
Mathconsult GmbH
Linz
Austria
Philipp Mayer
Department of Mathematics
TU Graz
Graz
Austria
Revised and updated translation from the German language edition: Einf¨uhrung in die Finanzmathematik by Hansj¨org Albrecher, Andreas Binder, and Philipp Mayer, c Birkh¨auser Verlag,
Switzerland 2009. All rights reserved
ISBN 978-3-0348-0518-6
ISBN 978-3-0348-0519-3 (eBook)
DOI 10.1007/978-3-0348-0519-3
Springer Basel Heidelberg New York Dordrecht London
Library of Congress Control Number: 2013940190
2010 Mathematical Subject Classification: 91-01 (91G10 91G20 91G80)
© Springer Basel 2013
This work is subject to copyright. All rights are reserved by the Publisher, whether the whole or part of
the material is concerned, specifically the rights of translation, reprinting, reuse of illustrations, recitation,
broadcasting, reproduction on microfilms or in any other physical way, and transmission or information
storage and retrieval, electronic adaptation, computer software, or by similar or dissimilar methodology
now known or hereafter developed. Exempted from this legal reservation are brief excerpts in connection
with reviews or scholarly analysis or material supplied specifically for the purpose of being entered
and executed on a computer system, for exclusive use by the purchaser of the work. Duplication of
this publication or parts thereof is permitted only under the provisions of the Copyright Law of the
Publisher’s location, in its current version, and permission for use must always be obtained from Springer.
Permissions for use may be obtained through RightsLink at the Copyright Clearance Center. Violations
are liable to prosecution under the respective Copyright Law.
The use of general descriptive names, registered names, trademarks, service marks, etc. in this publication
does not imply, even in the absence of a specific statement, that such names are exempt from the relevant
protective laws and regulations and therefore free for general use.
While the advice and information in this book are believed to be true and accurate at the date of
publication, neither the authors nor the editors nor the publisher can accept any legal responsibility for
any errors or omissions that may be made. The publisher makes no warranty, express or implied, with
respect to the material contained herein.
Cover design: deblik, Berlin
Printed on acid-free paper
Springer Basel is part of Springer Science+Business Media (www.springer.com)
Preface
This book is an introductory text to mathematical finance, with particular attention
to linking theoretical concepts with methods used in financial practice. It succeeds
a German language edition, Albrecher, Binder, Mayer (2009): Einf¨uhrung in die
Finanzmathematik. Readers of the German edition will find the structures and
presentations of the two books similar, yet parts of the contents of the original
version have been reworked and brought up-to-date. Today’s financial world is fastpaced, and it is especially during financial downturns, as the one initiated by the
2007/08 Credit Crisis, that practitioners critically review and revise traditionally
employed methods and models.
The aim of this text is to equip the readers with a comprehensive set of
mathematical tools to structure and solve modern financial problems, but also
to increase their awareness of practical issues, for instance around products that
trade in the financial markets. Hence, the scope of the discussion spans from the
mathematical modeling of financial problems to the algorithmic implementation of
solutions. Critical aspects and practical challenges are illustrated by a large number
of exercises and case studies.
The text is structured in such a way that it can readily be used for an introductory
course in mathematical finance at the undergraduate or early graduate level. While
some chapters contain a good amount of mathematical detail, we tried to ensure that
the text is accessible throughout, not only to students of mathematical disciplines,
but also to students of other quantitative fields, such as business studies, finance or
economics. In particular, we have organized the text so that it would also be suitable
for self-study, for example by practitioners looking to deepen their knowledge of
the algorithms and models that they see regularly applied in practice.
The contents of this book are grouped in 15 modules which are to a large degree
independent of each other. Therefore, a 15-week course could cover the book on a
one-module-per-week basis. Alternatively, the instructor might wish to elaborate
further on certain aspects, while excluding selected modules without majorly
impairing the accessibility of the remaining ones. Conversely, single modules can
be used separately as compact introductions to the respective topic in courses with
a scope different from general mathematical finance.
Due to its compact form, we hope that students will find this book a valuable
first toolbox when pursuing a career in the financial industry. However, it is obvious
that there exists a wide range of other methods and tools that cannot be covered
v
vi
Preface
in the present concise format and some readers might feel the need to study some
aspects in more detail. To facilitate this, each module closes with a list of references
for further reading of theoretical and practical focus. The reader is furthermore
encouraged to check his/her understanding of the covered material by solving
exercises as listed at the end of each module, and to implement algorithms to
gain experience in implementing solutions. Some of the exercises further develop
presented techniques and could also be included in the course by the instructor.
In terms of prior knowledge, the reader of this book will find some understanding
of basic probability theory and calculus helpful. However, we have tried to limit any
prerequisites as much as possible. To link the concepts to practical applications, we
aimed at making the reader comfortable with a certain scope of technical language
and market terms. Technical terms are printed in italics when used for the first
time, whilst terms introducing a new subsection are printed in bold. To improve
the text’s readability, additional information is provided in footnotes in which one
will also find biographic comments on some persons who have greatly contributed
to developing the field of mathematical finance.
Several algorithmic aspects are illustrated through examples implemented in
Mathematica and in the software package UnRisk PRICING ENGINE (in the
following: UnRisk). UnRisk (www.unrisk.com) is a commercial software package
that has been developed by MathConsult GmbH since 1999 to provide tools for the
pricing of structured and derivative products. The package is offered to students free
of charge for a limited period post purchase of this book. UnRisk runs on Windows
engines and requires Mathematica as a platform.
We hope that you will enjoy assembling your first toolbox in mathematical
finance by working through this book and look forward to receiving any comments
you might have at
Lausanne, Linz and Brussels,
April 2013
Hansj¨org Albrecher, Andreas Binder,
Volkmar Lautscham and Philipp Mayer
Contents
1
Interest, Coupons and Yields . . . . . . . . . . . . . . . . . . . . . . . . . .. . . . . . . . . . . . . . . . . . . .
1.1 Time Value of Money . . . . . . . . . . . . . . . . . . . . . . . . . . . .. . . . . . . . . . . . . . . . . . . .
1.2 Interest on Debt, Day-Count Conventions . . . . . .. . . . . . . . . . . . . . . . . . . .
1.3 Accrued Interest . . . . . . . . . . . . . . . . . . . . . . . . . . . . . . . . . .. . . . . . . . . . . . . . . . . . . .
1.4 Floating Rates, Libor and Euribor .. . . . . . . . . . . . . .. . . . . . . . . . . . . . . . . . . .
1.5 Bond Yields and the Term Structure of Interest Rates . . . . . . . . . . . . . .
1.6 Duration and Convexity .. . . . . . . . . . . . . . . . . . . . . . . . .. . . . . . . . . . . . . . . . . . . .
1.7 Key Takeaways, References and Exercises . . . . .. . . . . . . . . . . . . . . . . . . .
1
1
2
5
6
8
10
13
2
Financial Products .. . . . . . . . . . . . . . . . . . . . . . . . . . . . . . . . . . . . .. . . . . . . . . . . . . . . . . . . .
2.1 Bonds, Stocks and Commodities . . . . . . . . . . . . . . . .. . . . . . . . . . . . . . . . . . . .
2.2 Derivatives .. . . . . . . . . . . . . . . . . . . . . . . . . . . . . . . . . . . . . . .. . . . . . . . . . . . . . . . . . . .
2.3 Forwards and Futures . . . . . . . . . . . . . . . . . . . . . . . . . . . .. . . . . . . . . . . . . . . . . . . .
2.4 Swaps . . . . . . . . . . . . . . . . . . . . . . . . . . . . . . . . . . . . . . . . . . . . .. . . . . . . . . . . . . . . . . . . .
2.5 Options.. . . . . . . . . . . . . . . . . . . . . . . . . . . . . . . . . . . . . . . . . . .. . . . . . . . . . . . . . . . . . . .
2.6 Key Takeaways, References and Exercises . . . . .. . . . . . . . . . . . . . . . . . . .
15
15
19
20
22
23
25
3
The No-Arbitrage Principle . . . . . . . . . . . . . . . . . . . . . . . . . . .. . . . . . . . . . . . . . . . . . . .
3.1 Introduction .. . . . . . . . . . . . . . . . . . . . . . . . . . . . . . . . . . . . . .. . . . . . . . . . . . . . . . . . . .
3.2 Pricing Forward Contracts and Managing Counterparty Risk . . . . .
3.3 Bootstrapping .. . . . . . . . . . . . . . . . . . . . . . . . . . . . . . . . . . . .. . . . . . . . . . . . . . . . . . . .
3.4 Forward Rate Agreements (FRAs) . . . . . . . . . . . . . .. . . . . . . . . . . . . . . . . . . .
3.5 Key Takeaways, References and Exercises . . . . .. . . . . . . . . . . . . . . . . . . .
27
27
29
31
33
34
4
European and American Options .. . . . . . . . . . . . . . . . . . . .. . . . . . . . . . . . . . . . . . . .
4.1 Put-Call Parity, Bounds for Option Prices . . . . . .. . . . . . . . . . . . . . . . . . . .
4.2 Some Option Trading Strategies .. . . . . . . . . . . . . . . .. . . . . . . . . . . . . . . . . . . .
4.3 American Options . . . . . . . . . . . . . . . . . . . . . . . . . . . . . . . .. . . . . . . . . . . . . . . . . . . .
4.4 Key Takeaways, References and Exercises . . . . .. . . . . . . . . . . . . . . . . . . .
37
38
40
41
43
5
The Binomial Option Pricing Model . . . . . . . . . . . . . . . . .. . . . . . . . . . . . . . . . . . . .
5.1 A One-Period Option Pricing Model .. . . . . . . . . . .. . . . . . . . . . . . . . . . . . . .
5.2 The Principle of Risk-Neutral Valuation . . . . . . . .. . . . . . . . . . . . . . . . . . . .
5.3 The Cox-Ross-Rubinstein Model.. . . . . . . . . . . . . . .. . . . . . . . . . . . . . . . . . . .
5.4 Key Takeaways, References and Exercises . . . . .. . . . . . . . . . . . . . . . . . . .
47
47
49
50
53
vii
viii
Contents
6
The Black-Scholes Model . . . . . . . . . . . . . . . . . . . . . . . . . . . . . .. . . . . . . . . . . . . . . . . . . .
6.1 Brownian Motion and Itˆo’s Lemma . . . . . . . . . . . . .. . . . . . . . . . . . . . . . . . . .
6.2 The Black-Scholes Model . . . . . . . . . . . . . . . . . . . . . . .. . . . . . . . . . . . . . . . . . . .
6.3 Key Takeaways, References and Exercises . . . . .. . . . . . . . . . . . . . . . . . . .
55
56
59
61
7
The Black-Scholes Formula . . . . . . . . . . . . . . . . . . . . . . . . . . .. . . . . . . . . . . . . . . . . . . .
7.1 The Black-Scholes formula from a PDE . . . . . . . .. . . . . . . . . . . . . . . . . . . .
7.2 The Black-Scholes Formula as Limit in the CRR-Model . . . . . . . . . .
7.3 Discussion of the Formula, Hedging . . . . . . . . . . . .. . . . . . . . . . . . . . . . . . . .
7.4 Delta-Hedging and the ‘Greeks’ .. . . . . . . . . . . . . . . .. . . . . . . . . . . . . . . . . . . .
7.5 Does Hedging Work? . . . . . . . . . . . . . . . . . . . . . . . . . . . .. . . . . . . . . . . . . . . . . . . .
7.6 Key Takeaways, References and Exercises . . . . .. . . . . . . . . . . . . . . . . . . .
63
63
65
68
70
71
73
8
Stock-Price Models . . . . . . . . . . . . . . . . . . . . . . . . . . . . . . . . . . . . .. . . . . . . . . . . . . . . . . . . .
8.1 Shortcomings of the Black-Scholes Model: Skewness,
Kurtosis and Volatility Smiles . . . . . . . . . . . . . . . . . . .. . . . . . . . . . . . . . . . . . . .
8.2 The Dupire Model .. . . . . . . . . . . . . . . . . . . . . . . . . . . . . . .. . . . . . . . . . . . . . . . . . . .
8.3 The Heston Model.. . . . . . . . . . . . . . . . . . . . . . . . . . . . . . .. . . . . . . . . . . . . . . . . . . .
8.4 Price Jumps and the Merton Model . . . . . . . . . . . . .. . . . . . . . . . . . . . . . . . . .
8.5 Key Takeaways, References and Exercises . . . . .. . . . . . . . . . . . . . . . . . . .
77
9
77
79
80
85
88
Interest Rate Models . . . . . . . . . . . . . . . . . . . . . . . . . . . . . . . . . . .. . . . . . . . . . . . . . . . . . . . 91
9.1 Caps, Floors and Swaptions . . . . . . . . . . . . . . . . . . . . .. . . . . . . . . . . . . . . . . . . . 91
9.2 Short-Rate Models . . . . . . . . . . . . . . . . . . . . . . . . . . . . . . .. . . . . . . . . . . . . . . . . . . . 93
9.3 The Hull-White Model: a Short-Rate Model.. . .. . . . . . . . . . . . . . . . . . . . 94
9.4 Market Models . . . . . . . . . . . . . . . . . . . . . . . . . . . . . . . . . . .. . . . . . . . . . . . . . . . . . . . 98
9.5 Key Takeaways, References and Exercises . . . . .. . . . . . . . . . . . . . . . . . . . 100
10 Numerical Methods. . . . . . . . . . . . . . . . . . . . . . . . . . . . . . . . . . . . .. . . . . . . . . . . . . . . . . . . .
10.1 Binomial Trees . . . . . . . . . . . . . . . . . . . . . . . . . . . . . . . . . . .. . . . . . . . . . . . . . . . . . . .
10.2 Trinomial Trees .. . . . . . . . . . . . . . . . . . . . . . . . . . . . . . . . . .. . . . . . . . . . . . . . . . . . . .
10.3 Finite Differences and Finite Elements . . . . . . . . .. . . . . . . . . . . . . . . . . . . .
10.4 Pricing with the Characteristic Function . . . . . . . .. . . . . . . . . . . . . . . . . . . .
10.5 Numerical Algorithms in UnRisk . . . . . . . . . . . . . . .. . . . . . . . . . . . . . . . . . . .
10.6 Key Takeaways, References and Exercises . . . . .. . . . . . . . . . . . . . . . . . . .
103
103
106
107
111
113
113
11 Simulation Methods . . . . . . . . . . . . . . . . . . . . . . . . . . . . . . . . . . . .. . . . . . . . . . . . . . . . . . . .
11.1 The Monte Carlo Method . . . . . . . . . . . . . . . . . . . . . . . .. . . . . . . . . . . . . . . . . . . .
11.2 Quasi-Monte Carlo (QMC) Methods .. . . . . . . . . . .. . . . . . . . . . . . . . . . . . . .
11.3 Simulation of Stochastic Differential Equations .. . . . . . . . . . . . . . . . . . .
11.4 Key Takeaways, References and Exercises . . . . .. . . . . . . . . . . . . . . . . . . .
117
117
124
127
128
12 Calibrating Models – Inverse Problems .. . . . . . . . . . . . .. . . . . . . . . . . . . . . . . . . .
12.1 Fitting Yield Curves in the Hull-White Model. .. . . . . . . . . . . . . . . . . . . .
12.2 Calibrating the Black-Karasinski Model . . . . . . . .. . . . . . . . . . . . . . . . . . . .
12.3 Local Volatility and the Dupire Model . . . . . . . . . .. . . . . . . . . . . . . . . . . . . .
12.4 Calibrating the Heston Model or the LIBOR-Market Model . . . . . .
12.5 Key Takeaways, References and Exercises . . . . .. . . . . . . . . . . . . . . . . . . .
133
134
137
137
140
140
Contents
ix
13 Case Studies: Exotic Derivatives .. . . . . . . . . . . . . . . . . . . . .. . . . . . . . . . . . . . . . . . . .
13.1 Barrier Options and (Reverse) Convertibles . . . .. . . . . . . . . . . . . . . . . . . .
13.2 Bermudan Bonds – To Call or Not To Call? . . .. . . . . . . . . . . . . . . . . . . .
13.3 Bermudan Callable Snowball Floaters . . . . . . . . . .. . . . . . . . . . . . . . . . . . . .
13.4 More Examples of Exotic Interest Rate Derivatives .. . . . . . . . . . . . . . .
13.5 Model Risk in Interest Rate Models .. . . . . . . . . . . .. . . . . . . . . . . . . . . . . . . .
13.6 Equity Basket Instruments . . . . . . . . . . . . . . . . . . . . . . .. . . . . . . . . . . . . . . . . . . .
13.7 Key Takeaways, References and Exercises . . . . .. . . . . . . . . . . . . . . . . . . .
143
143
146
147
148
149
150
151
14 Portfolio Optimization . . . . . . . . . . . . . . . . . . . . . . . . . . . . . . . . .. . . . . . . . . . . . . . . . . . . .
14.1 Mean-Variance Optimization . . . . . . . . . . . . . . . . . . . .. . . . . . . . . . . . . . . . . . . .
14.2 Risk Measures and Utility Theory .. . . . . . . . . . . . . .. . . . . . . . . . . . . . . . . . . .
14.3 Portfolio Optimization in Continuous Time . . . .. . . . . . . . . . . . . . . . . . . .
14.4 Key Takeaways, References and Exercises . . . . .. . . . . . . . . . . . . . . . . . . .
155
155
164
166
167
15 Introduction to Credit Risk Models . . . . . . . . . . . . . . . . . .. . . . . . . . . . . . . . . . . . . .
15.1 Introduction .. . . . . . . . . . . . . . . . . . . . . . . . . . . . . . . . . . . . . .. . . . . . . . . . . . . . . . . . . .
15.2 Credit Ratings . . . . . . . . . . . . . . . . . . . . . . . . . . . . . . . . . . . .. . . . . . . . . . . . . . . . . . . .
15.3 Structural Models . . . . . . . . . . . . . . . . . . . . . . . . . . . . . . . .. . . . . . . . . . . . . . . . . . . .
15.4 Reduced-Form Models .. . . . . . . . . . . . . . . . . . . . . . . . . .. . . . . . . . . . . . . . . . . . . .
15.5 Credit Derivatives and Dependent Defaults .. . . .. . . . . . . . . . . . . . . . . . . .
15.6 Key Takeaways, References and Exercises . . . . .. . . . . . . . . . . . . . . . . . . .
171
171
172
174
178
180
183
References .. .. . . . . . . . . . . . . . . . . . . . . . . . . . . . . . . . . . . . . . . . . . . . . . . . . .. . . . . . . . . . . . . . . . . . . . 185
Index . . . . . . . . .. . . . . . . . . . . . . . . . . . . . . . . . . . . . . . . . . . . . . . . . . . . . . . . . . .. . . . . . . . . . . . . . . . . . . . 189
1
Interest, Coupons and Yields
Each of us has experience with paying or receiving interest. If you wish to purchase
goods today despite having insufficient funds, you can, for example, borrow money
from a bank. Your desired purchases could include a house, a car or consumption
goods, and the borrowing could be in the form of a current account overdraft or a
term loan. You take the position of a borrower, while the bank acts as creditor (or:
lender) and it will charge you interest on the amount you owe.
On the other hand, when you have accumulated savings that you wish to spend
only in the future, you can lend the money to banks (in the form of deposits),
governments (government bonds), or corporations (corporate bonds), which will
pay you interest on the funds provided.
In the retail saving-lending market, banks take the position of financial intermediaries. Financial intermediaries have many functions, including size transformation
(many small deposits can be accumulated to provide one large loan to e.g. a
corporate) and term transformation (small short-term deposits can be transformed
into a longer-term loan).
1.1
Time Value of Money
An investor providing funds to a borrower will expect to receive a financial return,
and if the money is provided as debt, the return will be in the form of interest
payments. How much interest is paid will depend, among other factors, on the
borrowed amount, the time until repayment (or: maturity) and on the likelihood
of the borrower making payments in the future as agreed in the loan contract.
Assuming liquid financial markets, unrestricted mobility of capital and complete
information for all market participants would imply that borrowers of identical
credit quality pay the same amount of interest for identical loan structures (including
the same starting date, term, borrowed amount, and currency). However, this is not
entirely the case in practice. The reasons include that the capital of retail investors
is not sufficiently mobile to choose the best investment between all investments
H. Albrecher et al., Introduction to Quantitative Methods for Financial Markets,
Compact Textbooks in Mathematics, DOI 10.1007/978-3-0348-0519-3 1,
© Springer Basel 2013
1
2
1 Interest, Coupons and Yields
available, and the fact that certain investments are treated with tax advantages, such
as certain pension saving products.
The part of the interest costs in excess of what is charged for otherwise identical
but (quasi) risk-free structures, is sometimes referred to as credit spread. Debt issues
by governments of stable developed economies (e.g. the US, Germany or the UK)
are often priced close to risk-free, whereas private borrowers, such as individuals
or corporations, might pay significantly higher interest. The risk that the borrower
will not make contractual payments in full and on time is called credit risk (cf.
Chapter 15 – we will neglect credit risk until then).
Suppose the amount B.t0 / is invested at time t0 (measured in years) for a term
of one year. The borrower agrees to pay an interest rate of R % per year (also: per
annum, p.a.). After a year the borrower will repay B.t0 / .1 C R=100/ under the
loan agreement. The balance of the lender’s cash account in one year from t0 (after
interest payment and repayment of the borrowed amount) would therefore be
B.t0 C 1/ D B.t0 /
1.2
Ã
Â
R
:
1C
100
Interest on Debt, Day-Count Conventions
Debt products with a maturity in excess of one year often offer at least annual
cash payments. Such products include loans from banks, and bonds as their capital
market counterparts. Bonds are debt securities that promise the payment of some
principal amount and regular (e.g. annual) coupons1 (see Section 2.1).
Example
Bond terms of a bond issue by the Government of Austria “2006-2016/2/144A (1st extension)”
with security code ISIN AT0000A011T9 (source: Austrian control bank)
Borrower: Republic of Austria
Issue volume: 1.65bn EUR
Issue date: 7 July 2006
Maturity date: 15 September 2016 (10 years 70 days)
Coupon payments: 4 % p.a. on the principal amount, annual coupon
First coupon payment day: 15 September 2006
Day-count convention: ACT/ACT; business-day convention: TARGET
1
In earlier days bond investors physically held certificates promising the coupon payments and
principal repayments. To receive interest payments the investor would exchange coupons against
cash on the payment dates. The coupons came in the form of stubs attached to the main bond
certificate. Nowadays bond certificates are typically held by trustees and payments are made based
on electronic registration systems.
1.2 Interest on Debt, Day-Count Conventions
3
As not many investors would be able to provide the entire amount raised in a
corporate or government bond issue, such issues are typically split into many small
bonds that can be distributed to a large number of investors. The principal amount
(or: nominal, face value) of such a bond could, for instance, be 1,000 EUR or 10,000
EUR.2 The market place where investors can buy bonds in a new bond issue is called
primary market. The splitting of a bond issue into smaller bonds will increase the
number of potential buyers, and also ensure liquidity when primary market investors
wish to sell on their bonds to other investors in the secondary market at a later time
prior to maturity.
Note that a capital market investor would not necessarily pay face value (or: at
par) for a bond initially. If investors see the coupon payment, of e.g. 4% p.a., as too
low (high), they will offer less (more) than face value.3
The actual coupon payment on a payment date is determined by the nominal interest
rate R% (here: 4% p.a.) times the fraction of a year since the last coupon payment
date under a specified day-count convention. Denote the day from which interest is
accrued as t1 D .D1=M1=Y 1/, the date up to which interest is accrued as t2 D
.D2=M 2=Y 2/, and the number of interest bearing days as Di . When calculating
Di for an interest period .t1 ; t2 , the first day is typically excluded and the last day
is included, so that no days are double-counted. Widely used day-count conventions
include the following.4
• ‘30/360’: D30=360 D .D2 D1/ C .M 2 M1/ 30 C .Y2 Y1 / 360 and the
coupon payment at t2 is
principal
R
100
D30=360 =360:
Note that, in principle, months are equally weighted in the 30/360 method,
despite having a different number of days.5 30/360 is the typical method used
for US government bonds.
• ‘Actual/365’: days are counted as they occur. DActual=365 D number of days
between t1 and t2 , so that the coupon payment at t2 is given by
principal
2
R
100
DActual=365 =365:
We will refer to currencies by their three-letter ISO 4217 codes as used in currency trading, for
example EUR, GBP, USD, CHF, JPY, SEK.
3
If a bond with a face value of 100 trades at 100, it is said to price at par. If it trades below 100,
one would say that it trades at a discount to face value, and for prices of above 100 we would say
it trades at a premium to face value
4
For further details check, for example, SWX Swiss Exchange [17].
5
When using a 30/360 method, there are different conventions of counting when e.g. D2 D 31 and
D1 D 30.
4
1 Interest, Coupons and Yields
Note that over a leap year the interest paid is principal R=100 366=365. In
practice you can also find ‘Actual/Actual’, where the number of days in a leap
year is divided by 366 and days in non-leap years are divided by 365, so that the
interest paid in 365 and 366-day years is equal.
• ‘Actual/360’: days are counted the same way as in the previous example, i.e.
DActual=365 D DActual=360 , but coupons are generally higher, at
principal
R
100
DActual=365 =360:
This is also called ‘French’ method and is widely used in the money markets (i.e.
for maturities not exceeding one year, including USD and EUR markets) and for
EUR mortgages.
Further to the government bond example, note that 15 September 2007 was a
Saturday and coupon payments are typically only made on business days. How
to deal with such a case is agreed upon in the business-day conventions. Modified
following is a popular choice, and defines that coupon payments are carried out
on the day if it is a business day, or otherwise on the first business day thereafter.
In our example, this would mean that the 2007 coupon payment was made on the
17th (Monday) instead of the 15th (Saturday) of September. If the 2007 coupon
was calculated as if paid on the 15th of September, this calculation method would
be called unadjusted. If, however, the 2007 coupon size was based on the period 15
September 2006 to 17 September 2007, this would be called adjusted coupon. Apart
from weekends, one also needs to regulate how to deal with public holidays, which
will differ among countries. In the EUR area, one typically uses the ‘TARGET’
calendar, which only defines 1st of January, 1st of May, 25th/26th of December,
Good Friday and Easter Monday as holidays.
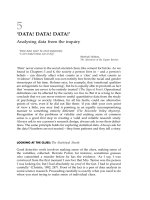
Figure 1.1 (source: Vienna Stock Exchange) shows the price moves of the
Austrian government bond in the above example over its life up to 2012. Note that
market interest rates were generally falling as a result of the economic downturn
from 2008 to 2012, so that the graph shows an upward move in the bond price
(the bond now pays a relatively high coupon at 4 %) from 2008. As the bond
approaches its maturity in 2016, we expect the traded price to tend to the final
principal repayment of 100 % of face value.
Who receives an upcoming coupon payment is determined on the ex-coupon
date. This is the last day on which an investor buying the bond will receive the
next upcoming coupon payment. It is obvious that bonds will sometimes be traded
in between coupon payment dates, so that one investor will not receive interest for
part of the holding period from the borrower.
Zooming into the graph would not show major jumps around the coupon payment
dates (15/09/2006, 17/09/2007, etc.) despite the payment of a coupon. The reason
lies in the prices reflecting clean prices. If investors sell bonds in between coupon
payment dates, they expect to receive interest from the new holder of the bond
(buyer) for their hold period since the last coupon payment day. This portion of
the coupon is referred to as accrued interest. The price at which the bond will be
1.3 Accrued Interest
5
4% Bundesanl. 06-16/2/144A
% 110.000
-0.36%
n.a. /AT0000A011T9 / Vienna Stock Exchange
04/20 11:45:07
− 0.40
Hoch: 110.000
Tief: 110.000
114
112
110
108
106
104
102
100
98
96
2006
2007
2008
2009
2010
2011
94
Fig. 1.1 Price chart of the Austrian government bond as described in this section, 2006–2012
sold is the dirty price, which is calculated as clean price C accrued interest. Accrued
interest is not produced by traded prices, but simply calculated as the portion of the
upcoming coupon that refers to the hold period since the last coupon payment date
according to the day-count convention.
1.3
Accrued Interest
In the following we will disregard possible effects of day-count conventions.
Nominal interest rates are defined as a percentage R % and a time unit to which
it is applied, e.g. 4 % p.a. It is market convention to use one year as time unit
when stating nominal interest rates. If a 10-year bond pays a coupon of 4% at
the end of each year, this would be preferred by investors over a payment of
10 4% D 40% at the maturity of the bond, as received coupon payments can
be reinvested. Hence, one also has to define the compounding period after which
interest is paid out. A compounding period of 3, 6 or 12 months results in quarterly,
semi-annual or annual interest payments, respectively. If the time unit is the same as
the compounding period, the nominal interest rate is also the effective interest rate i .
We now let i .m/ denote the nominal interest rate p.a. with compounding period
1=m years (i.e. compounded m times per year), which leads to the equivalent
amount by the end of the year, i.e.
6
1 Interest, Coupons and Yields
Ãm
Â
i .m/
1Ci D 1C
:
m
Correspondingly, i .m/ D m Œ.1 C i /1=m 1. If we shorten the periods between
interest payments further and further, the limit m ! 1 leads to continuous
compounding with (nominal) rate
r WD lim i .m/ D ln.1 C i /:
m!1
Hence, an initial account balance of B.t0 / will give
B.t0 C n/ D B.t0 / e rn
by the end of year n. We can also say that B.t0 / is given by discounting the future
balance B.t0 C n/ at the continuously compounded rate r, i.e. B.t0 / D B.t0 C
n/ e rn . One can express the dynamics of the continuously compounded bank
account by
dB.t/ D B.t/ r dt
with initial condition B.t0 / D Bt0 , and t0 Ä t Ä t0 C n. This ordinary differential
equation (ODE) can also be extended to the case where r is a deterministic or
stochastic function of time (see Chapter 10).
1.4
Floating Rates, Libor and Euribor
Central banks provide a platform for banks to borrow and lend money to each
other, which is called inter-bank market. The interest rate offered in this market
for lending/borrowing is referred to as Interbank Offered Rate. Since 1986 the
British Bankers’ Association has been reporting an average of the inter-bank rates
used in the London market on a daily basis, and the quoted rate is called London
Interbank Offered Rate (short: Libor). Libor interest rates are published for various
maturities, including 1, 3, 6 and 12 months, and we will refer to these rates as
Libor1M, Libor3M etc. Note that Libor rates are not only available for British
pounds (GBP), but also for many other currencies, including the US dollar (USD),
the Euro (EUR) and the Swiss franc (CHF). The inter-bank rates in the EUR-market
are compiled by the European Banking Federation and quoted as Euribor rates.6
6
Concretely, the Euribor rate is determined based on the offering rates of 43 panel banks (as of
May 2012), and after eliminating the top and lowest 15 % of the quotes, the Euribor is computed
as the arithmetic mean across the remaining figures, rounded to three decimal places.
1.4 Floating Rates, Libor and Euribor
7
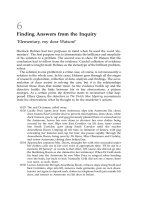
Fig. 1.2 Euribor3M and Euribor12M (01/1999 to 03/2012)
Figure 1.2 depicts the development of the Euribor3M and Euribor12M (in % p.a.)
from 1999 to early 2012.7
If bank A lends 1mn EUR to bank B for a term of one year, bank B has the obligation
to repay the principal of 1mn EUR (principal repayment) plus the interest for the
year at Euribor12M. Note that for such an inter-bank loan, the applicable interest
rate (here: Euribor12M) will be fixed at the beginning of the period, and not at the
end (‘fixing in advance’).
A vanilla floater8 is a variable-interest bond with annual, semi-annual or
quarterly coupons. The respective coupon payments, which are paid at the end of
every coupon period, are calculated by
principal
reference interest rate
DCF,
where DCF is short for day-count fraction and describes the coupon period as the
proportion of the whole year according to the day-count convention.
Example
Determine the appropriate initial price x of a vanilla Euribor floater issued by a bank which can
borrow at Euribor in the markets. Assume a maturity of 10 years, annual coupon payments and a
face value of 1.
7
Source: German Bundesbank, www.bundesbank.de.
Standard products that show no exceptional features are often called ‘(plain) vanilla’, like vanilla
ice cream, which seems to be one of the top-selling flavors.
8
8
1 Interest, Coupons and Yields
The bond cash flows can be described as follows:
time investor pays
0
x
1
2
:::
9
10
borrower pays
Euribor12M (fixed at time 0)
Euribor12M (fixed at time 1)
:::
Euribor12M (fixed at time 8)
Euribor12M (fixed at time 9)
plus principal repayment of 1.
Euribor12M (fixed at time 9) reflects the interest rate at at which banks would lend money in the
inter-bank market for a year, from time 9 to time 10. The present value9 at time 9 of the cash flow at
time 10 is then 1, and by backward induction one can conclude that the present value of the floater
at all coupon payment dates as well as the starting date will equal the face value, so that x D 1.
The considerations in the above example lead us to the following observation:
Conclusion
Neglecting credit risk, the value of a vanilla floater equals its face value on its
coupon payment dates and on its starting date.10
The value of a vanilla floater on its coupon days is simply its face value. In between
coupon days, the value of the bond depends on the current market interest rates and
the coupon as determined on the last coupon fixing day.
1.5
Bond Yields and the Term Structure of Interest Rates
Suppose that a bond produces known cash flows ci at times ti (i D 1; : : : ; N ).
Discounting at some fixed intensity y will lead to a present value at time t0
(neglecting day-count conventions) of
P .t0 / D
N
X
e
y .ti t0 /
ci :
i D1
In practice, one will be able to observe the traded market price P .t0 / of e.g. some
fixed-coupon bond and the cash flows ci from the bond at times ti will be defined
in the bond contract. The market-implied constant (discounting) intensity y is then
9
The present value is generally defined as the value that a particular stream of future cash flows
has at present.
10
The term ‘value’ is used here in the sense of fair value. See Chapter 2 for a general discussion.
1.5 Bond Yields and the Term Structure of Interest Rates
9
given by solving the above equation, and y is called the (continuously compounded)
yield of the bond. For given cash flows ci at times ti , the mappings
P .t0 / 7! y
and
y 7! P .t0 /
are called price-to-yield function and yield-to-price function, respectively.
0 .i
1/ with ci > 0 for at least one
Lemma. Suppose ti > t0 and ci
i 1. Then every positive market price P .t0 / uniquely determines the continuously
compounded yield y 2 R.
Proof. For y ! 1, the present value of the bond tends to 0, and, conversely, for
y ! 1 the present value tends to 1. As the present value is a continuous function
of y, the existence of a solution follows from the Mean Value Theorem and the
uniqueness from the monotonicity property of the present value with respect to y.
t
u
Note that for y D 0, the present value simply corresponds to the sum of the cash
flows. Hence, under the above assumptions we conclude that if the present value is
smaller than the sum of the cash flows, the yield y will be positive.
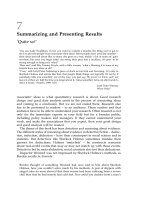
Example (Development of AAA EU Government Yield Curves)
Figure 1.3 depicts the yields of European AAA-rated government bonds as a function of maturity.
This representation is often referred to as yield curve. In 2005, well before the start of the 2007
Credit Crisis, the yield curve was upward sloping, with yields of around 2 % at the short end,
up to approx. 4% at the long end. From the Sep 2008 (just days after the insolvency of Lehman
Brothers) curve, it becomes obvious how drastically the shape of the yield curve can change. Shortterm yields had increased significantly due to falling demand of short-term investments as investors
tried to preserve cash in times of great uncertainty. Finally, as the economic downturn unfolded, a
flight to safety alongside with a low short-term interest rates environment led to increased demand
for short-term high-quality government bonds, resulting in lower yields, or a steepening of the
yield curve at the lower end. This is obvious from the Nov 09 and Feb 12 yield curves.
In the above, the yield was determined as the unique discount rate applied to all
cash flows of the bond to give its present value. In a slightly different approach, one
could understand a bond as a portfolio of different future cash flows. Note that we
have previously assumed the interest rate r to be constant across all maturities (i.e. a
flat interest curve). In practice, however, we will often find interest rates for longer
maturities to be higher than for shorter maturities (i.e. a normal or upward sloping
interest curve). We will therefore denote the (continuously compounded) interest
rate at time t0 applied up to time ti > t0 as r.t0 ; ti /.
Keep in mind that interest rates for different maturities can vary greatly. Suppose
that the cash flows ci from a bond at times ti are known. The present value of the
bond (neglecting day count conventions) can also be written as the sum of the cash
flows discounted by the interest rates for the respective terms,
10
1 Interest, Coupons and Yields
AAA EU Government Yield Curve, Sep 08
5
4
4
yield (%)
yield (%)
AAA EU Government Yield Curve, Jan 05
5
3
2
1
3
2
1
0
0
1
2
3
4
5
6
7
8
0
9 10 11 12 13 14
0
1
2
3
4
5
6
maturity
AAA EU Government Yield Curve, Nov 09
8
9 10 11 12 13 14
AAA EU Government Yield Curve, Feb 12
5
5
4
4
yield (%)
yield (%)
7
maturity
3
2
1
3
2
1
0
0
0
1
2
3
4
5
6
7
8
9 10 11 12 13 14
0
1
2
3
4
5
maturity
6
7
8
9 10 11 12 13 14
maturity
Fig. 1.3 EUR AAA yield curve development 2005 to 2012. Source: European Central Bank
P .t0 / D
N
X
e
r.t0 ;ti / .ti t0 /
ci :
i D1
The yield y will hence be some sort of average over the used discount rates
r.t0 ; ti / (or: zero rates). Zero rates can be extracted from current bond prices by
the bootstrapping method, as described in Section 3.3. The plot of the zero rates as
a function of maturity is often called term structure or zero curve. Chapter 9 will
discuss interest rate models in more detail.
1.6
Duration and Convexity
Suppose a currently traded bond price implies a particular yield y D y0 . As
investors often think in terms of yields, we are now interested to estimate how
changes in the yield will change the bond price. Consider the derivative
ˇ
@P .t0 / ˇˇ
D
@y ˇyDy0
N
X
e
y0 .ti t0 /
ci .ti
t0 /:
i D1
The above expression describes the sensitivity of the bond price, and the
following is a widely used sensitivity measure in practice:
Definition. The Macaulay duration D.y0 / of a bond with present value P .t0 / and
initial yield y0 is defined as
1.6 Duration and Convexity
11
D.y0 / WD
ˇ
@P .t0 / ˇˇ
1
:
P .t0 / @y ˇyDy0
The expression
N
X
.ti
D.y0 / D
Â
t0 /
i D1
e
y0 .ti t0 /
ci
Ã
P .t0 /
makes clear that the Macaulay duration is attained by weighting the contribution of
the i-th discounted cash flow to the present value P .t0 / by the time factor .ti t0 /
(and, conversely, that D.y0 / is a convex combination of the times .ti t0 /). The
Macaulay duration can hence be interpreted as the weighted average cash flow time.
For higher yields, later cash flows lose relative weight due to discounting, so that
the duration of a cash flow decreases as its yield increases.
Zero-coupon bonds are bonds that do not pay running coupons and only provide
one final cash flow at maturity, and their durations are given by their respective
maturities.
The sensitivity of the duration to changes in y0 can be described by the following
measure:
Definition. The convexity C.y0 / of a bond with price P .t0 / and current yield y0 is
defined as
ˇ
@2 P .t0 / ˇˇ
1
C.y0 / D
:
P .t0 /
@y 2 ˇyDy0
A Taylor expansion of the present value P .y/ at y D y0 gives
P
D
P .t0 /
D.y0 / y C
1
C.y0 / .y/2 C
2
;
with P D P .y0 C y/ P .y0 /. Chapter 13 will further discuss the concept of
duration when dealing with the valuation of exotic derivatives. We close the present
chapter with an example illustrating the duration/convexity concepts based on a
trading strategy.
Example
(Barbell strategy) An investor who runs a barbell strategy assembles a portfolio of long and short
positions in bonds with different maturities. This is in an attempt to profit from parallel shifts in the
yield curve (i.e. yields for all maturities change by (close to) the same y, upward or downward).
12
1 Interest, Coupons and Yields
One can attain market data on bond prices and current yields, and a selection of bonds, each with
a face value of 100, could look as follows11 :
maturity (in years) 3
7
15
y0
2.58% 3.23%
3.85%
coupon
2.5%
2.25%
4.5%
P .0/
99.68
93.64
106.43
All coupons are annual, neglect day-count issues and assume that the first coupon of each bond
is paid in a year from now. Verify that the prices and yields as listed above match. Note that
the 7-year coupon is larger than the yield, so that P7 year .0/ < 100, while the 15-year bond
has a coupon in excess of the yield (for exact comparison, you would have to calculate e.g. the
equivalent ‘continuously compounded’ coupon. Why?), so that P15 year .0/ > 100. Using the
formulas derived in this section, we can compute the durations and convexities of the bonds as
maturity (in years) 3
7
15
duration D
2.92 6.54 11.35
convexity C
8.69 44.55 152.43
Given its long life and its relatively large coupons, the duration of the 15-year bond is significantly
lower than its maturity. We can now assemble a portfolio of x3-year D 10, x5-year D 10 and
x15-year D 2:65 units of the respective bonds. This is called barbell strategy since we buy shortterm and long-term bonds, while short-selling12 medium-term bonds (weights at its ends pull the
barbell down while you push it up in the middle). Based on the above Taylor approximation, the
duration-based change of the portfolio value (all yields change by ˙y) is given by
Pdur D
y Œ10 99:68 2:92
10 93:63 6:54 C 2:65 106:43 11:35 D 0:
The convexity-based change of the portfolio value, on the other hand, is positive for both negative
and positive changes to the yield, which is mainly driven by the large convexity of the long-dated
15-year bond:
Pcon D
.˙y/2
Œ10 99:68 8:7
2
10 93:63 44:55 C 2:65 106:43 152:43 D
.y/2
9;935:
2
Hence, judging by a 2nd-order Taylor approximation, if all yields widened by 1 %, the portfolio
value would rise by 0.5, and if all yields fell by 1 %, the portfolio value would rise by 0.5 as well,
so that we profit from parallel yield curve shifts in either direction. Looking at the yield curve
developments in Figure 1.3, where would you see the major risk in implementing such a strategy?
11
The yield/price quotes used here roughly correspond to EU AAA government bonds as of Jan
2005 (cf. Figure 1.3. Yield/price quotes for government bonds can e.g. be obtained at www.
bloomberg.com/markets/.
12
Short-selling can be imagined as borrowing today’s price of a stock, while the repayment will be
again at the (future) price of the stock. If the stock price falls, the short-seller will gain, as he has
to repay less.
1.7 Key Takeaways, References and Exercises
1.7
13
Key Takeaways, References and Exercises
Key Takeaways
After working through this chapter you should understand and be able to explain the
following terms and concepts:
I Nominal interest rates, annual/semi-annual/quarterly/continuous compounding
I Day-count conventions (30/360, Actual/365, Actual/360), Business-day conventions
(TARGET)
I Bond prices typically rise/fall as market interest rates fall/rise, and tend to face value
as maturity is approached
I Fixed-rate vs. floating rate bonds (with Libor, Euribor as reference rate-coupons are
’fixed-in-advance’)
I Bond price as function of the bond yield vs. bond price as function of the cash flows
discounted at the zero rates
I Yield curves: flat, normal, shape change over time
I Duration/convexity: definitions, link to Taylor approximation of value change, barbell strategy
References
Well-structured and comprehensive discussions of the topics covered in this section can be found,
for example, in Hull [41] or Wilmott [75]. Current and historical interest curves can be viewed at
websites of exchanges, such as www.deutsche-boerse.com, www.swx.com or www.wienerborse.
at, or from central banks including www.bundesbank.de, www.snb.ch and www.ecb.int.
Exercises
1. Calculate the point in time at which some initial capital c has doubled, if interest is compounded
(i) annually, (ii) monthly or (iii) continuously, using an interest rate of R % (p.a.). In particular,
give a numerical answer to the above for R D 5.
2. A generous benefactor launches a foundation that will award an annual prize for extraordinary
accomplishments in the field of mathematics, similar to the Nobel Prize. Assume interest can be
earned at 4 % p.a. and compute the required initial capital c such that 1mn EUR can be awarded
to the respective laureate each year (i) for 10 years, (ii) for 100 years, or (iii) forever.
3. In addition to the Macaulay duration, the modified duration is widely used. It also measures the
sensitivity of the present value of a future cash flow stream with respect to the discounting rate,
but assumes discrete (typically annual) interest payments and uses the yield-to-price function
t0 //. Derive an explicit formula for the resulting
.1 C ym / .ti t0 / instead of exp. y.ti
modified duration.
Exercises with Mathematica and UnRisk
4. (a) Use the commands MakeFixedRateBond, CashFlows and Valuate to determine
the exact dates and amounts of the cash flows of the government bond described in Section
1.2 (with the ACT/ACT day-count convention).
14
1 Interest, Coupons and Yields
1040
1020
1000
980
960
940
500
1000
1500
2000
2500
3000
3500
Fig. 1.4 Dirty and clean price with constant annual interest rate of 5 %
1300
8
1200
Difference
Price
1100
1000
900
6
4
2
800
0.04
0.06
0.08
Yield
0.10
0.04
0.06
0.08
Yield
0.10
Fig. 1.5 Yield-to-price function of the government bond (Section 1.2) and the zero-coupon bond
(left), and the difference between the two functions (right)
(b) Use the command MakeYieldCurve to plot the ‘dirty’ and the ‘clean’ price of this bond
as a function of time up to maturity, under the assumption of a constant interest rate of 5 %
(see Figure 1.4).
(c) Test the sensitivity of these curves as the interest rate is changed to 4 % or 6 %. Implement
a scroll bar to change the interest rate.
(d) Test how the curves change if the day-count convention 30/360 is used.
(e) Assume that the zero rates follow the law
r.2006 C t0 I T / D
2 C 3 exp. t0 =5/
100
from 2006 onwards, but are constant for 2006 C t0 . How do the plots of the dirty and the
clean price of part (b) change under these new assumptions?13
5. Suppose y D 0:04. Use UnRisk to construct the zero-coupon bond by choosing the nominal
amount and the maturity, such that the bond has the same price, yield and duration as the
government bond in Section 1.2. Assume an ACT/ACT day-count convention. Illustrate that
the convexity of the two bonds is different. Plot the yield-to-price functions for y 2 Œ0:01; 0:1
(see Figure 1.5).
13
The forward interest rates as implicitly used here will be discussed further in Chapter 9.
2
Financial Products
2.1
Bonds, Stocks and Commodities
Bonds
In Chapter 1, bonds have been introduced as an important class of financial assets
which is structurally similar to loans. The authorized issuer promises in the bond
contract to make future payments according to a fixed schedule, up to some final
time T (the term or maturity of the bond).1 The promised payments typically consist
of the principal (or: face value) of the bond (e.g. 10,000 EUR) at time T and a regular
(for example, annual, semi-annual or quarterly) coupon (e.g. 500 EUR at the end of
every year). If no coupon is paid, there is only one payment at maturity (typically
after one year or less) and the bond is called zero-coupon bond. Coupon payments
can be an initially fixed amount, e.g. 5% p.a. of the principal. Alternatively, the size
of the coupon can be linked to some reference interest rate, e.g. LiborC1% (see
Section 1.4). If the principal is paid in one lump sum at maturity, the bond is called
bullet. Otherwise one speaks of an amortizing bond.
Note that the issuer will often hold an auction when initially selling the bond to
investors. The initial price of the bond is determined by the bids of the investors,
and can be different from the face value. Given a face value of 100, if investors offer
more than 100, the bond is said to sell at a premium to par. Conversely, if investors
offer less than 100, the bond sells at a discount to par. Once the bond is sold to the
initial investors in the primary market, these investors might decide to sell the bond
to other parties in the secondary market. Bonds are debt securities and can easily be
traded privately (for example, through bond funds, insurance companies or banks),
or exchanges might provide a platform to match buyers and sellers. Note that a bond
investor will record the bond as an asset on its balance sheet, while the issuer will
report it as a liability (i.e. as an obligation to pay money in the future).
1
Due to their fixed payment schedule, bonds are also referred to as fixed income products.
H. Albrecher et al., Introduction to Quantitative Methods for Financial Markets,
Compact Textbooks in Mathematics, DOI 10.1007/978-3-0348-0519-3 2,
© Springer Basel 2013
15