Application of image processing in fruit and vegetable analysis a review
Bạn đang xem bản rút gọn của tài liệu. Xem và tải ngay bản đầy đủ của tài liệu tại đây (790.26 KB, 22 trang )
Seediscussions,stats,andauthorprofilesforthispublicationat: />
ApplicationofImageProcessinginFruitand
VegetableAnalysis:AReview
ArticleinJournalofIntelligentSystems·January2014
DOI:10.1515/jisys-2014-0079
CITATIONS
READS
9
7,348
2authors:
ShivRamDubey
AnandSinghJalal
IIITSriCity,India
GLAUniversity
35PUBLICATIONS435CITATIONS
59PUBLICATIONS1,852CITATIONS
SEEPROFILE
SEEPROFILE
Someoftheauthorsofthispublicationarealsoworkingontheserelatedprojects:
speechrecognitionViewproject
ImageSteganographyViewproject
AllcontentfollowingthispagewasuploadedbyShivRamDubeyon17October2017.
Theuserhasrequestedenhancementofthedownloadedfile.
Journal of Intelligent Systems, vol. 24, no. 4, pp. 405-424, 2015
Application of Image Processing in Fruit and
Vegetable Analysis: A Review
Shiv Ram Dubey, Anand Singh Jalal
GLA University Mathura, India
This article is published by Journal of Intelligent Systems, De Gruyter
The online version DOI: 10.1515/jisys-2014-0079
ABSTRACT
Images are the important source of data and information in the agricultural sciences. The use of image
processing techniques is of outstanding implication for the analysis of agricultural operations. Fruit and
vegetable classification is one of the major applications that can be utilized in the supermarket to
automatically detect the kind of the fruit or vegetable purchased by the customer and to generate the costs
for it. Training on-site is the underlying prerequisite for this type of arrangement, which is generally
caused by the users having little or no expert knowledge. In this manuscript, we explored various methods
which addressed fruit and vegetable classification as well as fruit disease recognition problem. We
surveyed the approaches used for fruit disease detection, segmentation and classification of images using
image processing. We also compared state-of-the-art methods in this manuscript in two scenarios i.e. fruit
and vegetable classification and fruit disease classification. The methods surveyed in this paper are able to
distinguish between different kind of fruits and its diseases which are very alike in color and texture.
KEYWORDS: Image Processing, Fruit Analysis, Fruit Disease Detection, Color, Shape, Texture
1. INTRODUCTION
In agricultural science, images are the important source of data and information. To reproduce and report
such data, photography was the only method used in recent years. It is difficult to process or quantify the
photographic data mathematically. Digital image analysis and image processing technology circumvent
these problems based on the advances in computers and microelectronics associated with traditional
photography. This tool helps to improve images from microscopic to the telescopic visual range and
offers a scope for their analysis. Several applications of image processing technology have been
developed for the agricultural operations. These applications involve implementation of the camera based
hardware systems or color scanners for inputting the images. The computer based image processing is
undergoing rapid evolution with ever changing computing systems. The dedicated imaging systems
available in the market, where the user can press a few keys and get the results, are not very versatile and
more important, they have a high price tag on them. Additionally, it is hard to understand as to how the
results are being produced. We have attempted to investigate the solutions through published literature
which presents classification problems in a most realistic way possible.
Recognition system is a ‗grand challenge‘ for the computer vision to achieve near human levels of
recognition. The fruits and vegetable classification is useful in the supermarkets where prices for fruits
purchased by a client can be defined automatically. Fruits and vegetable classification can also be utilized
in computer vision for the automatic sorting of fruits from a set, consisting of different kind of fruits.
Picking out different kind of vegetables and fruits is a recurrent task in the supermarkets, where the
cashier must be capable to identify not only the species of a particular fruit or vegetable (i.e., banana,
apple, pear) but also identify its variety (i.e., Golden Delicious, Jonagold, Fuji), for the determination of
its cost. This problem has been solved for packaged products, but most of the time consumers want to
pick their product, which cannot be packaged, then it must be weighted. Assignment of codes for each
2
kind of fruit and vegetable is a common solution to this problem; but this approach has some problems
such as the memorization, which may be a reason for errors in pricing. As an aid to the cashier, a small
book with pictures and codes is issued in many supermarkets; the problem with this approach is that
flipping over the booklet is time-consuming.
This research reviews several image features and image descriptors in the literature and presents a
system to solve the problem by adapting a camera at the supermarket that recognizes fruits and vegetables
on the basis of color and texture cues. Formally, the system must output a list of possible types of species
and variety for an image of fruit or vegetable. The input image contains fruit or vegetable of single
variety, at random position and in any number. Objects inside a plastic bag can add hue shifts and
specular reflections. Given the variety and the impossibility of predicting which types of fruits and
vegetables are sold, training should be done on site by someone having little or no technical knowledge.
The solution of the problem is that the system must be able to achieve a higher level of accuracy by using
only a few training examples. Monitoring of health and detection of diseases is critical in fruits and trees
for sustainable agriculture. To the best of our knowledge, no sensor is available commercially for the real
time assessment of trees health conditions. Scouting is the most widely used method for monitoring stress
in trees, but it is expensive, time consuming and labor-intensive process. Polymerase chain reaction which
is a molecular technique used for the identification of fruit diseases, but it requires detailed sampling and
processing procedure.
Early detection of disease and crop health can facilitate the control of fruit diseases through proper
management approaches such as vector control through fungicide applications, disease-specific chemical
applications and pesticide applications; and improved productivity. The classical approach for detection
and identification of fruit diseases is based on the naked eye observation by experts. In some of the
developing countries, consultation with experts is a time consuming and costly affair due to the distant
locations of their availability. Automatic detection of fruit diseases is of great significance to
automatically find the symptoms of diseases as early as they appear along the growing fruits. Fruit
diseases can cause significant losses in yield and quality appeared in harvesting. For example, soybean
rust (a fungal disease in soybeans) has caused a significant economic loss and just by removing 20% of
the infection, the farmers may benefit with an approximately 11 million-dollar profit (Roberts et al.,
2006). An early detection system of fruit diseases can aid in decreasing such losses caused by fruit
diseases and can halt further spread of diseases.
The various types of diseases of fruits determine the quality, quantity, and stability of yield. The
diseases in fruits not only reduce the yield but also deteriorate the variety and its withdrawal from the
cultivation. Fruit diseases appear as spots on the fruits and if not treated on time, cause the severe loss.
Excessive use of a pesticide for fruit disease treatment increases the danger of toxic residue level of
agricultural products and has been identified as a major contributor to the ground water contamination.
Pesticides are also among the highest components in the production cost and also it is not well as the
health perspective so, their use must be minimized. Therefore, this paper reviewed such approaches which
can detect the diseases in the fruits as soon as they produce their symptoms on the fruits such that proper
management treatment can be applied.
A lot of work has been done to automate the visual inspection of the fruits by machine vision with
respect to size and color. However, detection of defects in the fruits using images is still problematic due
to the natural variability of skin color in different types of fruits, high variance of defect types, and
presence of stem/calyx. To know what control factors to consider next year to overcome similar losses, it
is of great meaning to examine what is being celebrated. Some fruit diseases also infect other areas of the
tree, causing diseases of twigs, leaves and branches. The precise segmentation is required for the defect
detection. The early detection of fruit diseases (before the onset of disease symptoms) could be a valuable
source of information for executing proper pest management strategies and disease control measures to
prevent the development as well as the spread of fruit diseases.
The aim of this review paper is to research the use of image processing and computer vision
techniques in the food and farming industry. The main objective is to review the approaches to recognize
species and a diversity of fruits and vegetables and type of diseases present in the fruit from their pictures.
3
2. LITERATURE REVIEW
This section reviewed the study done by several researchers in the area of image categorization, fruits
recognition, fruit and vegetable classification, fruit disease identification using images. Fruit and
vegetable classification and fruit disease identification can be seen as an instance of image categorization.
Most of the researches in the field of fruit recognition or fruit disease detection have considered color and
texture properties for the categorization. Most of the work for fruit recognition is done with the fruits
located on trees, but we restrict ourself to the classification of fruits and vegetables amongst the several
kinds of fruits and vegetables. Most of the work for the fruit disease detection done in the literature is
restricted to the detection of a single type of disease only. In this section, several approaches used by
researchers is discussed with the aim of being aware of the latest research carried out, which are related to
the formulated problems in this paper.
2.1 Issues and Challenges
We will survey fruits and vegetables recognition and fruit disease identification methods in this
manuscript with respect to the number of challenges addressed. Here, we list some issues and
challenges which may be the basis to evaluate the different methods. The input images may contain
fruit or vegetable of more than one variety in arbitrary position and in any number. Many kinds of
fruits and vegetables are subject to significant variation in shape, texture and color, depending upon
their ripeness. For example, Orange ranges from being green, to yellow, to patchy and brown. Using
just one image feature to secure the class separability might not be sufficient, so it is necessary to
extract and combine those features which are useful for the fruit and vegetable recognition problem.
Sometimes, the object may be inside the plastic bag that can add hue shifts and specular reflections.
Different classifier may produce different results, so the selection of classifier must also be
addressed. In the literature, available classifiers works on two classes only, but in the produce
classification problem we consider more than two classes, so it is a major issue to use a binary
classifier in a multiclass scenario. Background subtraction may become necessary to reduce the scene
complexities such as illumination variation, sensor capturing artifacts, background clutter, shading,
and shadows. The result of the system heavily depends upon the efficient working of the image
segmentation method, so efficient image segmentation must be used. The performance of the fruit
disease recognition system also depends upon the defect segmentation, so precise defect
segmentation is required. It might be interesting to consider the number of training examples because
more number of training examples require more time to train the system. The system must perform
better in situations where the system is trained with less training examples.
2.2 Fruit and Vegetable Recognition and Classification
Recently, a lot of activity in the area of image categorization has been done. With respect to the
produce fruit and vegetable classification problem, Veggie-Vision (Bolle et al., 1996) was the initial
attempt of a supermarket produce recognition system. They used color, texture and density (thus taking
more information) features. Density is calculated by dividing weight with the area of the fruit. The
reported accuracy was ≈ 95% when color and texture features are combined, but top four responses are
used to achieve such result. Rocha et al. (2010) presented a unified approach that can combine many
features and classifiers. The authors approached the multi-class classification problem as a set of binary
classification problem in such a way that one can assemble together diverse features and classifier
approaches custom-tailored to parts of the problem. They have achieved classification accuracy up to
99% for some fruits, but they fused three features, namely Border-interior classification (BIC), Color
coherence vector (CCV), and Unser features and used top two responses to achieve them. Their method
4
shows poor results for some type of fruit and vegetable such as Fuji Apple. Arivazhagan et al. (2010)
combined the color and texture features to classify the fruits and vegetables. They used minimum distance
classifier and achieved 86% accuracy over the dataset having 15 different types of fruits and vegetables.
Further, Faria et al. (2012) presented a framework for classifier fusion for the automatic recognition of
fruits and vegetables in a supermarket environment. They combined low-cost classifiers trained for
specific classes of interest to enhance the recognition rate. Chowdhury et al. (2013) have recognized 10
different vegetables using color histogram and statistical texture features. They have gained the
classification accuracy upto 96.55% using neural network as a classifier. Danti et al. (2012) classified 10
types of leafy vegetables using BPNN classifier with a success rate of 96.40%. They first cropped and
resized the image and then extracted the mean and range of hue and saturation channel of HSV image to
form the feature vector. Suresha et al. (2012) have reached 95% classification accuracy over a dataset of
containing 8 types of different vegetables using texture measures in RGB color space. They have used
watershed segmentation to extract the region of interest as a pre-processing and decision tree classifier for
training and classification purpose.
In (Dubey, & Jalal, 2012a; Dubey, & Jalal, 2013; Dubey, 2013), a framework for fruits and vegetables
recognition and classification is proposed. They have considered images of 15 different types of fruit and
vegetable collected from a supermarket. Their approach first segment the image in order to extract the
region of interest and then calculate image features from that segmented region, which is further used in
training and classification by a multi-class support vector machine. They have also proposed an Improved
Sum and Difference Histogram (ISADH) texture feature for this kind of problem. From their results,
ISADH outperformed the other image color and texture features. Arefi et al. (2011) developed a
segmentation algorithm for the guidance of a robot arm to pick the ripe tomato using image processing
technique. To reach this aim, they prepared a machine vision system to acquire images from a tomato
plant. Their algorithm works in two phases: (1) background subtraction in RGB color space and then
extracting the ripe tomato considering a combination of RGB, HSI, and YIQ color spaces and (2)
localizing the ripe tomato using morphological features of the image. They achieved accuracy up to
96.36% on 110 tomato images.
Fruit detection greatly affects the robot‘s harvesting efficiency because it is an unstructured
environment with changing lighting conditions. Bulanon et al. (2009b) enhanced the fruit portion by a red
chromaticity coefficient and used a circle detection method for classification of the individual fruits. To
improve fruit visibility, they acquired multiple views from different viewing angles for a portion of a tree
canopy. According to their results, fruit visibility improved from 50% to about 90% by acquiring multiple
views. Date fruits are popular in the Middle East and have a growing international presence. Sorting of
dates can be a tedious job and a key process in the date industry. Haidar et al. (2012) presented a method
for classification of date fruits automatically based on pattern recognition and computer vision. They
extracted appropriately crafted mixture of 15 different visual features, and then, tried multiple
classification methods. Their performance ranged between 89% and 99%. Jimenez et al. (1999) presented
a methodology that is able to identify spherical fruits in natural environment facing difficult situations:
occlusions, shadows, bright areas and overlapping fruits. Range/attenuation data are sensed by a laser
range-finder sensor. The 3-d position of the fruit with radius and reflectance are obtained after the
recognition steps.
Vegetable quality is oftentimes referred to color, shape, mass, firmness, size and bruises from which
fruits can be classified. Lino et al. (2008) classified the lemons and tomatoes by the size and color of the
fruit. Peach fruits are recognized in (Liu et al., 2011) in a natural scene. The red peach region is obtained
first and then a matching expansion is used to recognize the entire region. The potential center point of
the fitting circle is calculated by the intersection of the perpendicular bisector of the line on the contour.
Finally, the center point and radius of the fitting peach circle are obtained by calculating the statistical
parameters of the potential center points. Variations in antioxidant profiles between fruits and vegetables
are studied in (Patrasa et al., 2011) using pattern recognition tools; classification was done based on
global antioxidant activity, levels of antioxidant groups (ascorbic acid, total anthocyanins, total phenolics)
and quality parameters (moisture, instrumental color). Interrelationships between the parameters
5
considered and the different fruits and vegetables were discovered by hierarchical cluster analysis (HCA)
and principal component analysis (PCA). Patel et al. (2011) presented the fruit detection using improved
multiple features based algorithm. They designed an algorithm with the aim of calculating different
weights for different features like color, intensity, edge and orientation of the input image. The
approximate locations of the fruit within an image are represented by the weights of the different features.
They achieved the detection efficiency up to 90% for different fruit image on a tree, taken from different
positions.
Thermal imaging is an approach to convert the pattern of invisible radiation of an object into visible
images to facilitate the feature extraction and analysis. If temperature differences can be used to assist in
analysis, diagnosis, or evaluation of a product or process, then Infrared thermal imaging technology can
be successfully applied. The potential scope of thermal imaging in food and agriculture industry includes
disease and pathogen detection in plants, predicting water stress in crops, predicting fruit yield, planning
irrigation scheduling, bruise detection in fruits and vegetables, evaluating the maturing of fruits,
temperature distribution during cooking, and detection of foreign bodies in food material. Vadivambal, &
Jayas (2011) reviewed the application of thermal imaging in food and agriculture industry and highlighted
on the potential of thermal imaging techniques in various agricultural process. The major advantage of
infrared thermal imaging approach is the non-contact, non-destructive, and non-invasive nature of the
technique to find the temperature distribution in a short period of time. Seng, & Mirisaee (2009)
combined three feature analysis methods: color-based, size-based and shape-based in order to increase the
accuracy of recognition. They used nearest neighbor classifier for the classification. They achieved up to
90% accuracy.
Researchers have begun to consider how mobile devices can be used to slow down the burden of
recording nutritional intake. Rahman et al. (2012) introduced a concept to integrate camera in a mobile
phone for capturing the images of food consumed. These images can be processed automatically to
identify the food items present in the image. They generated texture features from food images and
demonstrated that this feature leads to greater accuracy for a mobile phone based dietary assessment
system.
2.3 Fruit Disease Recognition and Classification
Automatic detection of fruit diseases is essential to automatically detect the symptoms of diseases as early
as they appear on the growing fruits. Fruit diseases can cause major losses in yield and quality appeared
in harvesting. To know what control factors to take next year to avoid losses, it is crucial to recognize
what is being observed. Some disease also infects other areas of the tree, causing diseases of twigs,
leaves, and branches. Some common diseases of apple fruits are apple scab, apple rot, and apple blotch
(Hartman, 2010). Apple scabs are gray or brown corky spots. Apple rot infections produce slightly
sunken, circular brown or black spots that may be covered by a red halo. Apple blotch is a fungal disease
and appears on the surface of the fruit as dark, irregular or lobed edges.
With increased expectations for food products of high quality, the need for fast, accurate and objective
quality determination in food products continues to grow. To accomplish these requirements, computer
vision provides one alternative for a cost-effective, non-destructive and automated technique. This image
analysis and processing based inspection approach has found a variety of different applications in the
food and agriculture industry. Brosnan, & Sun (2002); Brosnan, & Sun (2004) reviewed the progress of
computer vision and emphasizes the important aspects of the image processing technique coupled with
recent developments throughout the agricultural and food industry. In (Bennedsen, & Peterson, 2005), a
machine vision system is developed for sorting apples for surface defects, including bruises. Defects were
detected using a combination of a routine based on artificial neural networks and principal components
and three different threshold segmentation routines. They evaluated their routine using 8 apple varieties.
The routines ability to find individual defects ranged from 77 to 91% for the number of defects detected
and measured area ranged from 78 to 92.7% of the total defective area. Bennedsen et al. (2005) used
rotating apples in front of the camera to capture multiple images and removed the dark areas on the apple
surface efficiently. Pydipati et al. (2006) have identified the 4 types of citrus diseases including normal
6
one using color co-occurrence methods and generalized squared distance in HSV color space and
achieved more than 95% accuracy. Kim et al. (2009) have presented an approach to classify the grapefruit
peel diseases. Their dataset consists of the 6 types of diseases including normal one. ROI of the fruit is
generated by cropping over which intensity texture features are generated and classified using
discriminative analysis. They have gained 96% accuracy.
Bulanon et al. (2008) studied the variation of thermal temporal in the citrus canopy as a potential
approach for orange fruit detection. They used a thermal infrared camera and monitored tree canopy on
24 h cycles. Using a portable Dew Point Meter, they measured surface temperature, ambient temperature
and relative humidity. Canopy and fruit temperature profile demonstrated large temperature gradient from
afternoon (16:00) until midnight. They segmented the fruits very efficiently using image processing
techniques in the thermal images during the time range of the largest temperature difference. In (Bulanon
et al. 2009a), they fused a thermal image with a visible image of an orange canopy scene to improve fruit
detection. A thermal infrared camera captured the thermal image and a digital color camera acquired the
visible image. They applied two image fusion approaches, fuzzy logic and Laplacian pyramid transform.
Based on their results, the fuzzy logic approach is better than the LPT and both fusion approaches
improved detection as compared to thermal image alone.
A hyperspectral imaging system was developed by Qin et al. (2009) for acquiring reflectance images
in the spectral region from 450 to 930 nm from citrus samples. They performed spectral information
divergence (SID) classification method on hyperspectral images of the grapefruits for differentiating
canker from normal fruits and other citrus surface conditions based on quantifying the spectral similarities
using a predetermined canker reference spectrum. They reported 96.2% overall classification accuracy
using an optimized SID threshold value of 0.008. Crowe, & Delwiche (1996a) proposed the use of three
cameras which sense the reflectance in the visible region and narrow bands in the near infrared region for
simultaneous color evaluation and fruit defect detection. The visible region information is used in color
grading. A narrow band centered at 780 nm is used for concavity identification with structured
illumination while a second band centered at 750 nm allowed the detection of dark spots under complex
illumination. In another work, Crowe, & Delwiche (1996b) combined two near infrared (NIR) images of
each fruit with a pipeline image processing system in real-time. Structured illumination portion
information facilitates to distinguish defects from concavities. They estimated the total projected area of
defects on each fruit and accordingly classified the defects based on the defect pixel total.
Near-infrared hyperspectral imaging (NIR-HSI) is an emerging technique that combines imaging
techniques with the classical NIR spectroscopy in order to obtain spatial and spectral information
simultaneously from a field or a sample. The technique is fast, nonpolluting, non destructive, and
relatively inexpensive per analysis. Very recently, Dale et al. (2013) presented a review on the NIR-HSI
in agriculture and in the quality control of agro-food products. Growing interest in HSI has emerged for
quality and safety assessments of agro-food products. Lorente et al. (2012) highlighted the recent works
in the field of inspection of fruit and vegetables that use hyperspectral imaging. They explained the
different approaches to acquire the images and their use in the inspection of the internal and external
features.
Fernando et al. (2010) used an unsupervised method based on a Multivariate Image Analysis strategy
which uses Principal Component Analysis (PCA) to generate a reference eigenspace from a matrix
obtained by unfolding spatial and color data from defect-free peel samples. In addition, a multiresolution
concept is introduced to speed up the process. They tested about 120 samples of mandarins and oranges
from four different cultivars: Marisol, Fortune, Clemenules, and Valencia. They reported 91.5% success
ratio for individual defect detection, while 94.2% classification ratio for damaged/sound samples. Dubey,
& Jalal (2012b) and Dubey, & Jalal (2012c) proposed a method to detect and classify the fruit diseases
using image processing techniques. First of all, they detected the defected region by k-means clustering
based image segmentation technique, then extracted the features from that segmented defected region
which is used by a multi-class support vector machine for training and classification purpose.
Gabriel et al. (2013) proposed a pattern recognition method to automatically detect stem and calyx
ends and damaged blueberries. First, color and geometrical features were extracted. Second, five
7
algorithms were tested to select the best features. The best classifiers were Support Vector Machine and
Linear Discriminant Analysis. Using these classifiers, they distinguished the blueberries' orientation in
96.8% of the cases. The average performance for mechanically damaged, shriveled, and fungally decayed
blueberries were reported as 86%, 93.3%, and 97% respectively. Apple fecal contamination is an
important food safety issue. Kim et al. (2002a) detected fecal contaminated apples, by using a hyper
spectral reflectance imaging technique in conjunction with the use of PCA. They identified three visible
(VIS) to the near–infrared (NIR) and, alternatively, two NIR wavelengths for detection of apples fecal
contamination that could potentially be implemented in multispectral imaging systems. In (Kim et al.,
2002b), they also investigated that multispectral fluorescence approaches can be incorporated to detect
the fecal contamination effect on apple surfaces. In (Pujari et al., 2013a; Pujari et al., 2013b), the diseased
fruits are identified for grading of the normal fruits using BPNN classifier with color and texture based
features in RGB and YCbCr color spaces and gained nearly 88% of success rate. Recently, they also used
ANN/Knowledge base classifier to classify the powdery mildew over 6 types of fruits by combining the
color and texture features in RGB color space (Pujari et al., 2014). Kanakaraddi et al. (2014) have
computed the disease severity level of pathogenic disease in chilli fruit using only color based features
and decision tree.
Kleynen et al. (2005) developed a multi-spectral vision system in the visible/NIR range having four
wavelength bands. They classified the defects into four categories: slight, more serious, leading to the
rejection and recent bruises. A correlation pattern matching algorithm is used to detect stem-ends/calyxes.
Bayes theorem based pixel classification approach and non-parametric models of the defective and nondefective fruits are used for defect segmentation. They achieved good classification rates for apples
having serious defects and recent bruises. Based on color information, an approach is proposed to detect
‗Golden Delicious‘ apples defects (Leemans et al., 1998). In the first step, based on the variability of the
normal color a model is generated. Each pixel of an apple fruit image is compared with the model to
segment the defects. Any pixel is considered as healthy tissue, if it matches with the model. Based on a
Bayesian classification approach, a segmentation process is proposed in (Leemans et al., 1999), which
used information enclosed in a color image of a bi-color apple. The results showed that most defects,
namely bruises, bitter pit, fungi attack, scar tissue, frost damages, scab and insect attack, are segmented.
An automated bruise detection system can help the fruit industry to reduce potential economic losses
and to provide better fruit for the consumer. Lu (2003) investigated the potential of near–infrared (NIR)
hyperspectral imaging in the spectral region between 900 nm and 1700 nm for detecting bruises on
apples. They detected both new and old bruises on apples using NIR hyperspectral imaging system.
Based on a low pass Butterworth filter with a cutoff frequency D0 = 7 (i.e. the filter response will be
maximally flat for D0 < 7), a lighting transform method was developed by Li et al. (2013) to transform
the non-uniform intensity values on spherical oranges into a uniform intensity values over the whole fruit
surface. The frequency response of the Butterworth filter is maximally flat up to the cutoff
frequency and after that it starts decreasing. They found that a ratio method and R and G component
combination coupled with a big area and elongated region removal algorithm (BER) could be used to
discriminate stem-ends from defects effectively. Mehl et al. (2002) presented multispectral techniques
using hyperspectral image analysis for the detection of defects on three apple cultivars: Red Delicious,
Golden Delicious, and Gala. They performed two steps: (1) designed multispectral imaging system from
hyperspectral image analysis to characterize spectral features of apples for the specific selection of filters
and (2) multispectral imaging for fast detection of apple contaminations. They worked with 153 samples
and found good separation between normal and contaminated apples. However, separations found limited
for Red Delicious. Mehl et al. (2004) also developed a hyperspectral imaging technique for the detection
of apple surface defects and contaminations. Li et al. (2002) developed an apple surface defect sorting
experimental hardware system based on computer image technology. The hardware system can inspect
simultaneously four sides of each apple on the sorting line. They also developed the methods for image
background removal, defects segmentation and identification of stem-end and calyx areas. Their results
show that the experimental hardware system is practical and feasible. In current citrus manufacturing
industries, color and calliper are key features for the automatic classification of fruits using computer
8
vision approaches. However, human inspection is still the means to detect the flaws in the citrus surface.
A computer vision system capable of detecting defects and also classifying the type of flaws in the citrus
fruit is presented in (Lopez et al., 2011). Sobel gradient to the image is used to segment the faulty zones.
Afterwards, color and texture features are extracted considering different color spaces. They employed
several techniques for classification purpose and obtained promising results.
A synthesis segmentation algorithm is developed for the real-time online diseased strawberry images
in the greenhouse (Ouyang et al., 2013). The impact of uneven illumination is eliminated through the
―top-hat‖ transform, and noise interferences are removed by median filtering. They obtained complete
strawberry fruit area of the image after applying the methods of gray morphology, logical operation,
OTSU and mean shift segmentation. Then, they normalize the extracted eigenvalues, and used
eigenvectors of samples for training the support vector machine and BP neural network. Their Results
indicate that support vector machines have higher recognition accuracy than the BP neural network. Panli
(2012) segmented the stem by mathematical morphology method firstly; then they applied attention
selection model based on phase of the Fourier transform to extract the fruit saliency map, and fruit surface
defects are detected; finally, support vector machine is used for the classification using the color and
texture features of fruits defective part. They obtained the good classification accuracy.
Schatzki et al. (1997) has used the concept of X-ray imaging for defect detection in apples. Apples are
characterized as infected or not based on the appearance in X-ray images. Human observers inspect sets
of x-ray images for a given cultivar/orientation and the recognition rates recorded. When they viewed still
images on a computer screen, they found acceptable recognition (= 50% of defective apples recognized, =
5% of good apples classified defective). Several thresholding and classification-based approaches are
used for pixel-wise segmentation of ‗Jonagold‘ apples surface defects. Segmentation accuracy improved
when pixels are represented as a neighborhood (Unay, & Gosselin, 2006). According to the author, multilayer perceptrons are more promising than the other techniques in terms of computational expense and
segmentation accuracy. Their approach is much more precise on healthy fruit.
A fruit classification method based on a multi-class kernel support vector machine (kSVM) is
proposed in (Zhang, & Wu, 2012). A split-and-merge algorithm is used to remove the background of each
image; A feature space is composed from the extracted color histogram, texture and shape features of
each fruit image; In order to reduce the dimensions of the feature space, principal component analysis
(PCA) is used; The author constructed three kinds of multi-class SVMs, i.e., Directed Acyclic Graph
SVM, Max-Wins-Voting SVM, and Winner-Takes-All SVM. They also chose three kinds of kernels, i.e.,
Gaussian Radial Basis kernel, Homogeneous Polynomial kernel, and linear kernel. Their results show that
the Max-Wins-Voting SVM with Gaussian Radial Basis kernel reported the best classification accuracy
of 88.2%. Tian et al. (2012) presented a Multiple Classifier System (MCS) based on the support vector
machine for pattern recognition of wheat leaf diseases. Three different features including color, texture
and shape are used as training sets. Firstly, these features are classified by the low-level of MCS classifier
to different mid-level categories, which are partly described by the symptom of crop diseases. Then, from
these mid-categories produced from low-level classifiers, the mid-level features are extracted. Finally,
they trained the high-level SVMs which correct the errors made by the different feature SVMs to improve
the performance of recognition. Their approach obtained a good success rate of recognition as compared
with other classifiers for wheat leaf diseases.
3. PERFORMANCE COMPARISON
In this section, we compare the prominent surveyed methods for the fruit/fruit disease recognition system.
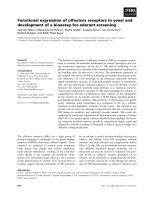
Fig. 1 shows the flow diagram which operates in two phases, training and testing. Both require some
preprocessing (i.e. image segmentation/defect segmentation and feature extraction). The system works in
three steps, in the first step fruit images will be segmented into foreground and background in the case of
fruit recognition while infected fruit part will be segmented from the diseased fruit image in the case of
fruit disease recognition. In the second step feature extraction process is carried out. In the last step a
9
Multi-class support vector machine (MSVM) will be trained and fruits and vegetables will be classified
into one of the classes or fruit diseases will be recognized using that trained MSVM.
3.1 Image Segmentation/ Defect Segmentation
Image segmentation is a convenient and effective method for detecting foreground objects in images with
stationary background. Background subtraction is a commonly used class of techniques for segmenting
objects of interest in a scene. This task has been widely studied in the literature. Background subtraction
techniques can be seen as a two-object image segmentation and, often, need to cope with illumination
variations and sensor capturing artifacts such as blur. Specular reflections, background clutter, shading
and shadows in the images are major factors which must be addressed. Therefore, in order to reduce the
scene complexity, it might be interesting to perform image segmentation focusing on the object‘s
description only. We use a background subtraction method based on K-means clustering technique
(Rocha et al., 2010). Amongst several image segmentation techniques, K-means based image
segmentation shows a trade-off between efficient segmentation and cost of segmentation. Some examples
of image segmentation are shown in figure 2.
Training Images
Test Image
Image Segmentation/
Defect Segmentation
Image Segmentation/
Defect Segmentation
Feature Extraction
Feature Extraction
Training by Multiclass SVM
Classification by Multiclass SVM
Recognized Fruit/Fruit Disease
Figure 1. Fruit/Fruit Disease Recognition System. (Dubey & Jalal, 2012a; Dubey & Jalal, 2012b)
Figure 2. Some image segmentation result on fruit and vegetable images. (Dubey & Jalal, 2013)
10
Figure 3. Some defect segmentation results on diseased fruit. (Dubey & Jalal, 2012c)
For the fruit disease classification problem, precise defect segmentation is required; otherwise the
features of the non-infected region will dominate over the features of the infected region. K-means
clustering technique is used for the defect segmentation of infected fruit images also but with three or four
clusters, whereas in fruit background subtraction only two clusters are used. In defect segmentation, using
only a single channel and two clusters are not sufficient, so here we use more than two clusters and
consider more than one channel of the color images for the precise disease segmentation. In this
experiment images are partitioned into three or four clusters in which one cluster contains the majority of
the diseased parts. The final decision of the number of clusters is done by the empirical
observation, i.e. once we defined that c number of clusters are sufficient for a particular problem
then the further processing will not required the human intervention (i.e. fully automated). In our
case, 2 and 4 number of clusters is set for the fruit classification and fruit disease classification
problem respectively according to the source papers. Figure 3 depicts some image segmentation
results using the K-mean clustering technique.
3.2 Feature Extraction
Some state-of-the-art color and texture features are extracted and used to validate the accuracy and efficiency of the system. The features used in the fruit and vegetable classification/fruit disease
identification problem are Global Color Histogram, Color Coherence Vector, Border/Interior
Classification, Local Binary Pattern, Completed Local Binary Patterns, Unser‘s Feature and Improved
Sum and Difference Histogram.
1. Global Color Histogram (GCH)
The Global Color Histogram (GCH) is the simplest approach to encode the information present in an
image (Gonzalez, & Woods, 2007). A GCH is a set of ordered values, for each distinct color, representing
the probability of a pixel being of that color. Uniform normalization and quantization are used to avoid
scaling bias and to reduce the number of distinct colors (Gonzalez & Woods, 2007).
2. Color Coherence Vector (CCV)
An approach to compare images based on color coherence vectors are presented by Pass et al., (1997).
They define color coherence as the degree to which image pixels of that color are members of a large
region with homogeneous color. These regions are referred as coherent regions. Coherent pixels are the
parts of the contiguous region, whereas incoherent pixels are not. In order to compute the CCVs, the
method blurs and discretizes the image‘s color-space to eliminate small variations between neighboring
11
pixels. Then, it finds the connected components in the image in order to classify the pixels of a given
color bucket is either coherent or incoherent. After classifying the image pixels, CCV computes two color
histograms: one for coherent pixels and another for incoherent pixels. The two histograms are stored as a
single histogram.
3. Border/Interior Classification (BIC)
In order to compute the BIC, the method classifies image pixels as border or interior. A pixel is classified
as interior if its 4-neighbors (top, bottom, left, and right) have the same quantized color. Otherwise, it is
classified as border. After the image pixels are classified, two color histograms are computed: one for
border pixels and another for interior pixels (Stehling et al. 2002).
4. Local Binary Pattern (LBP)
Given a pixel in the input image, LBP is computed by comparing it with its neighbors (Ojala, Pietikainen,
& Maenpaa, 2002):
n 1
1, x 0
LBPN ,R s(vn vc )2 n , s( x)
n 0
0, x 0
(1)
Where, vc is the value of the central pixel, vn is the value of its neighbors, R is the radius of the
neighborhood and N is the total number of neighbors. Suppose the coordinate of vc is (0, 0), then the
coordinates of vn are ( R cos(2 n / N ), R sin(2 n / N )) . The values of neighbors that are not present in the
image grids may be estimated by interpolation. Let the size of image is I*J. After the LBP code of each
pixel is computed, a histogram is created to represent the texture image:
I
J
H (k ) f ( LBPN , R (i, j ), k ), k [0, K ],
i 1 j 1
(2)
1, x y
f ( x, y )
0, otherwise
Where, K is the maximal LBP code value. In this experiment the value of ‗N‘ and ‗R‘ are set to ‗8‘
and ‗1‘ respectively to compute the LBP feature.
5. Completed Local Binary Pattern (CLBP)
LBP feature considers only signs of local differences (i.e. difference of each pixel with its neighbors)
whereas CLBP feature considers both signs (S) and magnitude (M) of local differences as well as original
center gray level (C) value (Guo, Zhang, & Zhang, 2010). CLBP feature is the combination of three
features, namely CLBP_S, CLBP_M, and CLBP_C. CLBP_S is the same as the original LBP and used to
code the sign information of local differences. CLBP_M is used to code the magnitude information of
local differences:
n 1
1, x c
CLBPN , R t (mn , c)2 n , t ( x, c)
n 0
0, x c
(3)
Where, c is a threshold and set to the mean value of the input image in this experiment. CLBP_C is used
to code the information of original center gray level value:
1, x c
CLBPN , R t ( g c , c I ), t ( x, c)
0, x c
(4)
Where, threshold cI is set to the average gray level of the input image. In this experiment the value of
‗N‘ and ‗R‘ are set to ‗8‘ and ‗1‘ respectively to compute the CLBP feature.
12
Agata Potato
Honneydew Melon
Fuji Apple
Asterix Potato
Kiwi
Onion
Cashew
Nectarine
GrannySmith Apple
Taiti Lime
Orange
Plum
Diamond Peach
Spanish Pear
Watermelon
Figure 4. Data set used in fruit and vegetable classification problem. (Dubey & Jalal, 2013)
Figure 5. Some images of scab, rot, blotch, and normal apples of dataset. (Dubey & Jalal, 2012c)
13
6. Unser’s Feature (UNSER)
In order to extract the Unser feature, first the method finds the sum and difference of intensity values over
a displacement of (d1, d2) of an image, then it calculates two histograms sum and difference histogram
and stores both histograms as a single histogram (Unser, 1986).
7. Improved Sum and Difference Histogram (ISADH)
(Dubey, & Jalal, 2013) developed an efficient Improved Sum and Difference Histogram texture feature to
encode the neighbouring information of a pixel in the image on the basis of sum and difference histogram.
They first calculated sum and difference with neighbouring pixel in x-direction and then simulated these
output in y-direction by calculating sum and difference in y-direction. By considering x and y direction
separately, the algorithm is able to encode the relation of any pixel with its neighbouring pixels in both x
and y direction very efficiently.
3.3 Training and Classification
Recently, a unified approach was presented in (Rocha et al., 2010) that can combine many features and
classifiers. The author approached the multi-class classification problem as a set of binary classification
problem in such a way one can assemble together diverse features and classifier approaches customtailored to parts of the problem. They define a class binarization as a mapping of a multi-class problem
onto two-class problems (divide-and-conquer) and referred binary classifier as a base learner. For N-class
problem N ( N 1) / 2 binary classifiers will be needed where N is the number of different classes.
According to the author, the ijth binary classifier uses the patterns of class i as positive and the patterns of
class j as negative. They calculate the minimum distance of the generated vector (binary outcomes) to the
binary pattern (ID) representing each class, in order to find the final outcome. Test case will belong to that
class for which the distance between ID of that class and binary outcomes will be minimum.
Table 1. Unique ID of each class
x
y
z
xy
+1
-1
0
xz
+1
0
-1
yz
0
+1
-1
Their approach can be understood by a simple three class problem. Let three classes are x, y, and z.
Three binary classifiers consisting of two classes each (i.e., xy, xz, and yz) will be used as base learners,
and each binary classifier will be trained with training images. Each class will receive a unique ID as
shown in Table 1. To populate the table is straightforward. First, we perform the binary comparison xy
and tag the class x with the outcome +1, the class y with −1 and set the remaining entries in that column to
0. Thereafter, we repeat the procedure comparing xz, tag the class x with +1, the class z with −1, and the
remaining entries in that column with 0. In the last, we repeat this procedure for binary classifier yz, and
tag the class y with +1, the class z with -1, and set the remaining entries with 0 in that column, where the
entry 0 means a ―Don‘t care‖ value. Finally, each row represents unique ID of that class (e.g., y [1, +1,
0]). Each binary classifier results a binary response for any input example. Let‘s say if the outcomes for the
binary classifier xy, xz, and yz are +1, -1, and +1 respectively then the input example will belongs to
that class which have the minimum distance from the vector [+1, -1, +1]. So the final answer will be given
by the minimum distance of
min dist 1, 1, 1 , 1, 1,0 , 1,0, 1 , 0, 1, 1
We have used Multi-class Support Vector Machine (MSVM) as a set of binary Support Vector
Machines (SVMs) for the training and classification in both problems.
14
3.4 Reported Results
To demonstrate the performance of the system, a supermarket data set of fruits and vegetables are used,
which comprises 15 different categories: Plum(264), Agata Potato(201), Asterix Potato(181),
Cashew(210), Onion(75), Orange(103), Taiti Lime(104), Kiwi(157), Fuji Apple(212), Granny-smith
Apple(155), Watermelon(192), Honeydew Melon(145), Nectarine(247), Spanish Pear(158), and Diamond
Peach(211): totaling 2615 images. Figure 4 depicts the classes of the data set. The data set contains fruit
images under different lighting conditions with variability in the number of elements in an image. It
also contains the pose differences among the fruits and cropping and partial occlusion. The presence
of these features makes the data set more realistic. A data set of diseased apple fruits are also
considered, which comprises four different categories: Apple Blotch (104), Apple rot (107), Apple scab
(100), and Normal Apples (80): totaling 391 images. Figure 5 depicts the classes of the data set. The
presence of a lot of variations in the type and color of apple makes the data set more realistic. In the
experiment, different number of images per class is used for the training purpose. The average error is
computed by calculating the sum of the average error of each class divided by the total number of classes.
Figure 6 shows the average error for the fruit and vegetable classification for different features in both
RGB and HSV color spaces while Figure 7 represents the average diseased apple fruit classification
accuracy. The x-axis represents the number of images per class for the training and y-axis represents the
average error/average accuracy. The result illustrates that the Global Color Histogram (GCH) has the
highest average error in Figure 6 and lower average accuracy in Figure 7 for both RGB and HSV color
images because, it has only the color information and it does not consider the relation among the
neighboring pixels.
The average error for the Color Coherence Vector (CCV) is less than the average error for the GCH
feature in Figure 6 and average accuracy of CCV is better than GCH in Figure 7 because CCV feature
exploits the concept of coherent and incoherent regions. Border/Interior Classification (BIC) feature has
low average classification error than the CCV feature because BIC feature takes the values of 4neighboring pixel into account. UNSER feature has the lower average classification error than GCH,
CCV, and BIC and higher classification than GCH and CCV as shown in Figure 6. For instance, the
reported error for fruit and vegetable classification in RGB color space is 9.43%, 7.58%, 5.84%, 5.65%,
and 4.56% for GCH, CCV, BIC, UNSER, and ISADH feature respectively while MSVM is trained with
60 images per fruit/vegetable. LBP feature in Figure 7 performs better than GCH and CCV because LBP
incorporates the neighboring information in a rotation invariant manner. From Figure 7, CLBP (a
generalized version of LBP) performs very well in both the color spaces. It is also observed across the
plots that each feature performs better in the HSV color space than the RGB color space. For ISADH
feature with 60 training examples per class, the reported classification error is 4.56% in RGB and 1.48%
in HSV of fruit and vegetable classification. Figure 6 illustrates that the ISADH texture feature
outperforms the other features because ISADH feature uses the neighboring information of x-direction
with the neighboring information about y-direction. It is also pointed out that, for disease recognition
problem CLBP is a better choice.
25
GCH_RGB
CCV_RGB
BIC_RGB
UNSER_RGB
ISADH_RGB
20
15
10
Average error(%)
Average error(%)
25
5
0
20
25
30
35
40
45
50
Training examples per class
55
60
GCH_HSV
CCV_HSV
BIC_HSV
UNSER_HSV
ISADH_HSV
20
15
10
5
0
20
25
30
35
40
45
50
55
60
Training examples per class
Figure 6. Average fruit and vegetable classification error by using GCH, CCV, BIC, UNSER, and ISADH
features considering MSVM as a base learner in RGB and HSV color spaces. (Dubey & Jalal, 2013)
15
100
100
90
90
80
70
GCH_RGB
CCV_RGB
LBP_RGB
CLBP_RGB
60
50
10
15
20
25
30
35
40
Training Examples per Class
45
50
Accurcy (%)
Accuracy (%)
We also shown the comparison made to depict the performance of SVM and KNN classifiers using
ISADH texture features in both RGB and HSV color spaces. In Figure 8, the comparison is illustrated for
the fruit and vegetable classification problem. In Figure 9, the results are compared for the fruit disease
recognition problem. The value K is considered as one in the source paper. It is observed across the plots
that the performance using SVM classifier is better as compared to the well known KNN classifier in both
RGB and HSV classifier. From the above reported results from various research papers, we can say that
ISADH texture feature better suited with MSVM in both RGB and HSV color spaces to solve the both
kinds of problem stated in this review paper.
80
70
GCH_HSV
CCV_HSV
LBP_HSV
CLBP_HSV
60
50
10
15
20
25
30
35
40
Training examples per class
45
50
Figure 7. Apple fruit disease average classification accuracy by using GCH, CCV, LBP, and CLBP
feature considering MSVM as a base learner in RGB and HSV color spaces. (Dubey & Jalal, 2012c)
classification Accuracy (%)
100
95
90
85
ISADH_SVM_RGB
ISADH_KNN_RGB
ISADH_SVM_HSV
ISADH_KNN_HSV
80
75
70
20
25
30
35
40
45
50
Number of Training Examples per Class
55
60
Figure 8. Comparison of SVM and KNN classifier using ISADH texture feature in RGB and HSV color
spaces for fruit and vegetable classification problem (Dubey & Jalal, 2013)
Average Accuracy (%)
100
80
60
ISADH_SVM_RGB
ISADH_KNN_RGB
ISADH_SVM_HSV
ISADH_KNN_HSV
40
20
26
31
36
41
46
51
56
61
67
Number of Training Examples per Class (%)
Figure 9. Comparison of SVM and KNN classifier using ISADH texture feature in RGB and HSV color
spaces for fruit disease recognition problem (Dubey & Jalal, 2014)
16
3.5 Comparison among existing methods
We also compared the performance of different approaches reported in the literature in Table 2 and
Table 3 to solve the fruit and vegetable classification and fruit disease recognition problem respectively.
The comparisons are made on the basis of the number of categories in the database, pre-processing steps
involved, features extracted, color space used, classifiers used, and accuracy achieved.
Table 2. Comparison with existing fruit and vegetable classification methods
Reference
Data set
PreProcessing
Features
Color
Space
Training
Evaluation
Criteria
Average
Accuracy
Dubey & Jalal
(2013)
15
categories
K-means with
2 clusters
ISADH
HSV
Multiclass
SVM
Accuracy
99%
Rocha et al.
(2010)
15
categories
K-means with
2 clusters
GCH+CCV+BIC+Unser (Fusion)
HSV
Multiclass
SVM
Average
Error
97%
Arivazhagan
et al. (2010)
15
categories
Cropping
Co-occurrence features such as
contrast, energy, local homogeneity,
cluster shade and cluster
prominence
HSV
Minimum
distance
classifier
Recognition
rate
86%
Chowdhury et
al. (2013)
10
categories
-
Color Histogram +Texure
HSV
Neural
networks
Accuracy
96.55%
Faria et al.
(2012)
15
categories
K-means with
2 clusters
Color, Texture and Shape
HSV
Classifier
Fusion
Accuracy
98.8% ±
0.9
Danti et al.
(2012)
10
categories
Cropping and
resizing
Mean and range of Hue and
Saturation
HSV
BPNN
Classifier
Accuracy
96.40%
Suresha et al.
(2012)
8
categories
Watershed
segmentation
Texture fearures
RGB
Decisiontree
classifier
Accuracy
95%
Table 3. Comparison of existing methods for fruit disease recognition
Reference
Data set
Pre-Processing
Features
Color
Space
Training
Evaluation
Criteria
Average
Accuracy
Dubey &
Jalal (2014)
4 categories
K-means with 3
and 4 clusters
ISADH +
Gradient filters
HSV
Multiclass SVM +
KNN
Accuracy
and AUC
>99%
Pujari et al.
(2013a)
2 categories Normal and
affected
anthracnose fruit
types
K-means
Texture features
RGB
BPNN Classifier
Accuracy
84.65%
for normal type
and 76.6% for
anthracnose
affected type
Pujari et al.
(2013b)
2 categories Normal and
affected fruit
types
-
Color
features+GLCM
YCbCr
BPNN Classifier
Accuracy
89.15%
for
normal
type
88.58% for
affected type
Pujari et al.
(2014)
6 categories
Shade
correction,
Removing
artifacts and
Formatting
Color+Texture
features
RGB
ANN/Knowledge
base Classifier
Accuracy
87.80%
Kim et al.
(2009)
6 categories
ROI Cropping
Intensity texture
features
HSV
Discriminant
Analysis
Accuracy
96%
Pydipati et al.
(2006)
4 categories
Edge detection
Color cooccurrence
methods
HSV
Generalized
Squared Distance
Accuracy
>95%
Kanakaraddi
et al. (2014)
4 categories
Median
filtering
Color features
RGB
Decision tree
Disease
severity
-
17
4. CONCLUSION
This paper basically reviewed the advancement of the information and communication technology in the
field of agriculture and food industry. Several computer vision and image processing approaches used in
the field of agriculture and food industry for fruit/vegetable classification and fruit disease classification is
explored in this paper. Most of the work in this field using image processing is composed of the mainly
three main steps (1) background subtraction, (2) feature extraction, and (3) training and classification. An
image processing based solution is also explored from the published literature for automatic
fruit/vegetable recognition and classification and automatic detection and recognition of fruit diseases
from images using color and texture features. This approach is composed of three steps: in the first step
image segmentation/defect segmentation is carried out using K-Means clustering method, in the second
step features are extracted from the segmented image/defected region, and finally in the third step images
are classified into one of the classes of fruit/fruit diseases. 15 types of fruits or vegetables and three types
of apple diseases are used for the evaluation purpose. Based on the reported results, around 1% average
classification error is detected for fruit and vegetable classification and around 3% average classification
error is reported for fruit disease classification.
In the current work of fruit and vegetable classification and fruit disease recognition, only a single type
of fruit and a single type of disease is present in the fruit or an infected fruit image. In the future, we will
extend our work fruit and vegetable classification such that we can also identify the fruits and vegetables
if more than one type is present in a single image. We may also try to identify all the diseases in the fruit
if more than one disease is present in the image. The other future work includes the implementation of
such systems in real life scenarios. Consideration of the shape feature with the color and texture features
may also improve the classification accuracy.
REFERENCES
Arivazhagan, S., Shebiah, R. N., Nidhyanandhan, S. S., & Ganesan, L. (2010). Fruit recognition using
color and texture features. Journal of Emerging Trends in Computing and Information
Sciences, 1(2), 90-94.
Arefi, A., Motlagh, A. M., Mollazade, K., & Teimourlou, R. F. (2011). Recognition and localization
of ripen tomato based on machine vision. Asian Journal of Crop Sciences, 5(10), 1144-1149.
Bennedsen, B. S., & Peterson, D. L. (2005). Performance of a system for apple surface defect
identification in near-infrared images. Biosystems Engineering, 90(4), 419–431.
Bennedsen, B. S., Peterson, D. L., & Tabb, A. (2005). Identifying defects in images of rotating apples.
Computers and Electronics in Agriculture, 48(2), 92–102.
Bolle, R. M., Connell, J. H., Haas, N., Mohan, R., & Taubin, G. (1996). Veggievision: A Produce
Recognition System. In Proceedings of the 3rd IEEE Workshop on Applications of Computer
Vision (pp. 1-8), Sarasota, USA.
Brosnan, T., & Sun, D. -W. (2002). Inspection and grading of agricultural and food products by
computer vision systems - a review. Computers and Electronics in Agriculture, 36(2-3), 193–213.
Brosnan, T., & Sun, D. -W. (2004). Improving quality inspection of food products by computer vision
– a review, Journal of Food Engineering, 61(1), 3–16.
Bulanon, D. M., Burks, T. F., & Alchanatis, V. (2008). Study of temporal variation in citrus canopy
using thermal imaging for citrus fruit detection. Biosystems Engineering, 101(2), 161-171.
Bulanon D.M., Burks T.F., & Alchanatis V. (2009a). Image Fusion of visible and thermal images for
fruit detection. Biosystems Engineering, 103(1), 12-22.
18
Bulanon, D. M., Burks, T. F. & Alchanatis, V. (2009b). Improving fruit detection for robotic fruit
harvesting. ISHS Acta Horticulturae 824: International Symposium on Application of Precision
Agriculture for Fruits and Vegetables (pp. 329-336).
Chowdhury, M. T., Alam, M. S., Hasan, M. A., & Khan, M. I. (2013). Vegetables detection from the
glossary shop for the blind. IOSR Journal of Electrical and Electronics Engineering, 8(3), 43-53.
Crowe, T. G., & Delwiche, M. J. (1996a). Real-time defect detection in fruit - part I: Design concepts
and development of protoype hardware, Transactions of American Society of Agricultural and
Biological Engineers, 39(6), 2299–2308.
Crowe, T. G., & Delwiche, M. J. (1996b). Real-time defect detection in fruit - part II: An algorithm
and performance of a protoype system, Transactions of American Society of Agricultural and
Biological Engineers, 39(6), 2309–2317.
Danti, A., Madgi, M., & Anami, B. S. (2012). Mean and range color features based identification of
common Indian leafy vegetables. Int J Signal Process Image Process Pattern Recogn, 5(3), 151160.
Dale, L. M., Thewis, A., Boudry, C., Rotar, I., Dardenne, P., Baeten, V., & Piernac, J. A. F. (2013).
Hyperspectral Imaging Applications in Agriculture and Agro-Food Product Quality and Safety
Control: A Review. Applied Spectroscopy Reviews, 48(2), 142-159.
Dubey, S. R. (2012). Automatic Recognition of Fruits and Vegetables and Detection of Fruit Diseases.
Unpublished master‘s theses, GLA University Mathura, India.
Dubey, S. R., & Jalal, A. S. (2012a). Robust Approach for Fruit and Vegetable Classification.
Procedia Engineering, 38, 3449 – 3453.
Dubey, S. R., & Jalal, A. S. (2012b). Detection and Classification of Apple Fruit Diseases using
Complete Local Binary Patterns. In Proceedings of the 3rd International Conference on Computer
and Communication Technology (pp. 346-351), MNNIT Allahabad, India.
Dubey, S. R., & Jalal, A. S. (2012c). Adapted Approach for Fruit Disease Identification using Images.
International Journal of Computer Vision and Image Processing, 2(3), 51 – 65.
Dubey, S. R., & Jalal, A. S. (2013). Species and Variety Detection of Fruits and Vegetables from
Images. International Journal of Applied Pattern Recognition, 1(1), 108 – 126.
Dubey, S. R., & Jalal, A. S. (2014). Fruit Disease Recognition using Improved Sum and Difference
Histogram from Images. International Journal of Applied Pattern Recognition, 1(2), 199 - 220.
Faria, F. A., dos Santos, J. A., Rocha, A., & Torres, R. S. (2012). Automatic classifier fusion for
produce recognition. In Proceeding of 25th SIBGRAPI Conference on Graphics, Patterns and
Images (pp. 152-259).
Fernando, L. -G., Gabriela, A. –G., Blasco, J., Aleixos, N., & Valiente, J. –M. (2010). Automatic
detection of skin defects in citrus fruits using a multivariate image analysis approach. Computers
and Electronics in Agriculture. 71(2), 189-197.
Gabriel, A. L. V., & Aguilera, J. M. (2013). Automatic detection of orientation and diseases in
blueberries using image analysis to improve their postharvest storage quality. Food Control, 33(1),
166–173.
Gonzalez, R., & Woods, R. (2007). Digital Image Processing, 3rd edition, Prentice-Hall.
Guo, Z., Zhang, L., & Zhang, D. (2010). A Completed Modeling of Local Binary Pattern Operator for
Texture Classification. IEEE Transactions on Image Processing, 19(6), 1657-1663.
Haidar, A., Dong, H., & Mavridis, N. (2012). Image-based date fruit classification. In Proceedings of
the 4th International Congress on Ultra Modern Telecommunications and Control Systems and
Workshops (pp.357-363).
19
Hartman, J. (2010). Apple Fruit Diseases Appearing at Harvest. Plant Pathology Fact Sheet, College
of Agriculture, University of Kentucky. Retrieved December, 2012, from
/>Jimenez, R., Jain, A. K., Ceres, R., & Pons, J. L. (1999). Automatic fruit recognition: A survey and
new results using Range/Attenuation images. Pattern Recognition, 32 (10), 1719-1736.
Kanakaraddi, S., Iliger, P., Gaonkar, A., Alagoudar, M., Prakash A., (2014). Analysis and Grading of
Pathogenic Disease of Chilli Fruit using Image Processing. In Proceedings of the International
Conference on Advances in Engineering & Technology (pp. 46-50).
Kim, D. G., Burks, T. F., Qin, J., & Bulanon, D. M. (2009). Classification of grapefruit peel diseases
using color texture feature analysis. International Journal of Agricultural and Biological
Engineering, 2(3), 41-50.
Kim, M. S., Lefcourt, A. M., Chao, K., Chen, Y. R., Kim, I., & Chan, D.E. (2002a). Multispectral
detection of fecal contamination on apples based on hyperspectral imagery: Part I. application of
visible and near-infrared reflectance imaging. Transactions of American Society of Agricultural
Engineers, 45(6), 2027–2037.
Kim, M. S., Lefcourt, A. M., Chen, Y. R., Kim, I., Chan, D. E., & Chao, K. (2002b). Multispectral
detection of fecal contamination on apples based on hyperspectral imagery: Part II. Application of
hyperspectral fluorescence imaging. Transactions of American Society of Agricultural Engineers,
45(6), 2039–2047.
Kleynen, O., Leemans, V., & Destain, M. -F. (2005). Development of a multi-spectral vision system
for the detection of defects on apples. Journal of Food Engineering, 69(1), 41–49.
Leemans, V., Magein, H., & Destain, M. -F., (1998). Defect segmentation on ‗golden delicious‘ apples
by using colour machine vision. Computers and Electronics in Agriculture, 20(2), 117–130.
Leemans, V., Magein, H., & Destain, M. -F., (1999). Defect segmentation on ‗jonagold‘ apples using
colour vision and a bayesian classification method. Computers and Electronics in Agriculture,
23(1), 43–53.
Li, Q., Wang, M., & Gu, W. (2002). Computer Vision Based System for Apple Surface Defect
Detection. Computers and Electronics in Agriculture, 36(2-3), 215-223.
Li, J., Rao, X., Wang, F., Wu, W., & Ying, Y. (2013). Automatic detection of common surface defects
on oranges using combined lighting transform and image ratio methods. Postharvest Biology and
Technology, 82, 59–69.
Lino, A. C. L., Sanches, J., & Fabbro, I. M. D. (2008). Image processing techniques for lemons and
tomatoes classification. Bragantia, 67(3), 785-789.
Liu, Y., Chen, B., & Qiao, J. (2011). Development of a machine vision algorithm for recognition of
peach fruit in natural scene. Transactions of American Society of Agricultural and Biological
Engineers, 54(2), 695-702.
Lopez, J. J., Maximo, C. & Emanuel, A. (2011). Computer-based detection and classification of flaws
in citrus fruits. Neural Computing and Applications, 20(7), 975-981.
Lorente, D., Aleixos, N., Gómez-Sanchis, J., Cubero, S., García-Navarrete, O. L., & Blasco, J. (2012).
Recent Advances and Applications of Hyperspectral Imaging for Fruit and Vegetable Quality
Assessment. Food and Bioprocess Technology, 5(4), 1121-1142.
Lu, R. (2003). Detection of bruises on apples using near-infrared hyperspectral imaging. Transactions
of American Society of Agricultural Engineers, 46(2), 523–530.
Mehl, P. M., Chao, K., Kim, M., & Chen, Y. R. (2002). Detection of defects on selected apple
cultivars using hyperspectral and multispectral image analysis. Applied Engineering in Agriculture,
18(2), 219–226.
20
Mehl, P. M., Chen, Y. -R., Kim, M. S., & Chen, D.E. (2004). Development of hyperspectral imaging
technique for the detection of apple surface defects and contaminations. Journal of Food
Engineering, 61(1), 67–81.
Ojala, T., Pietikäinen, M., & Mäenpää, T. T. (2002). Multiresolution Gray-Scale and Rotation
Invariant Texture Classification with Local Binary Pattern. IEEE Transactions on Pattern Analysis
and Machine Intelligence, 24(7), 971-987.
Ouyang, C., Li, D., Wang, J., Wang, S., & Han, Y. (2013). The Research of the Strawberry Disease
Identification Based on Image Processing and Pattern Recognition. Computer and Computing
Technologies in Agriculture VI, 392, 69-77.
Panli, H. E. (2012). Fruit Surface Defects Detection and Classification Based on Attention Model.
Journal of Computational Information Systems, 8(10), 4233–4240.
Pass, G., Zabih, R., & Miller, J. (1997). Comparing Images Using Color Coherence Vectors. In
Proceedings of the ACM Multimedia (pp. 1-14).
Patel, H. N., Jain, R. K., & Joshi, M. V. (2011). Fruit Detection using Improved Multiple Features
based Algorithm. International Journal of Computer Applications 13(2), 1–5.
Patrasa, A., Bruntona, N. P., Downeya, G., Rawsona, A., Warrinerb, K., & Gernigonc, G. (2011).
Application of principal component and hierarchical cluster analysis to classify fruits and
vegetables commonly consumed in Ireland based on in vitro antioxidant activity. Journal of Food
Composition and Analysis, 24(2), 250–256.
Pujari, J. D., Yakkundimath, R., & Byadgi, A. S. (2013a). Grading and classification of anthracnose
fungal disease of fruits based on statistical texture features. International Journal of Advanced
Science and Technology, 52.
Pujari, J. D., Yakkundimath, R., & Byadgi, A. S. (2013b). Reduced Color and Texture features based
Identification and Classification of Affected and Normal fruits‘ images. International Journal of
Agricultural and Food Science, 3(3), 119-127.
Pujari, J. D., Yakkundimath, R., & Byadgi, A. S. Recognition and classification of Produce affected
by identically looking Powdery Mildew disease. Acta Technologica Agriculturae, 17(2), 29-34.
Pydipati, R., Burks, T. F., & Lee, W. S. (2006). Identification of citrus disease using color texture
features and discriminant analysis. Computers and electronics in agriculture, 52(1), 49-59.
Qin, J., Burks, F., Ritenour, M. A., & Bonn, W. G. (2009). Detection of Citrus Canker using HyperSpectral Reflectance Imaging with Spectral Information Divergence. Journal of Food Engineering,
93(2), 183-191.
Rahman, M. H., Pickering, M. R., Kerr, D., Boushey, C. J., & Delp, E. J. (2012). A New Texture
Feature for Improved Food Recognition Accuracy in a Mobile Phone Based Dietary Assessment
System. In Proceedings of the IEEE International Conference on Multimedia and Expo Workshops
(pp. 418-423).
Roberts, M. J., Schimmelpfennig, D., Ashley, E., & Livingston, M. (2006). The Value of Plant
Disease Early-Warning Systems: A Case Study of USDA‘s Soybean Rust Coordinated Framework.
Economic Research Service, 18, United States Department of Agriculture. Retrieved December,
2011, from />Rocha, A., Hauagge, C., Wainer, J., & Siome, D. (2010). Automatic Fruit and Vegetable Classification
from Images. Computers and Electronics in Agriculture, 70(1), 96-104.
Schatzki, T. F., Haff, R. P., Young, R., Can, I., Le, L. -C., & Toyofuku, N. (1997). Defect detection in
apples by means of x-ray imaging. Transactions of American Society of Agricultural Engineers,
40(5), 1407–1415.
Seng, W. C., & Mirisaee, S.H. (2009). A new method for fruits recognition system. In Proceedings of
International Conference on Electrical Engineering and Informatics (pp. 130-134).
21
Stehling, R., Nascimento, M., & Falcao, A. (2002). A Compact and Efficient Image Retrieval
Approach Based on Border/Interior Pixel Classification. In Proceedings of the ACM Conference on
Information and Knowledge Management (pp. 102-109).
Suresha, M., Sandeep Kumar, K. S., & Shiva Kumar, G. (2012). Texture Features and Decision Trees
based Vegetables Classification. IJCA Proceedings on National Conferecne on Advanced
Computing and Communications (pp. 21-26).
Tian, Y., Zhao, C., Lu, S., & Guo, X. (2012). SVM-based Multiple Classifier System for recognition
of wheat leaf diseases. In Proceedings of the World Automation Congress (pp. 189-193).
Unay, D., & Gosselin, B. (2006). Automatic defect detection of ‗jonagold‘ apples on multi-spectral
images: A comparative study. Postharvest Biology and Technology, 42, (271-279).
Unser, M. (1986). Sum and Difference Histograms for Texture Classification. IEEE Transactions on
Pattern Analysis and Machine Intelligence, 8(1), 118-125.
Vadivambal, R., & Jayas, D. S. (2011). Applications of Thermal Imaging in Agriculture and Food
Industry—A Review. Food and Bioprocess Technology, 4(2), 186-199.
Zhang, Y., & Wu, L. (2012). Classification of fruits using computer vision and a multiclass support
vector machine. Sensors, 12(9), 489-505.
View publication stats