Financial managerial accounting 3rd kieso ch23(budgetary control and planning)
Bạn đang xem bản rút gọn của tài liệu. Xem và tải ngay bản đầy đủ của tài liệu tại đây (875.23 KB, 84 trang )
Financial & Managerial Accounting
rd
3 Edition
Weygandt Kimmel Kieso
Chapter 23
Budgetary Control and
Responsibility Accounting
Chapter Outline
Learning Objectives
LO 1
Describe budgetary control and static budget reports.
LO 2
Prepare flexible budget reports.
LO 3
Apply responsibility accounting to cost and profit centers.
LO 4
Evaluate performance in investment centers.
Copyright ©2018 John Wiley & Son, Inc.
2
Budgetary Control and Static Budget Reports
Use of budgets in controlling operations is known as budgetary control.
a.
Budget reports compare actual results with planned objectives
b.
Provides management with feedback on operations
c.
Budget reports prepared as frequently as needed
d.
Management analyzes differences between actual and planned results and determines
causes
LO 1
Copyright ©2018 John Wiley & Son, Inc.
3
Budgetary Control
Develop budget
Analyze differences
between actual and budget
Take corrective action
Modify future plans
ILLUSTRATION 23.1
Budgetary control activities
LO 1
Copyright ©2018 John Wiley & Son, Inc.
4
Budgetary Control
Works best when a company has a formalized reporting system which:
LO 1
1.
Identifies the name of the budget report
2.
States the frequency of the report
3.
Specifies the purpose of the report
4.
Indicates the primary recipient(s) of the report
Copyright ©2018 John Wiley & Son, Inc.
5
Budgetary Control
Name of Report
ILLUSTRATION 23.2
Budgetary control reporting system
Frequency
Purpose
Primary Recipient(s)
Sales
Weekly
Determine whether sales goals are met
Top management and sales manager
Labor
Weekly
Control direct and indirect labor costs
Vice president of production and production
department managers
Scrap
Daily
Determine efficient use of materials
Production manager
Departmental overhead costs
Weekly
Control overhead costs
Department manager
Selling expenses
Monthly
Control selling expenses
Sales manager
Income statement
Monthly and quarterly
Determine whether income goals are met
Top management
LO 1
Copyright ©2018 John Wiley & Son, Inc.
6
Budgetary Control
Budgetary control involves all but one of the following:
LO 1
a.
Modifying future plans
b.
Analyzing differences
c.
Using static budgets
d.
Determining differences between actual and planned results
Copyright ©2018 John Wiley & Son, Inc.
7
Static Budget Reports
A Static budget is a projection of budget data at one level of activity
a.
When used in budgetary control, each budget included in the master budget is considered
to be static
LO 1
b.
Ignores data for different levels of activity
c.
Compares actual results with budget data at the activity level used in the master budget
Copyright ©2018 John Wiley & Son, Inc.
8
Static Budget Reports
Illustration: Budget and actual sales data for the Rightride product in the first and second
quarters of 2020 are as follows.
Sales
Budgeted
Actual
Difference
First
Second
Quarter
Quarter
Total
$180,000
$210,000
$390,000
179,000
199,500
378,500
$ 1,000
$ 10,500
$ 11,500
ILLUSTRATION 23.3
Budget and actual sales data
LO 1
Copyright ©2018 John Wiley & Son, Inc.
9
ILLUSTRATION 23.3
Static Budget Reports
Sales
Budgeted
Actual
Difference
Budget and actual sales data
First
Second
Quarter
Quarter
Total
$180,000
$210,000
$390,000
179,000
199,500
378,500
$ 1,000
$ 10,500
$ 11,500
Sales Budget Report
ILLUSTRATION 23.4
For the Quarter Ended March 31, 2020
Difference
Favorable F
Product Line
Rightride
LO 1
Budget
Actual
$180,000
Copyright ©2018 John Wiley & Son, Inc.
$179,000
Unfavorable U
$1,000 U
10
ILLUSTRATION 23.3
Static Budget Reports
Sales
Budgeted
Budget and actual sales data
First
Second
Quarter
Quarter
$180,000
$210,000
$390,000
179,000
199,500
378,500
$ 1,000
$ 10,500
$ 11,500
Actual
Difference
Total
Sales Budget Report
ILLUSTRATION 23.5
For the Quarter Ended June 30, 2020
Second Quarter
Product Line
Rightride
LO 1
Budget
$210,000
Actual
$199,500
Year-to-Date
Difference
Difference
Favorable F
Favorable F
Unfavorable U
$10,500 U
Copyright ©2018 John Wiley & Son, Inc.
Budget
$390,000
Actual
$378,500
Unfavorable U
$11,500 U
11
Static Budget Reports
Uses and Limitations
Appropriate for evaluating a manager’s effectiveness in controlling costs when:
.
Actual level of activity closely approximates master budget activity level, and/or
.
Behavior of costs is fixed in response to changes in activity
Appropriate for fixed costs
Not appropriate for variable costs
LO 1
Copyright ©2018 John Wiley & Son, Inc.
12
Static Budget Reports
A static budget is useful in controlling costs when cost behavior is:
LO 1
a.
Mixed
b.
Fixed
c.
Variable
d.
Linear
Copyright ©2018 John Wiley & Son, Inc.
13
DO IT! 1 Static Budget Reports (1 of 2)
Lawler Company expects to produce 5,000 units of product CV93 during the current month. Budgeted
variable manufacturing costs per unit are direct materials $6, direct labor $15, and overhead $24. Monthly
budgeted fixed manufacturing overhead costs are $10,000 for depreciation and $5,000 for supervision. In
the current month, Lawler actually produced 5,500 units and incurred the following costs: direct materials
$33,900, direct labor $74,200, variable overhead $120,500, depreciation $10,000, and supervision $5,000.
Prepare a static budget report.
LO 1
Copyright ©2018 John Wiley & Son, Inc.
14
DO IT! 1 Static Budget Reports (2 of 2)
Difference
Favorable - F
Budget
Actual
Unfavorable - U
5,000
5,500
$ 30,000
$ 33,900
$ 3,900
U
75,000
74,200
800
F
Overhead ($24)
120,000
120,500
500
U
Total variable costs
225,000
228,600
3,600
U
Depreciation
10,000
10,000
0
Supervision
5,000
5,000
0
15,000
15,000
0
$240,000
$243,600
$ 3,600
Production in units
Variable costs
Direct materials ($6)
Direct labor ($15)
Fixed costs
Total fixed costs
Total costs
LO 1
Copyright ©2018 John Wiley & Son, Inc.
U
15
Flexible Budget Reports
Flexible budget projects budget data for various levels of activity.
LO 2
a.
Essentially a series of static budgets at different activity levels
b.
Budgetary process more useful if it is adaptable to changes in operating conditions
c.
Can be prepared for each type of budget in the master budget
Copyright ©2018 John Wiley & Son, Inc.
16
Why Flexible Budgets?
Illustration: Barton Robotics static overhead budget.
Manufacturing Overhead Budget (Static)
Assembly Department
For the Year Ended December 31, 2020
Budgeted production in units (robotic controls)
10,000
Budgeted costs
Indirect materials
$ 250,000
Indirect labor
260,000
Utilities
190,000
Depreciation
280,000
Property taxes
70,000
Supervision
50,000
$1,100,000
ILLUSTRATION 23.6
LO 2
Copyright ©2018 John Wiley & Son, Inc.
17
Why Flexible Budgets?
Overhead Static Budget report assuming 12,000 units were actually produced, rather than 10,000 units.
Difference
Favorable - F
ILLUSTRATION 23.7
Budget
Actual
Unfavorable - U
10,000
12,000
$ 250,000
$ 295,000
$ 45,000
U
Indirect labor
260,000
312,000
52,000
U
Utilities
190,000
225,000
35,000
U
Depreciation
280,000
280,000
0
Property taxes
70,000
70,000
0
Supervision
50,000
50,000
0
$1,100,000
$1,232,000
$132,000
Production in units
Costs
Indirect materials
LO 2
Copyright ©2018 John Wiley & Son, Inc.
U
18
Why Flexible Budgets?
Over budget in three of six overhead costs
Unfavorable difference of $132,000 – 12% over budget
Budget data for 10,000 units, not relevant
Meaningless to compare actual variable costs for 12,000 units with budgeted variable
costs for 10,000 units
LO 2
Variable cost increase with production
Copyright ©2018 John Wiley & Son, Inc.
19
Why Flexible Budgets?
Analyzing budget data for costs at 10,000 units, you arrive at the following per unit results.
Item
Indirect materials
Total Cost
Per Unit
$250,000
$25
Indirect labor
260,000
26
Utilities
190,000
19
$700,000
$70
ILLUSTRATION 23.8
Variable costs per unit
ILLUSTRATION 23.9
Item
Indirect materials
Indirect labor
Utilities
LO 2
Computation
Total
$25 x 12,000
$300,000
26 x 12,000
312,000
19 x 12,000
228,000
Copyright ©2018 John Wiley & Son, Inc.
Budgeted variable costs, 12,000 units
20
$840,000
Prepare the budget report based on the flexible budget for 12,000 units
of production.
ILLUSTRATION 23.10
Overhead flexible budget report
Difference
Favorable - F
Budget
Actual
Unfavorable - U
12,000
12,000
$ 300,000
$ 295,000
$ 5,000
Indirect labor ($26)
312,000
312,000
0
Utilities ($19)
228,000
225,000
3,000
F
Total variable costs
840,000
832,000
8,000
F
280,000
280,000
0
Property taxes
70,000
70,000
0
Supervision
70,000
50,000
0
400,000
400,000
0
$1,240,000
$1,232,000
$ 8,000
Production in units
Variable costs
Indirect materials ($25)
F
Fixed costs
Depreciation
Total fixed costs
Total costs
LO 2
Copyright ©2018 John Wiley & Son, Inc.
F
21
Developing the Flexible Budget
1.
Identify activity index and relevant range of activity
2.
Identify variable costs, and determine budgeted variable cost per unit of activity for
each cost
LO 2
3.
Identify fixed costs, and determine budgeted amount for each cost
4.
Prepare budget for selected increments of activity within relevant range
Copyright ©2018 John Wiley & Son, Inc.
22
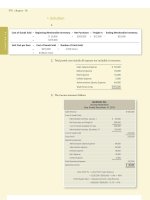
Flexible Budget—A Case Study (1 of 7)
Fox Company’s management uses a flexible budget for monthly comparisons of actual and budgeted manufacturing
overhead costs of the Finishing Department. The master budget for the year ending December 31, 2020, shows
expected annual operating capacity of 120,000 direct labor hours and the overhead costs.
Variable Costs
Indirect materials
Indirect labor
Utilities
Fixed Costs
$180,000
Depreciation
$180,000
240,000
Supervision
120,000
60,000
Total
$480,000
Property taxes
Total
60,000
$360,000
ILLUSTRATION 23.11
LO 2
Master budget data
Copyright ©2018 John Wiley & Son, Inc.
23
Flexible Budget—A Case Study (2 of 7)
Four steps for developing the flexible budget.
1.
Identify activity index and relevant range of activity.
•
•
LO 2
Activity index is direct labor hours
Relevant range is 8,000 – 12,000 direct labor hours per month
Copyright ©2018 John Wiley & Son, Inc.
24
Flexible Budget—A Case Study (3 of 7)
Four steps for developing the flexible budget.
2.
Identify variable costs and determine budgeted variable cost per unit of activity for each
cost.
Variable Cost per
Variable Costs
Computation
Direct Labor Hour
Indirect materials
$180,000 ÷ 120,000
$1.50
Indirect labor
$240,000 ÷ 120,000
2.00
Utilities
$ 60,000 ÷ 120,000
0.50
Total
$4.00
ILLUSTRATION 23.12
Computation of variable cost per direct labor hour
LO 2
Copyright ©2018 John Wiley & Son, Inc.
25