Price dynamics and speculative trading in bitcoin
Bạn đang xem bản rút gọn của tài liệu. Xem và tải ngay bản đầy đủ của tài liệu tại đây (453.25 KB, 7 trang )
Research in International Business and Finance 43 (2018) 15–21
Contents lists available at ScienceDirect
Research in International Business and Finance
journal homepage: www.elsevier.com/locate/ribaf
Full length article
Price dynamics and speculative trading in Bitcoin
T
Benjamin M. Blau
Department of Economics and Finance, Huntsman School of Business, Utah State University, 3565 Old Main Hill, Logan, UT, 84341, United States
AR TI CLE I NF O
AB S T R A CT
Keywords:
Bitcoin
Currency markets
Digital currency
Foreign exchange
Speculation
Few innovations in the money markets have brought more attention by regulators and policy
makers than the digital currency Bitcoin. However, few studies in the literature have examined
the price dynamics of Bitcoin. Besides providing an exploratory glace at the value and volatility
of the Bitcoin across time, we also test whether the unusual level of Bitcoin’s volatility is attributable to speculative trading. Results in this study do not find that, during 2013, speculative
trading contributed to the unprecedented rise and subsequent crash in Bitcoin’s value nor do we
find that speculative trading is directly associated with Bitcoin’s unusual level of volatility.
1. Introduction
With the exception of perhaps currency derivatives, few financial innovations in money markets have drawn more attention by
regulators and policy makers than the advent of the digital currency Bitcoin. Unregulated by governments, Bitcoin has become
popular for both consumers and retailers as its value has increased from a few cents to as high as $1,132.26 during the recent past.
The popularity of Bitcoin by retailers might be due to lower transaction fees relative to other credit card processors. Bitcoin’s
popularity among consumers might be related to its unregulated structure or the privacy afforded by its anonymity. For these reasons,
the U.S. Senate recently held hearings regarding potential risks associated with Bitcoin.1 Amidst all of this interest, surprisingly few
academic studies have explored Bitcoin’s exchange rate dynamics and its functionality as a medium of exchange. The objective of this
study is to take a step in this direction.
The objective of this study is twofold. First, we seek to provide some stylized facts about the price dynamics of Bitcoin. Second,
and perhaps more interesting, we test the hypothesis that speculative trading in Bitcoin is responsible for its unusual level of volatility. The volatility of the digital currency might question whether or not Bitcoin functions as currency. While Bitcoin has certainly
been used as medium of exchange for many consumers thus far, others have raised concerns that Bitcoin is less of a currency and
more of a speculative investment.2 Prior research suggests that speculation can lead to a destabilization of asset prices (Hart and
Kreps, 1986; Stein, 1987). To the extent that Bitcoin volatility is indeed induced by speculative trading, such trading may reduce its
role as a viable currency. Approximating speculative trading is a difficult task given that the motives to trade are not observed.
However, Llorente et al. (2002), provide an intuitive measure of speculative trading that captures the level of volume-induced return
autocorrelation. Using this measure, we test the hypothesis that the unusually high volatility observed in Bitcoin is attributable to
speculative trading.3
E-mail address:
During the 2013 Senate Hearing, Senator Thomas R. Carper suggest that digital currencies such as Bitcoin, which are untraceable, can be used to fund criminal
activity such as the distribution of weapons, child pornography, and murder-for-hire.
2
See, for example, the following two articles in the New York Times. http://
krugman.blogs.nytimes.com/2013/12/28/bitcoin-is-evil/
3
Throughout this study, we estimate volatility following the breadth of literature related to generalized ARCH models. See, for example, Engle (1982), Bollerslev
(1986), and Engle and Kroner (1995).
1
/>Received 28 December 2015; Received in revised form 23 September 2016; Accepted 6 July 2017
Available online 24 July 2017
0275-5319/ © 2017 Elsevier B.V. All rights reserved.
Research in International Business and Finance 43 (2018) 15–21
B.M. Blau
Results in this study show that the value of Bitcoin remained well below $20 from the start of our time period (September 2010) to
the beginning of 2013. In 2013, the value of Bitcoin was as low as $13 and as high as $1132. In the months that followed the spike in
Bitcoin’s value, the digital currency lost approximately 60% of its value. These price dynamics seem to indicate the presence of a
bubble in Bitcoin (Blanchard, 1979; Flood and Hodrick, 1990; Scheinkman and Xiong, 2003). The estimated volatility for Bitcoin
during our sample time period is nearly 6% which is nearly twice as large as the average volatility of 51 other currencies. When
examining speculative trading in Bitcoin, to our surprise, we do not find an unusual amount of this type of trading during our sample
time period. In fact, during the latter part of 2013–Bitcoin’s bubble period – we do not observe any speculative trading according to
the methods of Llorente et al. (2002).
Observing low levels of speculative trading during our sample time period is not tantamount to identifying the relationship
between speculative trading and volatility. Additional tests show that speculative trading is not positively related to Bitcoin volatility
and, if anything, a significant negative relation exists. These results are robust to univariate tests and multivariate tests that use GMM
with controls for Newey and West (1987) standard errors. We find further robustness when examining alternative measures of
volatility. Similar conclusions are drawn in a number of probit regressions that capture days with extreme changes in the value of
Bitcoin. We find that the likelihood of these days occurring is negatively related to the level of speculative trading. These findings
suggest that, to the extent that we properly capture speculative trading, such trading is not associated with higher levels of volatility
in Bitcoin.
Our study contributes to the literature in three important ways. First, we provide some initial findings about the exchange rate
dynamics of Bitcoin. Second, we show that despite the substantial rise in the value of Bitcoin, speculative trading during this period
was not unusually high. Third, we demonstrate that the level of speculative trading is not directly associated with the volatility of
Bitcoin. The rest of the study follows. Section 2 presents a background on Bitcoin. Section 3 describes the data. In Section 4, we
present the results from our empirical tests. Section 5 offers some concluding remarks.
2. The background on Bitcoin
As mentioned in the previous section, the objective of this study is to first present some stylized facts about the historic price
dynamics of Bitcoin. Second, we test the hypothesis that speculative trading in Bitcoin can explain the presence of the unusually high
level of volatility in Bitcoin. In order to further motivate our tests, we discuss the background of Bitcoin. The peer-to-peer electronic
monetary system was initially described in a short research paper by Nakamoto (2008), in which the objective of a digital currency is
outlined along with how the digital currency could be created and implemented. Nakamoto (2008) discusses the weaknesses of the
existing electronic payment system and identifies the high costs of mediating disputes in the existing system. To overcome the
inherent trust issues regarding the electronic payment system, Nakamoto (2008) argues that a cryptographic proof would allow, “any
two willing parties to transact directly with each other without the need for a trusted third party”. The cryptographic proof would
provide fraud protection to both sellers and buyers. The intention of the digital currency was to improve of the existing electronic
payment system by allowing individuals to exchange electronic coin using digital signatures, which acts as proof of ownership.
The first Bitcoin transactions occurred in January 2009. More than two years later, various reports estimated the circulation of
Bitcoin to be more than 6.5 million with about 10,000 users. While the early transactions in Bitcoin appeared to function according to
the initial intentions, soon reports began to appear that Bitcoin was being used to purchase illegal drugs. Policy makers around the
world became concerned with the anonymity afforded by Bitcoin. In 2013, two U.S. Senate Committee hearings took place. In the
committee hearings, testimony about the anonymity of the digital currency brought about additional concerns. Senator Chuck
Schumer, for instance, compared Bitcoin to a form online money laundering. Shortly after the congressional testimony, a forum was
held in Washington D.C. where additional concerns were raised about the how the anonymity could be used to purchase child
pornography. These concerns lead to the creation of a Senate task force that sought out the experts regarding the digital currency,
which ultimately found that Bitcoin had yet to replace more traditional ways of funding criminal activity. To date, millions of Bitcoin
remain in circulation and, in general, the use of the digital currency remains unregulated in the U.S.
Beyond the potential to fund criminal activity, economists have voiced concerns that, because of the price dynamics, Bitcoin
functions more as a speculative asset than as a traditional medium of exchange. Because of its anonymity, Bitcoin may be a target by
speculators. Reports have attempted to link the meteoric rise and subsequent collapse in the value of Bitcoin to speculative trading.
These reports seem to have merit as the theoretical literature nicely describes the link between speculation and bubbles/crashes in
different asset markets. Stein (1987), for example, shows that the presence of speculation can inhibit arbitrage and lead to destabilized asset prices. Shiller (1981) provides some additional insight regarding the link between speculation and the destabilization of
prices in equity markets. In particular, Shiller suggests that the observed excess volatility in speculative prices contradicts the efficient
markets hypothesis. This link between speculation and volatility provides the framework for our analysis. While our investigation is
focused on the idea that speculation might adversely affect Bitcoin as a medium of exchange, examining the informational efficiency
of Bitcoin prices may be an important avenue for future research.
3. Data description
We obtain price and volume data from Bitcoin Charts, which provides financial and technical data about the Bitcoin network.
Both price and volume data are available on July 17th, 2010. The end of our sample time period is June 1st, 2014. We also gather
historical exchange-rate data for 51 other currencies during the same time period from Bloomberg. The purpose in doing so is to
provide a simple benchmark when examining Bitcoin volatility.
16
Research in International Business and Finance 43 (2018) 15–21
B.M. Blau
When measuring speculative trading, we closely follow Llorente et al. (2002) and use a time series model that identifies the
dynamic relation between volume and prices. We estimate daily turnover on day t in the following way.4
log turnt = log(turnt + 0.00000255)
vt = log turnt −
1
50
(1)
−1
∑
log turnt
(2)
s = 50
5
vt is the (50-day) de-trended measure of trading activity. Llorente et al. (2002) then estimate the following time-series equation.
Rt+1 = β0 + β1Rt + β2Rt × vt + εt+1
(3)
The dependent variable Rt+1 is the daily return for Bitcoin on day t + 1. Llorente et al. (2002) argue that when β2 is positive,
volume is likely to represent speculative trading. Under this circumstance, trading volume directly affects the serial correlation in
asset returns. Llorente et al. (2002) also argue that when β2 is negative, trading volume inversely affects return autocorrelation and
can be thought of as hedging activity.
We estimate volatility as the long-run average standard deviation in a GARCH(1,1) model. The model can be written as follows:
σt2 = γVL + αmt-12 + βσt-12
(4)
We, however, estimate the following version of the model below:
σt2 = ω + αμt-12 + βσt-12
(5)
and obtain estimated parameters for ω, α, and β. Once these parameters are obtained, we can estimate γ, where γ = 1 − α − β.
Since ω= γVL and we observe σt2, we solve for the long-run variance VL. Our measure of volatility is the square root of this numeric
solution for the long-run variance.
Table 1 provides statistics that describe our sample. Panel A reports the results for Bitcoin while Panel B provides the results for
the exchange rates for 51 different currencies. In Panel A, we find that on the average day, the exchange rate (Bitcoin Rate) was
$123.08, the Bitcoin return (%ΔBitcoin) was 0.9%, and volatility (GARCH(1,1)) was 5.9%. We define two indicator variables that
capture days when the %ΔBitcoin is in the 95th percentile (ExtremeHigh) and in the 5th percentile (ExtremeLow). By construction, the
mean of these indicator variables is very close to 5%. We estimate Eq. (3) using 50-day rolling windows so that each day has a
measure of speculative trading (Speculation). The estimate for β2 from Eq. (3) is −0.0610, indicating that on the average day, trading
activity in Bitcoin is not speculative according to the definition in Llorente et al. (2002). On the average day, trading volume (Volume)
is more than 53,000, the number of Bitcoins outstanding (Outstand) is approximately 9.1 million, and turnover (Turn) is the approximately 0.58%.
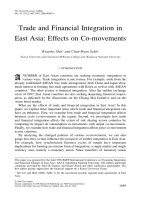
Figs. 1 and 2 show some of these summary statistics across time. Fig. 1 shows that while the number of Bitcoins outstanding grew
at a relatively constant rate, the value of Bitcoin dramatically increased during the latter portion of our time period. In fact, Bitcoin’s
value increased to more than $1100 during the end of 2013. In the months that followed, Bitcoin lost nearly 60% of its value. These
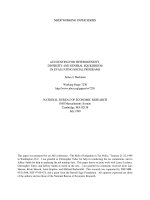
price dynamics seem to indicate the presence of a bubble in Bitcoin. Coincidently, Fig. 2 shows large spikes in Bitcoin volatility during
this period. Contrary to the idea that speculative trading is associated with this increase in volatility and the presence of this bubble,
the figure shows that speculative trading was unusually high during this period.6
Panel B of Table 1 shows some of the summary statistics for the 51 exchange rates from other currencies. The percent change for
the average exchange rate on the average day was 0.01% while volatility was only 3.63%. As before, the indicator variables ExtremeHigh and ExtremeLow have a mean of approximately 5%.7
4. Empirical tests and results
4.1. Univariate correlation
We begin by estimating a correlation matrix for the variables of interest. Table 2 reports the matrix with Pearson Correlation
coefficients in the upper-right diagonal and Spearman Correlation coefficients in the lower-left diagonal. A few results are noteworthy. First, speculative trading and Bitcoin returns are unrelated. However, volatility and Bitcoin returns are positively correlated.
Interestingly, we do not find that volatility (or the extreme indicator variables) is positively related to speculative trading. If anything,
the opposite is true. These results are robust to both Pearson and Spearman coefficients and indicate that speculative trading in
Bitcoin does not contribute to Bitcoin returns or its volatility, per se.
4
Following prior research (Campbell et al., 1993; Llorente et al., 2002; Covrig and Ng, 2004) we use turnover as the ratio of daily Bitcoin volume and the number of
outstanding Bitcoins. We note that we add a small constant (0.00000255) to volume to account for days without trading volume. This constant is further shown to
normalize the distribution of trading volume in Llorente et al. (2002) and Covrig and Ng (2004).
5
Llorente et al. (2002) detrend turnover using t-200 instead of t-50. However, given our data limitations we chose to only use 50 days when detrending turnover.
6
In unreported tests, we examine summary statistics by calendar years and find that while Bitcoin increased from $13 to more than $1100 during 2013, the estimate
for speculative trading was lowest among all of the calendar years. Instead, we find positive estimates for speculative trading during the 2010 and 2011 and, to a lesser
extent, 2014.
7
While we would like to measure speculative trading in the other exchange rates, data containing trading volume for these currencies is not publicly available.
17
Research in International Business and Finance 43 (2018) 15–21
B.M. Blau
Table 1
Summary Statistics.
Mean
[1]
Median
[2]
Standard Dev.
[3]
Min
[4]
Max
[5]
Panel A. Summary Statistics for the Time Series of Bitcoin Exchange Rates
Bitcoin
123.08
11.03
%ΔBitcoin
0.0090
0.0020
GARCH(1,1)
0.0590
0.0432
Extreme High
0.0502
0.0000
Extreme Low
0.0502
0.0000
Speculation
−0.0610
0.0000
Volume
53,386.08
37,985.76
Outstand
9,103,445.69
9,502,250.00
Turn
0.0058
0.0043
234.74
0.0651
0.0412
0.2183
0.2183
0.4188
55,208.58
2,581,000.45
0.0057
0.0600
−0.3596
0.0299
0.0000
0.0000
−1.3380
169.11
3,920,050.00
0.0001
1132.26
0.4510
0.3265
1.0000
1.0000
2.3759
668,549.18
12,838,200.00
0.0606
Panel B. Summary Statistics for Time Series of 51 Country Currencies
%ΔExRate
0.0001
0.0000
GARCH(1,1)
0.0363
0.0502
Extreme High
0.0494
0.0000
Extreme Low
0.0494
0.0000
0.0064
0.0222
0.2168
0.2168
−0.0160
0.0003
0.0000
0.0000
0.1658
0.0532
1.0000
1.0000
The table reports summary statistics for a variety of different variables. Panel A reports the statistics for the Bitcoin data while Panel B shows some of the summary
statistics for average exchange rates for 51 other currencies. Bitcoin is the value of Bitcoin in U.S. dollars. %ΔBitcoin is the Bitcoin return or the daily percent change in
the value of Bitcoin. GARCH(1,1) is the estimate of volatility using GARCH(1,1) model. ExtremeHigh is an indicator variable capturing days when the Bitcoin return is
in the 95th percentile. ExtremeLow is an indicator variable capturing days when the Bitcoin return is in the 5th percentile. Speculation is our estimate of speculative
trading following Llorente et al., 2002. Volume is the daily trading volume in Bitcoin. Outstand is the number of Bitcoin outstanding. Turn is the daily turnover of the
ratio of daily volume scaled by the number of Bitcoin outstanding.
Fig. 1. The figure shows the Bitcoin value and the number of Bitcoins outstanding across our sample time period, which is September 2010 to June.
4.2. Multivariate tests
Next, we provide some more robust multivariate tests. We first estimate the following equation.
GARCH(1,1)t = β0 + β1Speculationt + β2%ΔBitcoint-5,t-1 + β3Turnt-5,t-1 + β4Ln(Outstandt) + β5MktGARCH(1,1)t + εt
(6)
The dependent and independent variables have been defined previously with the exception of MktGARCH(1,1), which is the
average volatility estimates of the 51 other exchange rates. We estimate Eq. (6) using GMM and report p-values that are obtained
from Newey and West (1987) standard errors. Table 3 reports simple regressions in columns [1] through [5] and the full specification
in column [6]. The conclusions we are able to draw are similar across columns, so for brevity, we only discuss our findings in column
[6]. We find that Speculation and Ln(Outstand) produce negative estimates while %ΔBitcoint-5,t-1 and Turnt-5,t-1 produce positive
coefficients. These results indicate that while past Bitcoin returns and trading activity directly affect volatility, speculative trading
does not.
For robustness, we estimate another measure of volatility using the Bitcoin data. In particular, we estimate the 10-day moving
average volatility by taking the standard deviation of daily Bitcoin returns from day t to t-10, where day t is the current trading day
(10-day MA Volt). We then re-estimate Eq. (6) using this additional volatility measure as the dependent variable. The results are
reported in Table 4. We note that, in unreported tests, w the correlation between the 10-day MA Volt and GARCH(1,1) during our
18
Research in International Business and Finance 43 (2018) 15–21
B.M. Blau
Fig. 2. Estimated Volatility and Speculative Trading in Bitcoin across the Sample Time Period.
Table 2
Correlation Matrix.
Speculation
%ΔBitcoin
GARCH(1,1)
ExtremeHigh
ExtremeLow
[1]
[2]
[3]
[4]
[5]
Speculation
1.0000
0.0209 (0.442)
−0.0210 (0.440)
−0.0733*** (0.007)
%ΔBitcoin
−0.0220 (0.418)
1.0000
−0.1125***
(< 0.0001)
0.1328*** (< 0.0001)
GARCH(1,1)
0.0890*** (0.001)
1.0000
−0.5294***
(< 0.0001)
0.2187*** (< 0.0001)
ExtremeHigh
−0.1017***
(0.0002)
−0.0308 (0.257)
0.3781*** (< 0.0001)
0.2642*** (< 0.0001)
0.6248***
(< 0.0001)
0.3583***
(< 0.0001)
1.0000
ExtremeLow
−0.0710** (0.009)
0.1919*** (< 0.0001)
−0.0528* (0.052)
1.0000
MktGARCH(1,1)
0.0639** (0.019)
−0.3781***
(< 0.0001)
−0.0363 (0.181)
0.1152*** (< 0.0001)
0.0030 (0.911)
0.1030*** (0.0001)
−0.0528* (0.052)
Mkt GARCH
(1,1)
[6]
−0.0010
(0.972)
0.0116 (0.671)
−0.0315
(0.247)
−0.0036
(0.896)
0.0634**
(0.020)
1.0000
The table reports the Pearson Correlation Coefficients in the upper-right diagonal and the Spearman Correlation Coefficients in the lower-left diagonal. The variables
included in the matrix are our variables measuring speculative trading (Speculation), the Bitcoin return (%ΔBitcoint), our estimate for volatility (GARCH(1,1)), the two
indicator variables ExtremeHigh and ExtremeLow as well as the volatility estimate for the exchange rates of 51 other currencies (MktGARCH(1,1)t). P-values reported in
parentheses. *,**, *** denote statistical significance at the 0.10, 0.05, and 0.01 levels, respectively.
sample time period is 0.75, suggesting that the two estimates of volatility are relatively similar. As before, we report univariate
regressions for each of the independent variables in columns [1] through [5]. Column [6] shows the results from the full specification.
The inferences that we make between the columns are similar. Therefore, for brevity, we only discuss the full specification. In column
[6], we find that past Bitcoin returns and past turnover positively influence the level of Bitcoin volatility. Further, the number of
Bitcoins outstanding is negatively related to Bitcoin volatility. After controlling for these variables, the coefficient on Speculation is
again negative and significant indicating that speculative trading in Bitcoin does not explain the usually high level of volatility.
In our final set of tests, we estimate the following equation using probit regressions.
Extremet = β0 + β1Speculationt + β2%ΔBitcoint-5,t-1 + β3Turnt-5,t-1 + β4Ln(Outstandt) + β5MktGARCH(1,1)t + εt
(7)
The only difference between Eqs. (7) and (6) is that the dependent variable is now an indicator variable which equals unity on
days when percent changes are either in the 95th or 5th percentile (Extreme). Furthermore, we include ExtremeHigh and ExtremeLow
as additional dependent variables. Table 5 reports the regression results. In each specification, the coefficient on Speculation is
negative. We note that the coefficient on Speculation is not reliably different from zero in column [2]. The marginal probabilities
associated with these estimates range from −0.02 to −0.06 suggesting that the estimates for Speculation are economically meaningful. The coefficients on the other control variables are similar in sign to those in Tables 3 and 4. Again, these results suggest that
19
Research in International Business and Finance 43 (2018) 15–21
B.M. Blau
Table 3
Volatility Regressions.
Intercept
Speculation
%ΔBC Ratet-5,t-1
Turnt-5,t-1
[1]
[2]
[3]
[4]
[5]
[6]
0.0584***
(< 0.0001)
−0.0111** (0.032)
0.0562***
(< 0.0001)
0.0267***
(< 0.0001)
0.3716*** (0.0002)
0.0612***
(< 0.0001)
0.4397*** (< 0.0001)
−0.0084*** (0.009)
0.2667*** (0.001)
0.0541*** (< 0.0001)
0.3217*** (0.003)
0.0535***
(< 0.0001)
−0.0196*** (0.002)
Ln(outstndg)
MktGarch(1,1)
Adj. R2
0.0119
0.0638
0.3228
0.0226
−0.0583 (0.325)
0.0003
−0.0260***
(< 0.0001)
0.0044 (0.923)
0.4080
The table reports the results from estimating the following equation using GMM.
GARCH(1,1)t = β0 + β1Speculationt + β2%ΔBitcoint-5,t-1 + β3Turnt-5,t-1 + β4Ln(Outstandt) + β5MktGARCH(1,1)t + εt
The dependent variable is GARCH(1,1), which is our estimate for Bitcoin volatility. The independent variables include our measure of speculative trading
(Speculation), the prior five-day Bitcoin return (%ΔBitcoint-5,t-1), the prior five-day volume turnover (Turnt-5,t-1), the natural log of outstanding bitcoins (Ln(Outstandt)),
and the volatility estimate for the exchange rates of 51 other currencies (MktGARCH(1,1)t). The equation is estimated using GMM and p-values, which are obtained
from Newey and West (1987) standard errors are reported in parentheses. *,**, *** denote statistical significance at the 0.10, 0.05, and 0.01 levels, respectively.
Table 4
Volatility Regressions.
Intercept
Speculation
[1]
[2]
[3]
[4]
[5]
[6]
0.0488***
(< 0.0001)
−0.0142*** (0.008)
0.0473***
(< 0.0001)
0.0191***
(< 0.0001)
0.4850*** (< 0.0001)
0.0495***
(< 0.0001)
0.5882*** (< 0.0001)
−0.0148***
(< 0.0001)
0.2032*** (< 0.0001)
0.0502*** (< 0.0001)
0.2631*** (0.001)
%ΔBC Ratet-5,t-1
Turnt-5,t-1
0.0521***
(< 0.0001)
−0.0272***
(< 0.0001)
Ln(outstndg)
MktGarch(1,1)
Adj. R2
0.0216
0.0456
0.3059
0.0456
0.0048 (0.928)
0.0000
−0.0359***
(< 0.0001)
0.0623 (0.130)
0.4132
The table reports the results from estimating the following equation using GMM.
10-day MA Voltt = β0 + β1Speculationt + β2%ΔBitcoint-5,t-1 + β3Turnt-5,t-1 + β4Ln(Outstandt) + β5MktGARCH(1,1)t + εt.
The dependent variable is the 10-day moving average volatility (10-day MA Volt), which is the standard deviation of daily bitcoin returns from day t to t-10, where day
t is the current trading day. The independent variables include our measure of speculative trading (Speculation), the prior five-day Bitcoin return (%ΔBitcoint-5,t-1), the
prior five-day volume turnover (Turnt-5,t-1), the natural log of outstanding bitcoins (Ln(Outstandt)), and the volatility estimate for the exchange rates of 51 other
currencies (MktGARCH(1,1)t). The equation is estimated using GMM and p-values, which are obtained from Newey and West (1987) standard errors are reported in
parentheses. *,**, *** denote statistical significance at the 0.10, 0.05, and 0.01 levels, respectively.
Table 5
Probit Regressions.
Intercept
Speculation
%ΔBC Ratet-5,t-1
Turnt-5,t-1
Ln(outstndg)
MktGarch(1,1)
McFadden R2
Dependent Variable = Extreme
[1]
Dependent Variable = ExtremeHigh
[2]
Dependent Variable = ExtremeLow
[3]
13.4851*** (< 0.0001)
−0.4002*** (0.002)
1.7489 (0.151)
0.8322*** (< 0.0001)
−0.9785*** (< 0.0001)
5.6287** (0.018)
0.1254
11.7972*** (0.001)
−0.2403 (0.140)
3.7525*** (0.007)
0.7100*** (< 0.0001)
−0.8820*** (< 0.0001)
0.9188 (0.741)
0.1193
9.1118*** (0.007)
−0.4242*** (0.008)
−0.8848 (0.557)
0.5516*** (< 0.0001)
−0.7205*** (0.001)
8.2401*** (0.009)
0.0872
The table reports the results from estimating the following equation using traditional probit regressions.
Extremet = β0 + β1Speculationt + β2%ΔBitcoint-5,t-1 + β3Turnt-5,t-1 + β4Ln(Outstandt) + β5MktGARCH(1,1)t + εt
The dependent variable is Extreme (ExtremeHigh or ExtremeLow), which are indicator variables equal to unity on days when Bitcoin returns are in the 95th or 5th
percentiles. The independent variables include our measure of speculative trading (Speculation), the prior five-day Bitcoin return (%ΔBitcoint-5,t-1), the prior five-day
volume turnover (Turnt-5,t-1), the natural log of outstanding bitcoins (Ln(Outstandt)), and the volatility estimate for the exchange rates of 51 other currencies
(MktGARCH(1,1)t). P-values are reported in parentheses. *,**, *** denote statistical significance at the 0.10, 0.05, and 0.01 levels, respectively.
20
Research in International Business and Finance 43 (2018) 15–21
B.M. Blau
volatility in Bitcoin cannot be attributed to speculative trading.
Finding that speculative trading is not driving the presence of excess volatility in Bitcoin is puzzling and suggests that something
other than speculation is responsible for the observed bubble in Bitcoin and its volatility. While it would be ideal to continue our tests
exploring other possible explanations for volatility, data and information regarding bitcoin is not readily available. For instance, a
viable explanation for the observed volatility in Bitcoin might be that a currency lending market does not exist and, therefore, shortsale constraints are binding. The fact that Bitcoin cannot be borrowed and, therefore, cannot be shorted is part of the initial intention
of Bitcoin since digital signatures are required as proof of ownership. Perhaps the observed volatility in Bitcoin could be mitigated
with the introduction of a currency lending market, or a derivatives market where the currency could be shorted synthetically. A
large literature discusses how, in the presence of heterogeneous beliefs, short-sale constraints can contribute to destabilized prices
and event bubbles (Miller, 1977; Diamond and Verrechia, 1987; Hong and Stein, 2003). Admittedly, the lack of data and information
about Bitcoin is an important limitation of our study. However, these ideas might be a fruitful avenue for future research.
5. Conclusion
Of all of the recent innovations in money markets, few have garnered more attention than the digital currency Bitcoin. Policy
makers and regulators are concerned about the negative externalities associated with Bitcoin’s anonymity. For instance, during recent
congressional testimony, concerns were raised about the possibility that Bitcoin could be used to fund criminal activity. Economists
are concerned about the functionality of the digital currency as a medium of exchange. Some economists have argued that Bitcoin
acts more like a speculative investment than a currency. Much has been written in the literature about the role that speculation plays
in the creation of asset bubbles and the destabilization of prices (Stein, 1987; Shiller, 1981). The objective of this study is to first
present some stylized facts about the price dynamics of Bitcoin. Second, we test the hypothesis that speculative trading leads to the
unusually high level of volatility in Bitcoin.
Interestingly, we find that the value of Bitcoin, which began trading at only a few cents, climbed as high as $1,132.26 at the end of
2013. In the subsequent months, Bitcoin lost approximately 60% of its value. This unusual rise and fall in the value of an asset seems
to appropriately represent the presence of an asset bubble. However, in our tests, we do not find that, during this period, speculative
trading was significantly high. Contrary to the idea that speculative trading contributes to Bitcoin’s volatility, we do not observe a
positive relation in our univariate or multivariate tests. Results from our study should alleviate some concerns about the viability
Bitcoin as a currency instead of a speculative investment.
References
Blanchard, O.J., 1979. Speculative bubbles, crashes and rational expectations. Econ. Lett. 3, 387–389.
Bollerslev, T., 1986. Generalized autoregressive conditional hetroskedasticity. J. Econom. 31, 307–327.
Campbell, J., Grossman, S., Wang, J., 1993. Trading volume and serial correlation in stock returns. Q. J. Econ. 108, 905–939.
Covrig, V., Ng, L., 2004. Volume autocorrelation, information, and investor trading. J. Bank. Finance 28, 2155–2174.
Diamond, D.W., Verrechia, R.E., 1987. Constraints of short-selling and asset price adjustment to private information. J. Financ. Econ. 18, 277–311.
Engle, R.F., Kroner, K.F., 1995. Multivariate simultaneous generalized ARCH. Econom. Theory 11, 122–150.
Engle, R.F., 1982. Autoregressive conditional heteroscedasticity with estimates of the variance of United Kingdom inflation. Econometrica 50, 987–1007.
Flood, R.P., Hodrick, R.J., 1990. On testing for speculative bubbles. J. Econ. Perspect. 4, 85–101.
Hart, O.D., Kreps, D.M., 1986. Price destabilizing speculation. J. Political Econ. 94, 927–952.
Hong, H., Stein, J.C., 2003. Difference of opinion, short-sales constraints, and market crashes. Rev. Financ. Stud. 16, 487–525.
Llorente, G., Michaely, R., Saar, G., Wang, J., 2002. Dynamic volume-return relation of individual stocks. Rev. Finan. Stud. 15, 1005–1047.
Miller, E., 1977. Risk, uncertainty, and divergence of opinion. J. Finance 32, 1151–1168.
Nakamoto, S., 2008. Bitcoin: A Peer-to-Peer Electronic Cash System.
Newey, W.K., West, K.D., 1987. A simple, positive semi-Definite, heteroskedasticity and autocorrelation consistent covariance matrix. Econometrica 55, 703–708.
Scheinkman, J.A., Xiong, W., 2003. Overconfidence and speculative bubbles. J. Political Econ. 111, 1183–1220.
Shiller, R.J., 1981. The use of volatility measures in assessing market efficiency. J. Finance 36, 291–304.
Stein, J., 1987. Informational externalities and welfare-reducing speculation. J. Political Econ. 95, 1123–1145.
21