Plant foods for human nutrition volume 67 issue 3 2012 doi 10 10072fs11130 012 0301 5 shridhar k sathe harshal h kshirsagar girdhari m sharma solubilization fractionation and electrophore
Bạn đang xem bản rút gọn của tài liệu. Xem và tải ngay bản đầy đủ của tài liệu tại đây (981.44 KB, 9 trang )
Plant Foods Hum Nutr (2012) 67:247–255
DOI 10.1007/s11130-012-0301-5
ORIGINAL PAPER
Solubilization, Fractionation, and Electrophoretic Characterization
of Inca Peanut (Plukenetia volubilis L.) Proteins
Shridhar K. Sathe & Harshal H. Kshirsagar &
Girdhari M. Sharma
Published online: 12 August 2012
# Springer Science+Business Media, Inc. 2012
Abstract Effects of different solvents, ionic strength, and
pH on Inca peanut seed protein solubility were assessed by
quantitatively analyzing solubilized proteins using Lowry
and Bradford methods. Soluble proteins were fractionated
using Osborne procedure and the polypeptide composition
of solubilized proteins was determined by one dimensional
25 % monomer acrylamide linear gradient SDS-PAGE.
Osborne protein fractions were analyzed by the 2D gel
electrophoresis. Total seed proteins were efficiently solubilized by 2 M NaCl among the tested solvents. The soluble
seed proteins registered a minimum solubility at pH ~4.0.
Osborne protein fractions, albumins, globulins, prolamins,
and glutelins accounted for 43.7, 27.3, 3.0, and 31.9 %,
respectively, of the total aqueous soluble proteins. Soluble
seed flour proteins are mainly composed of polypeptides in
the MW range of 6–70 kDa of which the predominant polypeptides were in the 20–40 kDa range. Prolamin fraction was
mainly composed of four polypeptides (MW < 15 kDa).
S. K. Sathe (*) : H. H. Kshirsagar : G. M. Sharma
Department of Nutrition, Food & Exercise Sciences,
College of Human Sciences, The Florida State University,
402 SAN,
Tallahassee, FL 32306-1493, USA
e-mail:
Present Address:
H. H. Kshirsagar
Roquette America Inc.,
2000 South Batavia Avenue, Suite 400,
Geneva, IL 60134, USA
Present Address:
G. M. Sharma
Department of Health and Human Services, Public Health Service,
Food and Drug Administration,
Office of Applied Research and Safety Assessment,
Center for Food Safety and Applied Nutrition, U.S. FDA,
8301 Muirkirk Road,
Laurel, MD 20708, USA
Glycoprotein staining indicated 32–35 and <14 kDa peptides
to be positive.
Keywords Inca peanut . Protein . Solubility . Protein
fractions . Electrophoresis
Abbreviations
β-ME
β-mercaptoethanol
CBBR
Coomassie brilliant blue R
CHAPS 3-[(3-Cholamidopropyl)dimethylammonio]-1propanesulfonate
DTT
Dithiothreitol
EtOH
Ethanol
IEF
Isoelectric focusing
kDa
Kilodalton
LSD
Least significant difference
MeOH
Methanol
MW
Molecular weight
PAGE
Polyacrylamide gel electrophoresis
pI
Isoelectric pH
RT
Room temperature
SDS
Sodium dodecyl sulfate
Tris
2-Amino-2-hydroxymethyl-propane-1,3-diol
Introduction
Plant foods are important in human and animal nutrition.
According to FAO [1] statistical data, plant foods [cereals
(46.4 %), roots/tubers (5.1 %), vegetable oils (9.6 %), sugars/sweeteners (8.1 %), fruits (5.9 %), and pulses (2.1 %)]
together provided 77.2 % of the total food energy consumed
during 2005–2007. Among plant foods, cereals typically
provide the bulk of the calories (range 18.5 % for Burundi
and Rwanda to 78.1 % for Bangladesh). Pulses, despite their
high protein content, contribute in much smaller portion of
global caloric intake (range 0 % for Armenia, Azerbaijan,
248
Belarus, Georgia, Latvia, Samoa, Uzbekistan, and Vanuatu
to 18.7 % for Burundi). Legumes such as beans, peas, and
some oilseeds, make a significant contribution to human and
animal food protein supply [2–5] and therefore are considered to be valued crops. Reviews on legume food and
nutrition [6–13] continue to periodically appear indicating
the global importance and interest in legume research and
utilization.
Soybeans, peanuts, peas, and common dry beans are
some of the most widely investigated and utilized legume
crops. However, there are many native legume species that
remain under-utilized (e.g., lablab, moth, and Tepary beans).
An extensive report on tropical legumes compiled by the US
National Academy of Sciences over 30 years ago [14] is
particularly informative and useful in this regard. In addition
to their use in foods, many legumes are also utilized for nonfood uses (e.g., ornamental uses of several Acacia spp. and
production of luxury timbers from Pterocarpus spp.) [14].
Plukenetia L. (Euphorbiaceae) is a pantropical genus that
reportedly consists of 19 species belonging to Plukenetieae
(subfamily Acalyphoideae) [15, 16]. Plukenetia species are
twining vines found in tropical rain forests to seasonally dry
forest or scrub. Plukenetia penninervia Muell. Arg., a species found in rainforests of Mexico is used for basket weaving and other craft activities for several centuries dating
back to the Mayan period [17]. Inca peanut (Plukenetia
volubilis L.), also known as Sacha inchi, is an underutilized
plant that grows wild in the rain forests of the Andean
region. This plant belongs to the Euphorbiaceae family
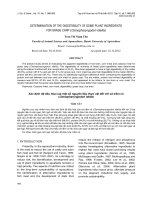
[18]. High in oil (54 %, w/w) and protein (27 %) [19], the
plant seeds are typically flat, <2 cm across, and slightly
dome shaped in the middle (Fig. 1). The seeds are protected
by a tough, dark outer shell with soft thin tissue layer on the
inside. Since the seeds are bitter, they are typically eaten
after suitable processing (e.g., roasting) and are valued as a
significant source of dietary protein by the native people.
Unlike soybean, peanut, cottonseed and sunflower oils that
are high in linoleic but low in linolenic acid, Inca peanut oil
Plant Foods Hum Nutr (2012) 67:247–255
contains approximately equal proportions of the essential
fatty acids, linoleic- the C18:2, ω-6 (36.8 % w/w) and
linolenic-C18:3, ω-3 (45.2 %, w/w). A recent report indicates that these two fatty acids accounted for 35.34 and
46.92 % respectively with reported average of the published
data of 33.74 and 44.79 %, respectively. The quantity of
monounsaturated oleic acid (9.6 %, w/w) in Inca peanut
lipids is less compared to the corresponding amounts in
soybean (22.3 %), peanut (41.3 %), cottonseed (18.7 %),
and sunflower (29.3 %) seed oils [19]. The Inca peanut seed
proteins are soluble in aqueous buffers and a water soluble
albumin has been reported to constitute ~25 % (w/w) of the
defatted seed flour weight or 31 % of total proteins in the
seed. This albumin protein is a dimeric, glycosylated [contains 4.8 % (w/w) sugar], basic protein (pI~9.4) with an
ultracentrifuge sedimentation value of 3S [20]. The results
of amino acid composition analyses indicate high levels of
cysteine, tyrosine, threonine, and tryptophan and low
amounts of phenylalanine in the seed proteins [19, 21].
Legume proteins are known to be deficient in sulfur amino
acids [6, 22]. Inca peanut seed proteins contain high
amounts of sulfur amino acids (methionine + cysteine),
37 mg/100 g seed meal protein, as compared to the FAO/
WHO/UNU recommended scoring pattern for these sulfur
amino acids—25 mg/100 g protein [1, 19]. Taken together,
Inca peanut seed flour proteins are a valuable source of
dietary proteins. However, except for some of the reported
studies, little is known about the Inca peanut seed proteins.
Here we report our findings on protein solubility and electrophoretic properties of Inca peanut seed proteins.
Materials and Methods
Materials
The source of seeds used for Fig. 1 has been reported earlier
[19]. Hexane defatted seed flours (two separate batches, ~5 kg
each) used for the current investigations were a gift from
Cristina Thibaut (Cobiosa, Industrias Asociada SL, Madrid,
Spain). The defatted flour batches were stored at −20 °C until
further use. Sources of the reagents and chemicals used have
been reported earlier [21, 23].
Methods
All experiments were conducted at least in duplicate
using separate batches of defatted flours.
Protein Solubilization and Extraction
Fig. 1 Inca peanut whole seed and kernel. The kernel is packed inside
a dark brown hard shell with an inner soft white tissue lining
Effect of Buffer Proteins were solubilized in the selected
solvent and for the indicated extraction time using defatted
Plant Foods Hum Nutr (2012) 67:247–255
seed flour to solvent ratio of 1:10 (w/v) at room temperature
(RT, ~25 °C) with constant mechanical shaking. Aqueous
solvents used for protein solubilization were: A) distilled
deionized water, B) 2 M NaCl, C) 0.1 M Tris-HCl (pH 8.1),
D) 0.05 M Na3PO4 buffer (pH 7.5), E) 0.1 M borate saline
buffer (BSB, 0.1 M H3BO3, 0.025 M Na2B4O7, 0.75 M
NaCl, pH 8.45), F) 0.1 M NaOH, G) 0.1 M HCl, H) 2 %
(w/v) sodium dodecyl sulfate (SDS), I) 70 % (v/v) aqueous
ethanol (EtOH), J) 10 % (v/v) acetic acid, K) 0. 1 M
NaHCO3, L) 10 % (w/v) Na2SO4. The pH of the slurry
was adjusted using 1 M HCl and 1 M NaOH (pH range
1–12). At the end of the extraction period, the slurry was
centrifuged (12,300g, 15 min, RT), the supernatant collected
and used for further analysis.
Effect of Extraction Conditions on Protein Solubility Effects
of ionic strength (0–4 M NaCl), time of extraction (1–5 h,
1 M NaCl), pH (pH range 1–13, 1 M NaCl extraction), and
repeated (five) consecutive extractions in 1 M NaCl on the
protein solubility were determined by extracting 100 mg
defatted flour with the appropriate solvent (1 ml) [e.g., flour
to solvent ratio01:10 (w/v)] at RT with continuous vortexing
at room temperature (RT, ~25 °C) followed by centrifugation at 16,000 g for 15 min at RT. To investigate the effects
of pH on seed flour protein solubility, defatted flours (2 g
each) were first dispersed in either distilled deionized water or
aqueous 1 M NaCl and the pH of the dispersion was adjusted
to the desired value with diluted (0. 1 M) NaOH and/or HCl
and continued stirring for 30 min until pH was stabilized.
Then, the final flour to solvent ratio 1:10 (w/v) was adjusted
and the soluble proteins were extracted for 1 h with constant
magnetic stirring. At the end of extraction, the slurry was
centrifuged (15,000 g, 30 min, 4 °C), the supernatant
collected and analyzed for soluble protein within 48 h.
Osborne Fractionation Protein fractionation of the defatted
seed flour proteins was done by the Osborne method [24].
Briefly, the defatted seed flour (100 g) each was sequentially
extracted with 2 M NaCl (albumins + globulins), 70 %
aqueous ethanol (prolamins), and 0.1 M NaOH (glutelins)
at flour to solvent ratio 1:10 (w/v) at room temperature (RT)
for 1 h with constant magnetic stirring. The pH of flour
suspensions in distilled water, 2 M NaCl, and 70 % aqueous
EtOh was approximately 6.6–6.7 while in 1 N NaOH the pH
was ~12.6. At the end of each extraction the slurry was
centrifuged (15,000 g, 30 min, 4 °C), the supernatant collected, and the residue was used for next extraction. The
residue was discarded after the 0.1 M NaOH extraction step.
Each supernatant was filtered through Whatman filter paper
number 4 and dialyzed (molecular weight cut-off of the
dialysis tubing06–8 kDa, Spectra-Por Dialysis, Spectrum
Laboratories, Inc., Rancho Dominguez, CA) against distilled deionized water for 48 h (4 °C, 10 lit each, six
249
changes); each dialyzed extract, except for the 2 M
NaCl extract, was separately lyophilized. True albumins
were separated from the true globulins by subjecting the
dialyzed 2 M NaCl extract to centrifugation (15,000 g,
30 min, 4 °C). The separated true albumins (supernatant) and the true globulins (residue) were separately
lyophilized. The lyophilized protein fractions were
stored at −20 °C in plastic screw-capped bottles until
further use.
Gel Electrophoresis
SDS-PAGE Sodium dodecyl sulfate polyacrilamide gel electrophoresis (SDS-PAGE) was run by the method of Fling
and Gregerson [25] as described in Sharma et al. [26].
Appropriate protein samples were loaded on 8–25 % linear
acrylamide gradient separating gel and 4 % monomer acrylamide stacking gel. The gel was typically run at 10 mA/gel
until the tracking dye migrated to the gel edge (typically
20 h). The gels were stained with Coomassie Brilliant Blue
R (CBBR) or silver stain followed by appropriate destaining
as described earlier [23].
2D Gel Electrophoresis were conducted as described below
(a) SDS-PAGE gels without the reducing agent [2 %v/v
mercaptoethanol (β-ME)] were run in the first dimension followed by SDS-PAGE in the presence of the
reducing agent. Gels were typically run at a constant
current (10 mA/gel) with tap water cooling provided
during the gel run. The gels were stained with Coomassie Brilliant Blue R and appropriate lanes were
excised for 2D analysis. The excised gel strips were
soaked in SDS-PAGE sample buffer [0.05MTris-HCl,
pH 6.8; 0.1 % (w/v) SDS; 0.01 % (w/v) bromophenol
blue; 30 % (v/v) glycerol] containing 2 % (v/v) β-ME
and heat-denatured (~100 °C) in a microwave oven
(Kenmore, model 565.68301790, Sears, Hoffman
Estates, IL) for 30 s at 1,000 W. The strips were then
cooled to RT, turned 90º counterclockwise, laid on top
of the 4 % stacking gel with a 8–25 % linear monomer
acrylamide gradient SDS-PAGE separating gel, and
electrophoresed as indicated above. The gels were then
stained (CBBR) and destained as described by Sathe et
al. [23]. Briefly, the gels were stained overnight with 0.
25 % Brilliant blue R (B0149-100 G, Sigma-Aldrich)
in 50 % methanol and 10 % acetic acid. The gels were
destained with destain solution (50 % methanol and
10 % acetic acid) once followed by diluted destaining
solution (~1:1 with water) until the background was
clear.
(b) IEF-SDS-PAGE Fractionated proteins were subjected
to 2D gel separations using isoelectric focusing (IEF)
in the first dimension followed by SDS-PAGE as described by Sharma et al. [26]. About 1.1–1.4 mg of
250
Plant Foods Hum Nutr (2012) 67:247–255
freeze-dried protein fractions were suspended in 500 μl
rehydration buffer [8 M urea, 2 %w/v 3-[(3-Cholamidopropyl)dimethylammonio]-1-propanesulfonate
(CHAPS), 0.002 % bromophenol blue, 0.5 % carrier
ampholyte, and 20 mM dithiothreitol (DTT)] for 1 h at
room temperature followed by centrifugation at
16,000 g for 15 min. An appropriate amount (30–
50 μl) of the supernatant was mixed with the rehydration buffer to a final volume of 250 μl and was used to
rehydrate pH 3-10NL 13 cm IPG strips (17-6001-15,
GE healthcare) overnight (thus loading the protein
sample on the strips). The strips were covered with
mineral oil to prevent evaporation. The rehydrated
strips (containing the protein samples) were used for
IEF as per manufacturer’s recommendation (IEF100,
Hoefer Scientific Co., CA) using following conditions:
1- gradient volt, 1,000 V, 1 h; 2- gradient volt,
12,000 V, 1 h; 3- constant volt, 12,000 V, 25,000 V,
1 h; 4- constant volt, 1,000 V, 1 h. For the 2nd
dimension, the focused strips were incubated
15 min in equilibration buffer (6 M urea, 75 mM
Tris-HCl pH 8.8, 29.3 % glycerol, 2 % SDS,
0.002 % bromophenol blue) containing 10 mg/ml
DTT, followed by 15 min in equilibration buffer
containing 25 mg/ml iodoacetamide. The IPG strips
were then horizontally placed on a 8–25 % gradient
monomer linear acrylamide gel and sealed with 1 %
(w/v) agarose. An appropriate amount (10 μl) of
same supernatants and protein markers were loaded
on the either side of the gel, and run overnight at
constant current of 10 mA/gel followed by 20 mA/
gel next day, until the tracking dye reached gel
edge. The gels were then stained (CBBR) and
destained as described by Sathe et al. [23]).
Glycoprotein Staining
Soluble Protein Soluble protein was determined using the
methods of Lowry et al. [28] and Bradford [29]. Each sample was typically suitably diluted and analyzed in duplicate.
Tannins A known weight of the sample (0.1 g) was
extracted for 1 h in absolute methanol (MeOH) and acidified
(1 % HCl, v/v) MeOH with continuous vortexing followed
by centrifugation (15,000 g, 10 min, RT). Aliquots of the
supernatant were immediately analyzed for tannin using a
4 % (w/v) vanillin assay [30]. A catechin standard curve (0–
1 mg/ml) was prepared simultaneously. Tannin content was
expressed as catechin equivalents.
Statistical Analysis
All statistical analyses were performed using SPSS statistical
software (version 15; Chicago, IL). All experiments were
conducted at least in duplicate, and data are expressed as the
mean ± standard deviation (SD). One-way ANOVA and Fisher’s least significant difference (LSD) test as described by Ott
[31] were used to determine statistical significance, and results
were considered to be significant if the differences between
the two means exceeded the LSD value (p00.05).
Results and Discussion
Defatted Flour
Three samples from each of the two defatted flours batches
(n06) were analyzed for proximate composition. The average
percent protein (%N x 5.7), moisture, ash, and soluble carbohydrate content of the defatted flours were 59.1±3.3, 8.32±
0.11, 6.46±0.05 and 1.03±0.06, respectively. The average
total soluble phenolics in the defatted flours were 0.117±
0.021 and 0.112±0.016 g/100 g flour when extracted with
Glycoprotein staining was done on SDS-PAGE gels using the
Gelcode glycoprotein staining (Pierce Chemical Co., Rockford, IL) procedure following manufacturer’s instructions.
Proximate Composition
Moisture An accurately weighed sample (0.1 g) was placed in
an aluminum pan and was dried in a previously heated vacuum oven (Barnstead Lab-Line, Melrose Park, IL; model 36085; 95-100 °C, 25 in. of Hg) to a constant weight AOAC
Official Method 925.40 [27].
Protein AOAC Official Method 950.48 [27]. The microKjeldahl method was used to determine total proteins using
0.1 g sample. Sample nitrogen content was calculated using
the formula: Proteinð%Þ ¼ total Nð%Þ Â 5:7.
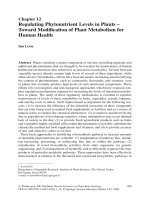
Fig. 2 Seed flour protein solubility in a Distilled deionized water, b
2 M NaCl, c 0. 1 M Tris–HCl (pH 8.5), d 0.05 M Sodium phosphate
buffer (pH 7.5), e 0.1 M BSB (pH 8.45), f 0.1 M NaOH, g 0.1 M HCl,
h 2 % (w/v) SDS, i 70 % (v/v) EtOH, j 10 % (v/v) acetic acid, k 0.1 M
NaHCO3, l 10 % (w/v) Na2SO4. LSD (p00.05) is 7.76 (Lowry) and
0.97 (Bradford), n06 for both
Plant Foods Hum Nutr (2012) 67:247–255
251
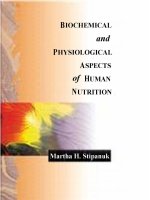
Fig. 3 Effects of a indicated
NaCl concentration, b
extraction time, c consecutive
extraction (1 h each) in aqueous
2 M NaCl, and d pH on seed
flour protein solubility. For b
and d, aqueous 1 M NaCl was
used for protein extractions.
The LSD (p = 0.05) values for
Lowry method were 2.81, 6.8,
4.46, and 8.18 respectively for
a, b, c, and d. LSD (p = 0.05)
values for the Bradford method
were 1.52, 1.76, 0.82, and 1.26,
respectively for a, b, c, and d,
n = 6 for both
methanol and acidified methanol, respectively, indicating the
phenolics both solvents. The chemical composition of the
defatted flour found in the current investigation is consistent
with soybean [32], peanut [33], sesame [34], and lupin [35, 36]
seed flours. The protein content of the defatted flour found in
the current investigation is comparable to the reported
protein content (53 %) for the defatted flour from inca
peanut grown in Peru [19].
Protein Solubility
Among the tested solvents, 0.1 N NaOH and 2 M NaCl were
the most effective solvents for solubilizing the flour proteins
(Fig. 2). Since the albumin fraction constitutes a significant
portion of the total seed proteins, a good solubility was
expected in aqueous solvents [21]. Although 0.1 M NaOH
was the most effective protein solubilizer, the exposure to
alkali is known to alter proteins through amino acid deamidation and may therefore alter protein properties [37, 38]. Alkali
exposure may also cause destruction of some of the essential
amino acids, such as lysine, thereby decreasing the nutritive
value of the solubilized proteins. For these reasons, 2 M NaCl
was considered to be the best solvent to solubilize the Inca
seed flour proteins in this investigation. When soluble proteins
were analyzed by Lowry et al. [28] and Bradford [29] methods, the latter method consistently registered lower protein
content (Fig. 2), regardless of the solvent used. Bradford
method is reportedly ~4× more sensitive than the Lowry
method and susceptible to interference by 1 % SDS, 1 %
Triton X-100, and to a lesser extent by 1 % hemosol, 2 M
Tris, acetone, and 5 % phenol. Lowry protein assay is
susceptible to a number of reagents and chemicals commonly
found in biological samples. Among these, amino acid these,
glycine (at 0.5%) is known to decrease color with protein by
50 %. Glycine, at 118 mg/g protein, is the second most
abundant amino acid, behind glutamic acid (133 mg/g protein), in Inca peanut flour proteins [19]. A lower color yield
and lower protein content would be expected, all provided
glycine was in free amino acid form when Lowry method was
used. It is unlikely that all glycine residues in Inca peanut
seeds would be in the free amino acid form. Solvents used for
protein solubilization are also unlikely to contain significant
amounts of glycine. The lower protein content (Bradford
method) of 0.1 M Tris-HCl (pH 8.1) extracted protein samples
although possible, is not likely due to the interference by Tris
as the final Tris concentration in the assay (≤0.1 mM) was far
less than the reported 2 M Tris interfering in the Bradford
assay. The consistent lower protein estimation by Bradford
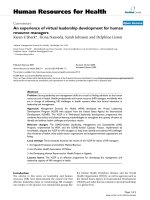
Fig. 4 Seed flour protein solubility in distilled deionized water at the
indicated pH (Lowry method). Note the minimum protein solubility at
pH 4. LSD (p00.05)01.26, n06
252
Plant Foods Hum Nutr (2012) 67:247–255
Fig. 5 SDS-PAGE (8–25 % linear monomer acrylamide gradient)
analysis of total seed flour soluble proteins using silver a, b and
glycoprotein c staining in indicated solvents (A-L, same as in Fig. 2)
in the absence a and presence b, c of a reducing agent (2 %v/v β ME).
Protein load in each lane was 10 μg a, b, and 40 μg c. This figure is a
composite of 3 different gels (15 wells each). Protein (S) and polypeptide (P) standards used are indicated by their molecular weights (kDa)
on the left
assay [28] as compared to Lowry procedure [27], in all tested
samples, remains unresolved and therefore warrants further
investigations to determine the cause(s) for this difference.
At NaCl concentration ≥0.5 M protein solubility increased
significantly ≥ 0.05NaCl concentration (Fig. 3a). Extraction
time of 15–30 min was considered adequate to maximally
solubilize the flour proteins in 2 M NaCl (Fig. 3b) and two
consecutive extractions were able to solubilize the majority
of the flour proteins (Fig. 3c). Bradford assay once again
registered lower protein readings than the Lowry assay when
procedure the NaCl solubilized samples were analyzed
(Fig. 3a, b, and c). In the presence of 1 M NaCl the influence
of pH on protein solubility (Fig. 3d), as determined by Lowry
method [27], was statistically not significant as indicated by
the narrow range (40.93 to 47.00 g solubilized protein/100 g
deffated flour at pH 1 and 12, respectively). The difference in
protein solubility was less than the LSD08.18 (p00.05) for
this tested pH range (1-13). Protein solubility of these samples, determined by Bradford method, exhibited a narrow
range [8.42 to 13.38 g solubilized protein/100 g deffated flour
at pH 4;]. With the exception of solubility at pH 3, protein
solubility as determined by Bradford method, significantly
decreased at pH 4. The low protein solubility in the pH range
3–5 was further confirmed when the influence of pH on protein
solubility in distilled water, i.e. in the absence of 2 M NaCl,
was determined (Fig. 4). The observed pH dependence of
protein solubility is consistent with the reported dominance
of acidic amino acids in the make-up of the seed flour
proteins [19]. Taken together, protein solubility results indicate the importance of ionic strength in solubilizing Inca
peanut seed proteins.
were characterized by polypeptides in the 10–70 kDa range.
The soluble seed flour proteins are mainly composed of two
molecular species (32–35 kDa and ~60–62 kDa). Electrophoretic profiles in the absence of the reducing agent β-ME
(Fig. 5a) also indicated that seed proteins contained disulfide bond-linked polypeptides. Upon reduction, the electrophoresis profile (Fig. 5b) indicated that the 60–62 kDa
polypeptide is composed of a disulfide bond linked dimer
of 32–35 kDa and a 60–62 kDa monomeric polypeptide.
Although disulfide bond reduction facilitated a significant
disappearance of the 60–62 kDa polypeptides, it did not
allow their elimination (e.g., compare the band width and
intensity of these bands in lanes J, K, and L in Fig. 5a versus
Osborne Protein Fractionation and Electrophoresis
With the exception of 70 % aqueous EtOH, solubilized
proteins exhibited a consistent polypeptide pattern, regardless of the solvent used (Fig. 5). The soluble seed proteins
Fig. 6 Two dimensional SDS-PAGE of BSB (0.1 M, pH 8.45) soluble
proteins. First dimension (top gel) was run in the absence of a reducing
agent (2 % (v/v) β-ME). Protein (100 μg load) migration was from left to
right. Second dimension gel was run by the presence of a reducing agent
(2 % (v/v) β-ME) using soluble protein (50 μg) in the left reference lane
and molecular weight markers in the right reference lane. Protein migration was from top to bottom
Plant Foods Hum Nutr (2012) 67:247–255
Fig. 7 SDS-PAGE (8-25% linear monomer acrylamide gradient) in the
presence of a reducing agent ( 2 % (v/v) β-ME) for Osborne protein
fractions. Protein load, except for the standards, was 75 μg each. Note
the different polypeptides in globulin (*) compared to the albumin
fraction profile. The polypeptide marked (←) in the alkali glutelin
fraction profile was distinctly different when compared with globulin
fraction polypeptide profile
5b). Comparison of the corresponding lanes of Fig. 5a and b
demonstrate the increased concentration and number of polypeptides with MW<30 kDa indicating the importance of
disulfide bonds in the seed protein organization. These results
indicate the presence of two different types of 60–62 kDa
proteins. A 2D analysis of the aqueous 2 M NaCl soluble
Fig. 8 2D (IEF top gel left to
right- pH range 3–10 followed
by SDS-PAGE- top to bottom)
gel electrophoretic analysis of
the fractionated proteins prepared from the defatted seed
flour. Protein load was ~60 μg
each in both directions. Molecular weights (kDa) of the standard proteins are indicated in
each gel on the left. The protein
fractions in the second dimension gel are in the
corresponding gel (right lane)
indicated as A albumin, Gb
Glubulin, P Prolamin, and Gn
Alkali Glutelin
253
proteins in SDS-PAGE (Fig. 6) further confirmed the presence
of two different types of 60–62 kDa proteins. The polypeptides solubilized by 70 % (v/v) aqueous EtOH stained poorly
usnig silver staining (lane I, Fig. 5a and b). Glycoprotein
staining (Fig. 5c) of the solubilized proteins demonstrated that
the 32–35 kDa polypeptides are glycosylated. The glycoprotein staining also revealed that the 70 % (v/v) aqueous EtOH
soluble polypeptides (range 10–30 kDa) that were poorly
stained in silver staining were readily recognized (Fig. 5c,
track I).
Of the total soluble proteins, true albumin, globulin, and
glutelin were the major fractions in the seed flour soluble
proteins with prolamin contributing in a small proportion
(Fig. 7b). Typically, over 90 % of the seed flour proteins
could be solubilized by the aqueous solvents used for protein fractionation. One dimensional SDS-PAGE analysis of
the Osborne fractions (Fig. 7) indicates (judged qualitatively
based on band width and intensity) that the major polypeptides (30–40 kDa range) that constitute the albumin fraction
also appear to be the major polypeptides in globulin and
glutelin fractions. The main difference between the albumin
and globulin fraction was the distinctly different polypeptides present in the globulin fraction (indicated by an * next
to the polypeptide on the right of the globulin track). Globulin and glutelin fractions had comparable polypeptide composition with the glutelin fraction exhibiting higher
proportion of polypeptide marked by the arrow (right side
of the glutelin track). Prolamin fraction was mostly
254
composed of four polypeptides in the molecular weight
range 6–12 kDa. Two dimensional gel electrophoresis of
the protein solubility fractions (IEF in the first dimension
followed by the SDS-PAGE in the presence of β-ME
(Fig. 8) further confirmed that the seed flour proteins
were mainly composed of two types of polypeptides
with estimated molecular weights in the range 32–
35 kDa that were linked together by disulfide bonds.
These results also demonstrated that the glutelin fraction
is different than the globulin fraction (compare the
globulin profile to that of the profile for glutelin fraction in Fig. 8), mainly with respect to the isoelectric pH
of individual polypeptides. A closer examination indicates that the globulin fraction contained polypeptides
that are slightly more basic (judged based on their
mobility in the first dimension) than those in the glutelin fraction although the molecular weight, indicated
by their mobility in the second dimension, appear to be
similar. Although alkali exposure of the insoluble globulin polypeptides during glutelin fraction preparation
may possibly cause deamidation resulting in the formation of acidic polypeptides, it does not explain why the
globulin polypeptides were not solubilized during 2 M
NaCl extraction (the first step) during seed flour protein
fractionation especially since the flour to solvent ratio
of 1:10 (w/v) provided more than sufficient amount of
solvent. It is possible that when albumins and globulins
are present together, their collective behavior, as opposed to their individual behavior, may differ significantly, an observation similar to the one reported earlier
in the Great Northern bean (Phaseolus vulgaris L.)
proteins [39]. One possible reason of the different behavior between albumins and globulins, when present
together, is, the protein-protein interactions. These
protein-protein interactions are facilitated by dfferent
bonding forces (e.g., ionic, hydrogen, hydrophobic, and
disulfide) depending on the environmental conditions
permitted by the experimental conditions used (e.g.,
pH, ionic strength, and temperature). Such protein-protein
interactions may lead to formation of large protein complexes
(soluble and insoluble) thereby affecting their solubility. If
globulin solubility is limited due to the presence of albumins,
the insoluble globulins would then be extracted as the glutelins solubilized by alkali solution. Note the appearance of new
polypeptides [>56 kDa and <72 kDa and several polypeptides
in >26 and ~34 kDa range)] in the second dimension that were
not part of the globulin fraction. The >26 kDa and ~34 kDa
polypeptides have more acidic pIs compared to pIs of
the original globulin fraction. Since alkali solubilization
would possibly deamidate susceptible globulin polypeptides, they may appear as part of the glutelin fraction
(Fig. 8). Further investigations in understanding the
molecular, nutritional, and functional properties of Inca
Plant Foods Hum Nutr (2012) 67:247–255
peanut seed proteins would be helpful in utilizing this
protein source for a variety of purposes and are therefore underway.
References
1. FAO Statistical Yearbook (2010) Food and Agricultural Organization, FAOSTAT, Table D.2. Accessed January 14, 2012
2. Derbyshire E, Wright DJ, Boulter D (1976) Review: Legumin and
vicilin, storage proteins of legume seeds. Phytochem 15:3–24
3. Duranti M, Gius C (1997) Legume seeds: Protein content and
nutritional value. Field Crops Res 53:31–45
4. Deshpande SS (1992) Food legumes in human nutrition- a personal
perspective. CRC Crit Rev Food Sci Nutr 32:333–363
5. Sathe SK (2002) Dry bean protein functionality. CRC Crit Rev
Biotechnol 22:175–223
6. Sathe SK, Deshpande SS, Salunkhe DK (1984) Dry beans of
phaseolus: a review. Part I. Proteins. CRC Crit Rev Food Sci Nutr
20:1–46
7. Sathe SK, Deshpande SS, Salunkhe DK (1984) Dry beans of
Phaseolus: A review. Part II. Chemical composition. CRC Crit
Rev Food Sci Nutr 21:41–93
8. Ekanayake S, Jansz ER, Nair BM (2000) Literature review of an
underutilized legume: canavalia gladiata L. Plant Foods Hum
Nutr 55:305–321
9. Schwenke KD (2001) Reflections about the functional potential of
legume proteins. A review. Nahrung 45:377–381
10. Pugalenthi M, Vadivel V, Siddhuraju P (2005) Alternative food/
feed perspectives of an underutilized legume Mucuna pruriens var.
Utilis- A review. Plant Foods Hum Nutr 60:201–218
11. Phillips RD, McWatters KH, Chinnan MS, Hung Y-C, Beuchat
LR, Sakyi-Dawson E, Ngoddy P, Nnanyelugo D, Enwere J,
Komey NS, Liu K, Mensa-Wilmot Y, Nnanna IA, Okeke C,
Prinyawiwatkul W, Saalia FK (2003) Utilization of cowpeas for
human food. Field Crops Res 82:193–213
12. Montoya CA, Lallès J-P, Beebe S, Leterme P (2010) A review:
phaseolin diversity as a possible strategy to improve the nutritional
value of common beans (Phaseolin vulgaris). Food Res Int
43:443–449
13. Sprent JI, Odee DW, Dakora FD (2010) African legumes: A vital
but under-utilized resource. J Exp Bot 61:1257–1265
14. National Academy of Sciences (NAS) (1979) Tropical legumes:
sources for the future. Washington, D. C., pp. 332
15. Bussmann RW, Téllez C, Glenn A (2009) Plukenetia huayllabambana sp. Nov. (Euphorbiaceae) from the upper Amazon of Peru.
Nord J Bot 27:313–315
16. Gillespie LJ (2007) A revision of paleotropical Plukenetia
(Euphorbiaceae) including two new species from Madagascar.
Syst Bot 32:780–802
17. Martínez-Romero MM, Castro-Ramírez AE, Fernández JC (2004)
Use and availability of craft vines in the influence zone of the
biosphere reserve Sian Ka’an, Quintana Roo. Mex Econ Bot
58:83–97
18. Guillèn MD, Ruiz A, Cabo N, Chirinos R, Pascual G (2003)
Characterization of Sacha inchi (Plukenetia volubilis L.) oil by
FTIR spectroscopy and 1H NMR. Comparison with linseed oil. J
Am Oil Chem Soc 80:755–762
19. Hamaker BR, Valles C, Gilman R, Hardmeier RM, Clark D, Garcia
HH, Gonzales AE, Kohlstad I, Castro M, Valdivia R, Rodriguez T,
Lescano M (1992) Amino acid and fatty acid profiles of the Inca
peanut (Plukenetia volubilis). Cereal Chem 69:461–463
20. do Prado IM, Guifrida WM, Alvarez VH, Cabral VF, Quispe-Condori
S, Saldaña MDA, Cardozo-Filho L (2011) Phase equilibrium
Plant Foods Hum Nutr (2012) 67:247–255
21.
22.
23.
24.
25.
26.
27.
28.
29.
30.
measurements of Sacha inchi oil (Plukenetia volubilis) and CO2 at
high pressures. J Am Oil Chem Soc 88:1263–1269
Sathe SK, Hamaker BR, Sze-Tao KWC, Venkatachalam M (2002)
Isolation, purification, and biochemical characterization of a novel
water soluble protein from Inca peanut (Plukenetia volubilis L.). J
Agric Food Chem 50:4906–4908
Friedman M (1996) Nutritional value of proteins from different
food sources. A review. J Agric Food Chem 44:6–29
Sathe SK, Venkatachalam M, Sharma GM, Kshirsagar HH, Teuber
SS, Roux KH (2009) Solubilization and electrophoretic characterization of select edible nut seed proteins. J Agric Food Chem
57:7846–7856
Osborne TB (1924) The vegetable proteins, 2nd edn. Longmans,
Green and Co., London, p 154
Fling SP, Gregerson DS (1986) Peptide and protein molecular
weight determination by electrophoresis using a high-molarity tris
buffer system without urea. Anal Biochem 155:83–88
Sharma GM, Irsigler A, Dhanarajan P, Ayuso R, Bardina L, Sampson
HA, Roux KH, Sathe SK (2011) Cloning and characterization of 2S
albumin, Car i 1, a major allergen in pecan. J Agric Food Chem
59:4130–4139
Official Methods of Analysis 16th ed (1995) Association of Official Analytical Chemists (AOAC): Arlington, VA
Lowry OH, Rosebrough NJ, Farr AL, Randall RJ (1951) Protein
measurement with Folin phenol reagent. J Biol Chem 193:265–
275
Bradford MM (1976) A rapid and sensitive method for the quantitation of microgram quantities of protein utilizing the principle of
protein dye binding. Anal Biochem 72:248–254
Deshpande SS, Cheryan M, Salunkhe DK (1986) Tannin
analysis of food products. CRC Crit Rev Food Sci Nutr
24:401–449
255
31. Ott L (1977) An introductuion to statistical methods and data
analysis. Duxbury Press (a division of Wadsworth Publishing
Co.), Belmont
32. Crowe TW, Johnson LA, Wang T (2001) Characterization of
extruded-expelled soybean flours. J Am Oil Chem Soc 78:775–
779
33. Adsule RN, Kadam SS, Salunkhe DK (1989) Peanut. In: Salunkhe
DK, Kadam SS (eds) Handbook of world food legumes: nutritional
chemistry, processing technology, and utilization, Vol. II, pp. 193–
214
34. Tokusoglu O, Unal MK, Alakir I (2004) Proximate chemical
composition, amino acid and fatty acid properties of sesame seed
flours. J Food Sci Technol (Mysore, India) 41:409–412
35. Güèmes-Vera N, Peña-Bautista RJ, Jiménez-Martínez C,
Dávila-Ortiz G, Calderón Dominguez G (2008) Effective detoxification and decoloration of Lupinus mutabilis seed derivatives, and
effect of thoese derivatives on bread quality and acceptance. J Sci
Food Agric 88:1135–1143
36. Kadam SS, Chougule BA, Salunkhe DK (1989) Lupine. In Handbook of World Food Legumes: Nutritional Chemistry, Processing
Technology, and Utilization, Salunkhe DK and Kadam SS (eds.),
Vol. II, 163–175
37. Cabra V, Arreguin R, Vazques-Duhalt R, Farres A (2007) Effect of
alkaline deamidation on the structure, surface hydrophobicity, and
emulsifying properties of the Z19 α-zein. J Agric Food Chem
55:435–445
38. Zhao J, Tian Z, Chen L (2011) Effects of deamidation on aggregation and emulsifying properties of barley glutelin. Food Chem
128:1029–1036
39. Sathe SK, Salunkhe DK (1981) Solubilization and electrophoretic
characterization of the Great Northern bean (Phaseolus vulgaris L.)
proteins. J Food Sci 46:82–87