meat market in vietnam
Bạn đang xem bản rút gọn của tài liệu. Xem và tải ngay bản đầy đủ của tài liệu tại đây (473.6 KB, 11 trang )
VIETNAM
MEAT
MARKET
Ipsos Business Consulting
Build · Compete · Grow
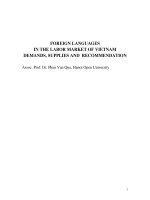
KEY FIGURES OF VIETNAM
93.4
Million people
Capital of Vietnam
HANOI
14th
US$27.6 billion in GDP (+9.24%)
US$3,600 GDP per capita
US$1.4 billion in FDI
Most populated
country
The centre of Central Vietnam
DA NANG US$2.992 billion in GDP (+9.8%)
US$2,908 GDP per capita
US$3.66 billion in FDI
94.5%
Vietnam’s literacy
rate
33.6%
Urban population
in Vietnam
65.8%
Of population is
working age
45-60%
Of total workforce
currently in
agriculture
HO CHI
MINH
CITY
The largest city in Vietnam
US$43 billion in GDP (+9.85%)
US$5,538 GDP per capita
US$39.1 billion in FDI
US$155 billion
Total personal Income
42%
of total expenditure
spent on food,
beverages & tobacco
US$137 billion
Total consumer expenditure
US$2,128
US$198.8
Billion in GDP
One of the fastest-growing
economies in Asia
Ipsos Business Consulting
in GDP per capita
ASEAN’s 6th largest
Livestock Market Value
19% of agricultural production value
+2.6% / 2014
Indonesia’sVietnam
Aquaculture
MeatIndustry
Market | 32
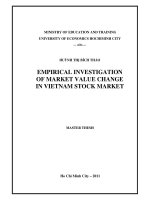
INTRODUCTION
Meat demands are increasing significantly,
whilst production for some types of meat
(poultry and beef) are in shortage.
Consumption
410
2,240
790
745
2,350
2,275
822
775
2,421
433
2,315
863
814
2,493
919
858
2,549
985
910
2,605
1,063
969
2,664
1,154
1,027
2,723
450
487
Production
416
468
506
('000 tonnes)
2,384
2,432
2,517
2,815
5,000 4,000 3,000 2,000 1,000
0
Poultry
Geographical limitations, dependence on
imported feeds, and fragmented farms and
regulations are major limitations of
Vietnam’s sustainable livestock raising.
2013
375
Dependence
on imported
feeds
2014
375
378
387
397
407
Fragmented
farm and
Regulations
2015e
2016f
2017f
Geographical
limitations
2018f
417 2019f
1,000 2,000 3,000 4,000 5,000
Pork
Beef
Constraints in sustainable livestock raising
Figure 1: Production and Consumption of livestock in Vietnam from 2013 to 2019f
Figure 2: Constraints in sustainable livestock raising in Vietnam
Aided by strong growth in both income and population,
Vietnam’s livestock consumption has risen significantly
over the last decade from 3.5 million tonnes in 2013 to
3.6 million tonnes in 2014, and is forecasted to reach 4.5
million tonnes in 2019. Despite the relatively stable trend
of meat industry growth over the past few years, meat
output has not managed to keep up with the consumption
demand. Whilst domestic pork production is relatively
sufficient for the domestic consumption demand, there is
a significant shortage in the supply of beef and chicken.
The deficiency of livestock in Vietnam is due to geographical
limitations, dependence on imported feeds, and fragmented
farms and regulations.
• President of Animal Husbandry Association of Vietnam
– Dr. NGUYEN Dang Vang admitted the limited potential
for cattle raising in Vietnam: “Vietnam has limited
potential in cattle raising for slaughter due to the small
size of its grasslands. Cattle in Vietnam are usually fed
with straw, sugarcane, and cassava, which are not an
optimal solution; they are best raised by grass”.
• Furthermore, sub-sectors such as feed production and
animal breeding are largely dependent on foreign
investment due to the lack of investment by local
companies.
Ipsos Business Consulting
Vietnam Meat Market | 3
• Over 85% of Vietnam’s livestock is raised on small-scale
farms. This arrangement leads to un-scalable production
levels and prices, as well as inconsistence in the quality
of breeders.
• Husbandries are hardly helped by supportive programmes
enacted by legislators. For example, whilst the government
encouraged the application of biological padding in pig
raising, this policy lacked options to control the price
of inputs (e.g: rice husk, sawdust). As a consequence,
the policy led to higher production costs for husbandries
and stagnated the competitive advantages of such
producers.
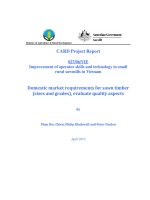
Though pork still remains the main meat
consumed in Vietnam, higher consumption
growth rate presents a positive outlook for
consumption of beef and poultry.
Meat consumed
per capita (kg)
100
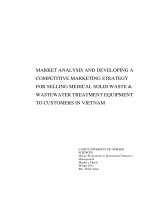
The value of meat imported to Vietnam has
doubled in four years. Bovine meat saw
the strongest increase and accounted for
of total imports.
43.1
45%
18.5
50
10.7
27.0
2010
41.1
41.3
37.1
15.5
0
USA
EU
For both practical and historical reasons, pork is the preferred
meat in Vietnam – although as we will soon see, this may
change in the near future. For example, pigs are part of
the household recycling system for small-scale farms
(a system which accounts for 86% of swine farms in Vietnam)
as they consume inedible waste. This practice therefore
reduces production costs while increasing the number of
suppliers for this type of meat. In addition, pork has long
been the traditionally consumed meat in Vietnam; this
cultural endorsement for pork was influenced by the Chinese,
who felt that eating meat (especially pork) was a symbol
of triumph over hardship. Although pork consumption is
expected to grow at a rate of 3% per annum and continues
to be the dominant meat consumed in Vietnam, a slightly
higher growth rate of 3-5% per annum for beef and poultry
creates a positive outlook for the consumption of these
varieties of meat in the coming years. A higher growth rate
for beef and poultry is a result of a new cultural belief which
is a preference towards foreign and/or imported products.
7.8
22.2
4.4
3.3
China
Vietnam
14.2
9.1
11.6
14.0
6.7
3.7
6.6
2.5
2.0
The flood of imported
meat into Vietnam
5%
2%
Thailand Philippines Indonesia
Figure 3: Meat consumption per capita in selected countries in 2015
Vietnam’s meat industry is still developing and lags far
behind the West, but its solid growth rate means that it
is on track to stand alongside its peers in Asia. Per capita
consumption of meat in Vietnam in 2015 was 33.2kg,
which is considered to be relatively low – just one-third
of that in the US (107kg) and half of the amount within
the EU (76kg). Compared with regional peers, meat
consumption per capita in Vietnam was also lower than
in China (56.4kg) and on par with that of Thailand. However,
beef consumption in Thailand was twice as high as in
Vietnam.
21%
US$96.4mn
72%
Poultry
2014
Pork
Meat of bovine
animals, fresh
or chilled
41%
US$205.6mn
Meat of bovine
animals, frozen
51%
4%
4%
Figure 4: Meat import value by type in 2010 and 2014
Ipsos Business Consulting
MeatIndustry
Market | 34
Indonesia’sVietnam
Aquaculture
With support from trade agreements,
Vietnam has welcomed various new players,
creating a more competitive market
environment for the meat sector.
Falling oil prices, a decrease in local cattle head,
and ongoing demand help explain Vietnam’s
sudden surge in bovine imports. The trend is
expected to continue with the advantageous
climate created by various trade agreements.
90
80
Canada
19%
Australia
US$
1.7mn
US$
8.8mn
31%
0
2010
2011
2012
2013
2014
Others
0.5
0.5
0.2
0.4
0.6
India
13.7
20.6
26.2
29.9
54.9
USA
2.6
4.1
7.4
12.0
16.3
New Zealand
0.4
0.5
0.7
1.0
1.4
Australia
2.9
4.6
9.3
8.6
11.5
Denmark
73%
6% 8%
2010
Australia
19%
Denmark
1%
Netherlands
16%
Germany
Spain
2014
Others
Figure 5: Pork import value in 2010 and 2014
40
10
US$ mn
9% 10%
50
20
Canada
4%
4%
60
30
USA
USA
Frozen bovine meat
70
US$ mn
In 2015, the country’s imported meat value is estimated
to have reached US$234.7 million, an increase of 143%
and 14% compared to 2010 and 2014, respectively. Although
the import value of poultry increased by US$34.8 million
during 2010-14, its contribution to Vietnam’s meat imports
decreased from 72% to 51% whereas the share of bovine
meat rose sharply during the same period. Bovine meat’s
import value saw a four-fold increase from US$25 million
to US$92.5 million. Whilst there was a significant surge in
the total value of imported frozen bovine meat, the fresh/
chilled bovine meat value experienced a slower increase
of about 1.2% per annum. In 2014, the import value of
frozen meat was eleven times higher than the fresh/chilled
category due to lower favour tax (20% for frozen bovine
meat in comparison with 30% for chilled one). Trade
agreements have facilitated the growth of meat importation
in recent years. During the 5-year period from 2010 to 2014,
Vietnam welcomed new players (mostly from the EU region)
and it created a more competitive market environment for
both foreign and local investors.
9
8
7
6
5
4
3
2
1
0
Fresh/chilled bovine meat
2010
2011
2012
2013
2014
Others
1.0
0.1
0.1
0.0
0.2
USA
0.1
0.2
0.3
0.5
0.8
New Zealand
0.8
0.9
1.0
1.2
0.9
Australia
3.2
3.5
3.8
5.0
6.0
Figure 7. Bovine import value in 2010 and 2014
2% 1%
USA
Brazil
Rep. of
Korea
Argentina
1%
7%
8%
1%
USA
7%
Brazil
11%
US$
69.6mn
82%
23%
US$
104.5mn
Rep. of Korea
57%
Poland
France
Others
Others
2010
2014
Figure 6: Poultry import value in 2010 and 2014
Ipsos Business Consulting
In 2014, pork’s import value in Vietnam increased to
US$8.8 million with EU countries such as Denmark, the
Netherlands, Germany and Spain getting a significant
market share. However, as domestic production was in
surplus, Vietnam was able to generate a total pork export
value of US$46.6 million in 2014. Since joining the World
Trade Organisation, subsidy programs to support pork
exports have been gradually withdrawn; as a consequence,
business opportunities are not significant for the export
sector, and are instead limited to fulfilling domestic needs.
Vietnam Meat Market | 5
Bovine meat’s import value saw a nearly four-fold increase
from US$25 million to US$92.5 million during the 2010-14
period, accounting for 45% of the total meat imported to
Vietnam in 2014. The reasons behind this significant increase
are considered to be falling oil prices, a decrease in local
cattle head from 2017-12, and growing demand for beef.
Trade agreements with Australia and New Zealand also
facilitated the wave of imported beef in Vietnam. Instead
of importing meat from bovine animals (which has a tariff
rate of 18%), businesses import live bovine animals (at 2%
import duty) and slaughter them in Vietnam. With the
Trans-Pacific Partnership (TPP) signed in 2016 (yet currently
not in force), competition is anticipated to be more intense,
with import tariffs eliminated for TPP members including
Australia, the US, Japan, and New Zealand. Nevertheless,
from the consumers’ end, trade agreements have little
impact on the reduction of selling price, as tax is not the
only cost component; the largest expense – transportation
– still contributes roughly 25-30% of the total cost incurred.
A MORE OPEN AND
COMPETITIVE MARKET,
YET FULL OF POTENTIAL
Vietnam’s meat market is growing with the involvement
of an increasing number of players. Such changes pose
a threat for local manufacturers, as the price of imports
become more competitive when compared with locally
produced meat. Foreign producers mainly rely on economies
of scale and access to cheap feed which enable them to
enter the market with low prices; Figure 8 compares the
total production cost between locally produced and imported
meat types. At the same time, the dominance of small-scale
farms hampers productivity gains of local producers,
preventing them from competing successfully in the market.
Vietnam’s meat market has become more
price-competitive, with foreign manufacturers
taking advantage of cheap feed and
economies of scale.
Production cost/kg
Meat
types
Domestic
Import
Price
difference
(%)
Beef
US$2.53
US$1.77
30
Chicken
US$1.42-1.47
US$0.92(*)
35-37
* Selling price in Vietnamese market
( )
Figure 8. Production cost comparison between locally produced
and imported meat
In order to combat the wave of imported meat, some largescale local companies have decided to manage the entire
production chain from inputs to production, processing,
distribution and selling to be able to achieve competitive
prices. Dabaco Group (Dabaco) is a typical example that
has successfully applied the “from breeds to table food”
approach. Dabaco aims to develop a strong group in the
agriculture industry, using modern technology and a closed
3F value chain – farming (breeding and farms), feed
(producing livestock feed) and food (meat processing) –
in combination with Dabaco’s supermarkets and fresh food
shops. In 2015, the company reached a total revenue of
nearly US$269 million, an increase of 10% compared to
2014. Hoa Phat Group, one of the leading private industrial
companies in Vietnam, is another good example who has
recently diverted their investment to animal feeds and pigs.
The company aims to expand its pigs production capacity
to one million tons by 2020.
Ipsos Business Consulting
Indonesia’sVietnam
Aquaculture
MeatIndustry
Market | 56
To regain their competitive advantage,
local companies should apply some strategies
such as vertical integration or horizontal
integration, or consider investing in sub-segments
to reduce dependence on imported feed.
Feed Mill
Breeding
Feed
• Imports of meat can only be undertaken by a Vietnamese
company that is officially approved as a trader in meat
and poultry products.
Breeder
Farm
Farm
Contracted
Farming
Processing
Fresh Food
Foodstuff
Added Value
For foreign exporters, the opportunities to invest in Vietnam’s
meat sector are vast considering the shortage of domestic
supply and increasing demand. Figure 10 indicates the six
distribution models usually adopted by food exporters in
Vietnam. Models (1), (2), and (6) are the three most common
practices in Vietnam, where most food importers are also
distributors. These models are preferable for exporting to
Vietnam as they involve fewer intermediaries. When entering
Vietnam, foreign exporters often choose to work with local
importers rather than establishing their own entities in
Vietnam, for several reasons:
Processed
Food
Trademark
& Market
• Local importers continue to play a major role in distributing
and promoting imported products in Vietnam. Typically,
local importers have their own sales agents and distribution
fleet and are in direct contact with supermarkets,
wholesalers, and in many cases, also with thousands
of small-scale grocery stores.
• Import procedures and processes are complex and
need careful attention.
Though the opportunities are vast, foreign
exporters should be aware of the complicated
nature of import procedures in order to select
the most suitable distribution channels.
(1)
(2)
Figure 9. Dabaco’s value chain
Besides the above-mentioned approach, local companies
should consider the following strategies for long-term and
sustainable development:
• Building up horizontal linkages, which can create large
-scale enterprises that attract smaller-scale households
and firms as satellites.
• Growing feed crops to reduce the degree of dependence
on imported feed.
• Selecting and raising livestock in accordance with the
region’s geographical advantages.
Ipsos Business Consulting
Local
importers/
Distributors
(3)
Food
processors
Wholesalers
(4)
Exporters
Local
Wholesalers/
Distributors
(5)
Agent
Traditional
sales channel/
Modern
sales channel
(6)
Small/
household
food
processors
Figure 10. Typical trade distribution channels
MeatIndustry
Market | 67
Indonesia’sVietnam
Aquaculture
CONCLUSION
Vietnam’s rising population, income levels, changing cultural
preferences and new trade agreements have opened up
the door to significant growth in the meat industry (which
consumption is expected to reach 4.5 million tonnes in
2019). Whilst the supply of pork can fulfil domestic needs,
the country relies on imports to fulfil its beef and poultry
demand; these sub-segments also exhibit promising
investment potential, given their annual growth rates of
3-5%. Trade agreements and the benefit of economies of
scale have allowed an increasing number of foreign players
to join this lucrative sector in Vietnam. With so many of
the right pieces in place, and the country’s growing economy
set to yield a large reward for any company that efficiently
delivers what the public is already demanding, opportunities
are ripe for investors with a clear-headed approach to further
developing Vietnam’s meat industry.
Ipsos Business Consulting
Indonesia’sVietnam
Aquaculture
MeatIndustry
Market | 78
REFERENCES
[1]
[2]
[3]
[4]
[5]
[6]
[7]
[8]
[9]
[10]
[11]
[12]
[13]
[14]
[15]
[16]
[17]
[18]
[19]
[20]
[21]
[22]
[23]
[24]
Arita, S. S., & Dyck, J. (2014). Vietnam’s Agri-Food Sector and the Trans-Pacific Partnership.
United States Department of Agriculture.
Beef Central. (2015). Southeast Asia Report: Supply, Prices Hurdles for Indo | Viet, Thai Eye Brazilian Imports.
Retrieved from: />-indo-viet-thai-eye-brazilian-imports
Bloomberg Business. (2015). Chicken War With U.S. Shows Free Trade Threat to Vietnam Farmers.
Retrieved from: />-threat-to-vietnam-farmers
Bao Chinh Phu. (2013). Why has livestock raising using biological padding not been popular? Retrieved from:
/>Business Insider. (2014). China’s Pork Obsession Is Endangering The World. Retrieved from:
/>Business Monitor International. (2015). Vietnam Agribusiness Report Q1 2016. BMI Research.
FAPRI. (2011). 2012 World Agricultural Outlook. National Institute of Food and Agriculture,
U.S. Department of Agriculture.
Ha Long Canned Food Joint Stock Corporation. (2014). Financial Report 2014.
Mebipha. (2015). Vietnam’s Bovine Market: Supply Cannot Meet Demand. Retrieved from:
/>Nguyen, K. (2015). Dabaco Group. SSI Research, Institutional Research & Investment Advisory
Nguyen, D. M. (2014). Pig Production and Marketing in Vietnam. Hanoi: National Institute of Animal Science (NIAS).
Pham, H. V. (2015). Improving the likelihood of small farmers in Vietnam Pig Value Chain: Experiences in
the north of VIETNAM. Vietnam National University of Agriculture.
Thanh Nien News. (2015). TPP to deal big blow to Vietnam livestock industry. Retrieved from:
/>The Consultative Group for International Agricultural Research. (2014). Smallholder Pig Value Chain Development
in Vietnam: Situation Analysis and Trends.
Trung, D., & Hilmarsson, H. (2013). Food Processing in Vietnam - Where is the potential for High-Value Export?
University of Akureyri, School of Business and Science.
United Nation Statistic Division. (2016, 1 25). UN Comtrade Database. Retrieved from />USDA Foreign Agriculture Service. (2015). GAIN Report – Food and Agricultural Import Regulations and Standards.
USDA Foreign Agriculture Service. (2015). GAIN Report - Vietnam Exporter Guide 2015.
USDA Foreign Agriculture Service. (2015). GAIN Report - Vietnam Food Processing Ingredients.
USDA. (2014). Vietnam’s Agri-food Sector and the Trans-Pacific Partnership.
VEPR. (2015). The Impacts of TPP and AEC on the Vietnamese Economy: Macroeconomic Aspects and the Livestock
Sector. Hanoi: University of Economics and Business - Vietnam National University.
Vietnam Supply Chain. (2013). Food Supply Chains in Vietnam.
Vissan Limited Company. (2015). Financial Report 9M 2015.
VPBank Securities. (2015). Dabaco Group.
Ipsos Business Consulting
Vietnam Meat Market | 9
ABOUT IPSOS BUSINESS CONSULTING
Ipsos Business Consulting is the specialist consulting
division of Ipsos, which is ranked third in the global research
industry. With a strong presence in 87 countries, Ipsos
employs more than 16,000 people.
We have the ability to conduct consulting engagements
in more than 100 countries. Our team of consultants has
been serving clients worldwide through our 21 consulting
"hubs" since 1994. Our suite of solutions has been developed
using over 20 years experience of working on winning sales
and marketing strategies for developed and emerging markets.
There is no substitute for first-hand knowledge when it
comes to understanding an industry. We draw on the detailed
industry expertise of our consultants, which has been
accumulated through practical project execution.
Founded in France in 1975, Ipsos is controlled and
managed by research and consulting professionals. They
have built a solid Group around a multi-specialist positioning.
Ipsos is listed on Eurolist - NYSE-Euronext. The company
is part of the SBF 120 and the Mid-60 index and is eligible
for the Deferred Settlement Service (SRD).ISIN code
FR0000073298, Reuters ISOS.PA, Bloomberg IPS:FP
Build · Compete · Grow
At Ipsos Business Consulting we focus on maintaining our
position as a leading provider of high quality consulting
solutions for sales and marketing professionals. We deliver
information, analysis and recommendations that allow our
clients to make smarter decisions and to develop and
implement winning market strategies.
We believe that our work is important. Security, simplicity,
speed and substance applies to everything we do.
Through specialisation, we offer our clients a unique depth
of knowledge and expertise. Learning from different
experiences gives us perspective and inspires us to boldly
call things into question, to be creative.
By nurturing a culture of collaboration and curiosity, we
attract the highest calibre of people who have the ability
and desire to influence and shape the future.
Our Solutions
· Go-to-Market
· Business Unit Strategy
· Competitive Insights
· Partner Evaluation
· Innovation Scouting
· Optimal Channel Strategy
· Market Sizing
· Pricing
· Forecasting
· Brand Strategy & Value
· Sales Detector
· B2B Customer
Segmentation
AUTHORS OF THIS PAPER
Dung Nguyen
Khanh Ngo
Senior Consultant, Vietnam
E.
T. +84 8 38329820
Associate Consultant, Vietnam
E.
T. +84 8 38329820
CONTACT US
AUSTRALIA
INDONESIA
SOUTH AFRICA
Level 13, 168 Walker Street
North Sydney 2060
NSW, Australia
E.
T. 61 (2) 9900 5100
Graha Arda, 3rd Floor
Jl. H.R. Rasuna Said Kav B-6, 12910
Kuningan
Jakarta, Indonesia
E.
T. 62 (21) 527 7701
Wrigley Field The Campus
57 Sloane Street Bryanston
Johannesburg, South Africa
E.
T. 27 (11) 709 7800
GREATER CHINA
BEIJING
12th Floor, Union Plaza
No. 20 Chao Wai Avenue
Chaoyang District, 100020
Beijing, China
E.
T. 86 (10) 5219 8899
SHANGHAI
31/F Westgate Mall
1038 West Nanjing Road 200041
Shanghai, China
E.
T. 86 (21) 2231 9988
WUHAN
10F HongKong & Macao Center
118JiangHan Road
HanKou Wuhan, 430014
Wuhan, China
E.
T. 86 (27) 5988 5888
HONG KONG
22/F Leighton Centre
No 77 Leighton Road
Causeway Bay
Hong Kong
E.
T. 852 3766 2288
INDIA
MUMBAI
Lotus Corporate Park
1701, 17th Floor, F Wing
Off Western Express Highway
Goregoan (E),
Mumbai – 400063, India
E.
T. 91 (22) 6620 8000
GURGAON
801, 8th Floor, Vipul Square
B-Block, Sushant Lok, Part-1
Gurgaon – 122016, Haryana,
India
E.
T. 91 (12) 4469 2400
JAPAN
Hulic Kamiyacho Building
4-3-13, Toranomon
Minato-ku, 105-0001
Tokyo, Japan
E.
T. 81 (3) 6867 8001
KENYA
Acorn House
97 James Gichuru Road Lavington
P.O. Box 68230
00200 City Square
Nairobi, Kenya
E.
T. 254 (20) 386 2721-33
MALAYSIA
18th Floor, Menara IGB
No. 2 The Boulevard
Mid Valley City
Lingkaran Syed Putra, 59200
Kuala Lumpur, Malaysia
E.
T. 6 (03) 2282 2244
NIGERIA
Block A, Obi Village
Opposite Forte Oil
MM2 Airport Road, Ikeja
Lagos, Nigeria
E.
T. 234 (806) 629 9805
PHILIPPINES
1401-B, One Corporate Centre
Julia Vargas cor. Meralco Ave
Ortigas Center, Pasig City, 1605
Metro Manila, Philippines
E.
T. 63 (2) 633 3997
SINGAPORE
3 Killiney Road #05-01
Winsland House I, S239519
Singapore
E.
T. 65 6333 1511
www.ipsosconsulting.com
SOUTH KOREA
12th Floor, Korea Economic
Daily Building, 463 Cheongpa-Ro
Jung-Gu 100-791
Seoul, South Korea
E.
T. 82 (2) 6464 5100
THAILAND
21st and 22nd Floor, Asia Centre Building
173 Sathorn Road South
Khwaeng Tungmahamek
Khet Sathorn 10120
Bangkok, Thailand
E.
T. 66 (2) 697 0100
UAE
4th Floor, Office No 403
Al Thuraya Tower 1
P.O. Box 500611
Dubai Media City, UAE
E.
T. 971 (4) 4408 980
UK
3 Thomas More Square
London E1 1YW
United Kingdom
E.
T. 44 (20) 3059 5000
USA
Time & Life Building
1271 Avenue of the Americas
15th Floor
New York, NY10020
United States of America
E.
T. 1 (212) 265 3200
VIETNAM
Level 9A, Nam A Bank Tower
201-203 CMT8 Street, Ward 4
District 3
HCMC, Vietnam
E.
T. 84 (8) 3832 9820
Ipsos Business Consulting