OECD african economic outlook
Bạn đang xem bản rút gọn của tài liệu. Xem và tải ngay bản đầy đủ của tài liệu tại đây (14.86 MB, 425 trang )
2004
African Economic Outlook
The African Economic Outlook is a joint project between the African Development Bank and the OECD
Development Centre. The project, generously supported by the European Commission, combines the
expertise accumulated by the OECD, which produces the OECD Economic Outlook twice a year, and the
knowledge of the African Development Bank on African economies. The objective is to review annually the
recent economic situation and the short-term likely evolutions of selected African countries. The Outlook is
drawn from a country-by-country analysis based on a unique analytical design. This common framework
includes a forecasting exercise for the current and the two following years using a simple macroeconomic
model, together with an analysis of the social and political context. It also contains a comparative synthesis
of African country prospects, placing the evolution of African economies in the world economic context. A
statistical appendix completes the volume. Decision makers in African and OECD countries, both in the
public and private sectors, such as aid agencies, investors, and government officials of aid-recipient
countries, will all find this volume of significant interest.
«
African
Economic
Outlook
COUNTRIES COVERED
• ALGERIA • BOTSWANA • BURKINA FASO • CAMEROON • CÔTE D’IVOIRE • EGYPT • ETHIOPIA • GABON
• GHANA • KENYA • MALI • MAURITIUS • MOROCCO • MOZAMBIQUE • NIGERIA • SENEGAL • SOUTH AFRICA
• TANZANIA • TUNISIA • UGANDA • ZAMBIA • ZIMBABWE
This book is available to subscribers to the following SourceOECD themes:
Emerging Economies
Development
Ask your librarian for more details on how to access OECD books on line, or write to us at
African Economic Outlook
OECD's books, periodicals and statistical databases are now available via www.SourceOECD.org, our online library.
www.oecd.org
This work is published under the auspices of the OECD
Development Centre. The Centre promotes comparative
development analysis and policy dialogue, as described at:
www.oecd.org/dev
2003/2004
ISBN 92-64-01624-4
41 2004 04 1 P
-:HSTCQE=UV[WY]:
AFRICAN DEVELOPMENT BANK
African
Economic Outlook
AFRICAN DEVELOPMENT BANK
DEVELOPMENT CENTRE OF THE ORGANISATION
FOR ECONOMIC CO-OPERATION AND DEVELOPMENT
ORGANISATION FOR ECONOMIC CO-OPERATION AND DEVELOPMENT
2
Pursuant to Article 1 of the Convention signed in Paris on 14th December 1960, and which came into force
on 30th September 1961, the Organisation for Economic Co-operation and Development (OECD) shall
promote policies designed:
– to achieve the highest sustainable economic growth and employment and a rising standard of living in Member
countries, while maintaining financial stability, and thus to contribute to the development of the world
economy;
– to contribute to sound economic expansion in Member as well as non-member countries in the process of
economic development; and
– to contribute to the expansion of world trade on a multilateral, non-discriminatory basis in accordance
with international obligations.
The original Member countries of the OECD are Austria, Belgium, Canada, Denmark, France, Germany,
Greece, Iceland, Ireland, Italy, Luxembourg, the Netherlands, Norway, Portugal, Spain, Sweden, Switzerland,
Turkey, the United Kingdom and the United States. The following countries became Members subsequently through
accession at the dates indicated hereafter: Japan (28th April 1964), Finland (28th January 1969), Australia (7th
June 1971), New Zealand (29th May 1973), Mexico (18th May 1994), the Czech Republic (21st December
1995), Hungary (7th May 1996), Poland (22nd November 1996), Korea (12th December 1996) and the Slovak
Republic (14th December 2000). The Commission of the European Communities takes part in the work of the
OECD (Article 13 of the OECD Convention).
The Development Centre of the Organisation for Economic Co-operation and Development was established by
decision of the OECD Council on 23rd October 1962 and comprises twenty-three Member countries of the OECD:
Austria, Belgium, Canada, the Czech Republic, Denmark, Finland, France, Germany, Greece, Iceland, Ireland, Italy,
Korea, Luxembourg, Mexico, the Netherlands, Norway, Portugal, Slovak Republic, Spain, Sweden, Switzerland, as
well as Chile since November 1998 and India since February 2001. The Commission of the European Communities
also takes part in the Centre’s Governing Board.
The purpose of the Centre is to bring together the knowledge and experience available in Member countries of both
economic development and the formulation and execution of general economic policies; to adapt such knowledge and
experience to the actual needs of countries or regions in the process of development and to put the results at the disposal
of the countries by appropriate means.
The Centre is part of the “Development Cluster” at the OECD and enjoys scientific independence in the execution
of its task. As part of the Cluster, together with the Centre for Co-operation with Non Members, the Development Cooperation Directorate, and the Sahel and West Africa Club, the Development Centre can draw upon the experience
and knowledge available in the OECD in the development field.
THE OPINIONS EXPRESSED AND ARGUMENTS EMPLOYED IN THIS PUBLICATION ARE THE SOLE RESPONSIBILITY OF THE AUTHORS AND DO NOT
NECESSARILY REFLECT THOSE OF THE OECD OR OF THE GOVERNMENTS OF ITS MEMBER COUNTRIES.
*
**
Publié en français sous le titre :
PERSPECTIVES ÉCONOMIQUES EN AFRIQUE
Permission to reproduce a portion of this work for non-commercial purposes or classroom use should be obtained through the
Centre français d’exploitation du droit de copie (CFC), 20, rue des Grands-Augustins, 75006 Paris, France, tel. (33-1) 44 07
47 70, fax (33-1) 46 34 67 19, for every country except the United States. In the United States permission should be obtained
through the Copyright Clearance Center, Customer Service, (508)750-8400, 222 Rosewood Drive, Danvers, MA 01923
USA, or CCC Online: www.copyright.com. All other applications for permission to reproduce or translate all or part of this
book should be made to OECD Publications, 2, rue André-Pascal, 75775 Paris Cedex 16, France.
African Economic Outlook
© AfDB/OECD 2004
THE AFRICAN DEVELOPMENT BANK GROUP
The African Development Bank Group is a regional multilateral development finance institution the members
of which are all of the 53 countries in Africa and 25 countries from Asia, the Middle East, Europe, North and
South America. The purpose of the Bank is to further the economic development and social progress of African
countries, individually and collectively. To this end, the Bank promotes the investment of public and private
capital for development, primarily by providing loans and grants for projects and programs that contribute to
poverty reduction and broad-based sustainable development in Africa.
The non-concessional operations of the Bank are financed from its ordinary capital resources. In addition,
the Bank’s soft window affiliates – the African Development Fund and the Nigeria Trust Fund – provide
concessional financing to low-income countries that are not able to sustain loans on market terms.
By the end of 2003, the African Development Bank Group cumulatively approved 2 786 loans and grants
for commitments amounting to over $44.2 billion. The commitments were made to 52 regional member
countries and various national and regional institutions to support development projects and programmes in
agriculture, education, health, transport, public utilities, and industry sectors. Since the mid-1980s, a significant
share of commitments has also gone to promoting economic reform and adjustment programmes that help to
accelerate socio-economic development. About two-thirds of total Bank Group commitments were financed on
non-concessional terms, while the balance benefited from concessional financing.
© AfDB/OECD 2004
African Economic Outlook
3
Foreword
Foreword
The African Economic Outlook project is a joint initiative of the African Development Bank and the OECD
Development Centre. The Report was essentially drafted by a core team drawn from both institutions, supported
by resource people in selected countries.
A generous grant from the Commission of the European Communities was essential to initiating and
sustaining the project.
4
African Economic Outlook
© AfDB/OECD 2004
Table of Contents
African Economic Outlook
Foreword . . . . . . . . . . . . . . . . . . . . . . . . . . . . . . . . . . . . . . . . . . . . . . . . . . . . . . . . . . . . . . . . . . . . . . . . 4
Acknowledgements. . . . . . . . . . . . . . . . . . . . . . . . . . . . . . . . . . . . . . . . . . . . . . . . . . . . . . . . . . . . . . . . . 6
Preface . . . . . . . . . . . . . . . . . . . . . . . . . . . . . . . . . . . . . . . . . . . . . . . . . . . . . . . . . . . . . . . . . . . . . . . . . . 7
Part One: Overview . . . . . . . . . . . . . . . . . . . . . . . . . . . . . . . . . . . . . . . . . . . . . . . . . . . . . . . . . . . . . . . . 9
• The International Environment . . . . . . . . . . . . . . . . . . . . . . . . . . . . . . . . . . . . . . . . . . . . . . . . . . . . . 14
• Macroeconomic Performance in Africa . . . . . . . . . . . . . . . . . . . . . . . . . . . . . . . . . . . . . . . . . . . . . . . 22
• The Millennium Development Goals: Progress Report . . . . . . . . . . . . . . . . . . . . . . . . . . . . . . . . . . . 29
• Governance and Political Issues . . . . . . . . . . . . . . . . . . . . . . . . . . . . . . . . . . . . . . . . . . . . . . . . . . . . . 33
• Energy Supply and Poverty . . . . . . . . . . . . . . . . . . . . . . . . . . . . . . . . . . . . . . . . . . . . . . . . . . . . . . . . 37
• Electricity Sector Reforms . . . . . . . . . . . . . . . . . . . . . . . . . . . . . . . . . . . . . . . . . . . . . . . . . . . . . . . . . 44
Part Two: Country Studies . . . . . . . . . . . . . . . . . . . . . . . . . . . . . . . . . . . . . . . . . . . . . . . . . . . . . . . . 51
• Algeria . . . . . . . . . . . . . . . . . . . . . . . . . . . . . . . . . . . . . . . . . . . . . . . . . . . . . . . . . . . . . . . . . . . . . . . . 53
• Botswana . . . . . . . . . . . . . . . . . . . . . . . . . . . . . . . . . . . . . . . . . . . . . . . . . . . . . . . . . . . . . . . . . . . . . . 65
• Burkina Faso . . . . . . . . . . . . . . . . . . . . . . . . . . . . . . . . . . . . . . . . . . . . . . . . . . . . . . . . . . . . . . . . . . . 79
• Cameroon . . . . . . . . . . . . . . . . . . . . . . . . . . . . . . . . . . . . . . . . . . . . . . . . . . . . . . . . . . . . . . . . . . . . . 93
• Côte d’Ivoire . . . . . . . . . . . . . . . . . . . . . . . . . . . . . . . . . . . . . . . . . . . . . . . . . . . . . . . . . . . . . . . . . . 105
• Egypt. . . . . . . . . . . . . . . . . . . . . . . . . . . . . . . . . . . . . . . . . . . . . . . . . . . . . . . . . . . . . . . . . . . . . . . . 119
• Ethiopia. . . . . . . . . . . . . . . . . . . . . . . . . . . . . . . . . . . . . . . . . . . . . . . . . . . . . . . . . . . . . . . . . . . . . . 133
• Gabon . . . . . . . . . . . . . . . . . . . . . . . . . . . . . . . . . . . . . . . . . . . . . . . . . . . . . . . . . . . . . . . . . . . . . . . 147
• Ghana . . . . . . . . . . . . . . . . . . . . . . . . . . . . . . . . . . . . . . . . . . . . . . . . . . . . . . . . . . . . . . . . . . . . . . . 161
• Kenya . . . . . . . . . . . . . . . . . . . . . . . . . . . . . . . . . . . . . . . . . . . . . . . . . . . . . . . . . . . . . . . . . . . . . . . 177
• Mali. . . . . . . . . . . . . . . . . . . . . . . . . . . . . . . . . . . . . . . . . . . . . . . . . . . . . . . . . . . . . . . . . . . . . . . . . 193
• Mauritius. . . . . . . . . . . . . . . . . . . . . . . . . . . . . . . . . . . . . . . . . . . . . . . . . . . . . . . . . . . . . . . . . . . . . 207
• Morocco . . . . . . . . . . . . . . . . . . . . . . . . . . . . . . . . . . . . . . . . . . . . . . . . . . . . . . . . . . . . . . . . . . . . . 219
• Mozambique . . . . . . . . . . . . . . . . . . . . . . . . . . . . . . . . . . . . . . . . . . . . . . . . . . . . . . . . . . . . . . . . . . 233
• Nigeria. . . . . . . . . . . . . . . . . . . . . . . . . . . . . . . . . . . . . . . . . . . . . . . . . . . . . . . . . . . . . . . . . . . . . . . 247
• Senegal . . . . . . . . . . . . . . . . . . . . . . . . . . . . . . . . . . . . . . . . . . . . . . . . . . . . . . . . . . . . . . . . . . . . . . 261
• South Africa. . . . . . . . . . . . . . . . . . . . . . . . . . . . . . . . . . . . . . . . . . . . . . . . . . . . . . . . . . . . . . . . . . . 275
• Tanzania . . . . . . . . . . . . . . . . . . . . . . . . . . . . . . . . . . . . . . . . . . . . . . . . . . . . . . . . . . . . . . . . . . . . . . 295
• Tunisia. . . . . . . . . . . . . . . . . . . . . . . . . . . . . . . . . . . . . . . . . . . . . . . . . . . . . . . . . . . . . . . . . . . . . . . . 309
• Uganda . . . . . . . . . . . . . . . . . . . . . . . . . . . . . . . . . . . . . . . . . . . . . . . . . . . . . . . . . . . . . . . . . . . . . . 323
• Zambia . . . . . . . . . . . . . . . . . . . . . . . . . . . . . . . . . . . . . . . . . . . . . . . . . . . . . . . . . . . . . . . . . . . . . . . 337
• Zimbabwe . . . . . . . . . . . . . . . . . . . . . . . . . . . . . . . . . . . . . . . . . . . . . . . . . . . . . . . . . . . . . . . . . . . . . 355
Part Three: Statistical Annex . . . . . . . . . . . . . . . . . . . . . . . . . . . . . . . . . . . . . . . . . . . . . . . . . . . . . 373
© AfDB/OECD 2004
African Economic Outlook
5
Acknowledgements
Acknowledgements
The African Economic Outlook was prepared by a team led by Jean-Claude Berthélemy and Mohammed
Nureldin Hussain. In addition to the managers, the core team was composed of Barfour Osei, Obadiah Mailafia
and Beejaye Kokil at the Development Research Department of the African Development Bank and Céline
Kauffmann, Nicolas Pinaud, Christine Rosellini and Lucia Wegner at the OECD Development Centre.
The comparative synthesis of the Report was drafted by Jean-Claude Berthélemy, Mohammed Nureldin Hussain,
Céline Kauffmann, Barfour Osei and Lucia Wegner.
6
The country notes were drafted by Bernard Aigobkhan, Sémi Cherif, Céline Kauffmann, Barfour Osei,
Nicolas Pinaud, Christine Rosellini, Audrey Verdier-Chouchane, Patrice Wadja and Lucia Wegner. The work on
the country notes greatly benefited from the valuable contributions of local consultants: Jerome Afeikhena (South
Africa), Rose Aiko (Tanzania), William Bekoe (Ghana), Mahmoud Ben Sassi (Tunisia), Abdelhakim Berrah
(Algeria), Veepin Bhowon (Mauritius), Mukoma Kandeke (Zambia), Tiegist Lemma (Ethiopia), Moubarack Lo
(Senegal), Luis Magaco Jr. (Mozambique), Oumar Makalou (Mali), E.S.K. Muwanga-Zake (Uganda), Kouadio
N’dri (Côte d’Ivoire), Maryclaire Hiuko Ngari (Kenya), Robert Ngonthe (Cameroun), Christopher Nwobike
(Nigeria), Modeste Mfa Obiang (Gabon), Elie Ouedraogo (Burkina Faso), Malak Ali Reda (Egypt), Trevor
Simumba (Zambia) and Dirk Ernst Van Seventer (South Africa).Valuable inputs were provided by Andrea
Goldstein, Johannes Jütting and Henri-Bernard Solignac Lecomte of the OECD Development Centre and by
Koua Louis Kouakou and Fetor Komlan at the ADB Development Research Department.
The macroeconomic framework used to produce the projections was updated and managed by Céline
Kauffmann at the OECD Development Centre and Beejaye Kokil at the African Development Bank. The
statistical annex is the product of joint work carried out by Beejaye Kokil and Céline Kauffmann. The project
also benefited from crucial research assistance conducted by Aleksandra Bogusz, Federica Marzo and Raphaël
Soulignac at the OECD Development Centre and Mboya Deloubassou, Koua Louis Kouakou and Fetor Komlan
at the ADB Development Research Department.
A large number of African government representatives, private sector colleagues and civil society members
provided extremely valuable inputs and comments. Several institutions also contributed to the project at various
stages: the Macroeconomics Studies Division of the Agence Française de Développement, the ADB country desks,
the International Energy Agency Statistics Division, the IMF African Department, the OECD Economics
Department, the OECD Development Co-operation Directorate and the World Bank Economic and Prospects
Group. The OECD Development Centre’s Publications/Communication Unit, led by Colm Foy, was responsible
for transforming the manuscript into the publication.
The Outlook was prepared under the overall guidance of Ulrich Hiemenz, Deputy Director, OECD
Development Centre and Henock Kifle, Director, ADB Development Research Department.
African Economic Outlook
© AfDB/OECD 2004
Preface
Preface
This is the third edition of our joint African Economic Outlook, a project initiated by the African Development Bank and
the OECD Development Centre, with the strong support of the European Commission. The aim with this edition, as with
the two that have preceded it, is to provide a tool for understanding current economic and social conditions and for
highlighting the development prospects for the African continent.
The AEO team comprises staff from our two institutions as well as local analysts. They have used the same, proven methodology
as in the past to produce the 22 country reviews and short-term forecasts employing a single, unique model. In this way, the
analysis is made truly comparative in the tradition of the OECD’s Economic Outlook.
The scientific and intellectual rigour with which the AEO has been prepared gives it a legitimacy that has been recognised
by its users in the worlds of business, academia, politics and public affairs. The Outlook has thus made a concrete contribution
towards the understanding of African economies, and to more informed policy making and investment decisions.
While dispelling myths, the AEO still reminds us of some of the development challenges facing African countries. The
country studies and the overall analysis carry much good news about civil peace and economic progress, identifying policies
that work and those that do not, but they also remind us of the human dimensions of the challenges still facing the peoples
of Africa. These challenges can be viewed to a large extent through the lens of the United Nations’ Millennium Development
Goals. As with last year’s AEO, we are forced to recognise that few African countries will achieve any of the MDGs by 2015.
This is indeed disappointing, and a cause that both Africa’s leaders and the international community, including our own
organisations, need to take up with renewed determination.
On the positive side, the improvement of the international economic environment, relative to 2002, carried some good
news for African countries. Internally, with the calming of conflicts in key areas such as the Great Lakes region, major reforms
by African governments, progress on the NEPAD agenda, African countries are poised to take advantage of the improved
external environment. Indeed, in many countries, we see improvements in the management of the economy, in the business
environment and in increasing respect for institutions, alongside recognition that growth must be accompanied by poverty
reduction and the improvement and extension of basic social services. The international donor community is also showing
increased interest for Africa’s development, as evidenced by the positive evolution of aid budgets in recent years, unprecedented
in the last decade.
The special theme of this year’s Outlook is energy supply. We find that, despite the substantial contribution energy can
make to almost every walk of life – from demography to democracy, from education to employment, from gender equality
to growth and from investment to integration – the energy potential of the continent is sorely under-exploited. There is room
for huge improvements in this field and a wealth of opportunity for both entrepreneurs and their current and potential customers.
We are confident that this edition of the AEO will prove to be as useful as its predecessors to the policy-making and
business communities, as well as to all those concerned with African development. In the context of the current renewed cooperation between African leaderships for the reform of governance, for growth and for poverty alleviation – as evidenced in
the start-up of NEPAD’s African Peer Review Mechanism — it will be an essential input to their deliberations.
Louka T. Katseli
Director
OECD Development Centre
Paris
© AfDB/OECD 2004
April 2004
Omar Kabbaj
President
African Development Bank
Tunis
African Economic Outlook
7
Part One
Overview
This third edition of African Economic Outlook
assesses economic changes on the continent primarily
through in-depth analysis of 22 countries, which
together account for two-thirds of Africa’s population
and three-quarters of its gross domestic product. They
are the same countries surveyed in the 2002/03 edition
of the AEO:
• North Africa: Algeria, Egypt, Morocco and
Tunisia.
• West Africa: Burkina Faso, Côte d’Ivoire, Ghana,
Mali, Nigeria and Senegal.
• Central Africa: Cameroon and Gabon.
• East Africa: Ethiopia, Kenya, Mauritius, Uganda
and Tanzania.
• Southern Africa: South Africa, Botswana,
Mozambique, Zambia and Zimbabwe.
Our comparative assessment also provides a
continent-wide perspective, drawing on data from the
African Development Bank and other international
financial institutions. The first two parts of this overview
deal with the international environment faced by African
economies and their macroeconomic performance.
After the sharp slowdown in developed countries
in 2001, the world economy has recovered, growing
by 3 per cent in 2002 and 3.9 per cent in 20031 with
the improvement accounted for mainly by economic
growth in developing countries. Africa’s growth rate,
in 2003, at 3.6 per cent, was the highest for the last
four years, and significantly higher than the 2.7 per cent
growth rate recorded in 20022. This improved economic
growth rate was achieved despite the weak growth in
the world economy and despite continued structural
and political constraints to improved economic
performance in some parts of the continent.
This recovery, nearly one percentage point better
than in 2002, was partly due to good prices for several
of Africa’s raw material exports, including farm products,
energy and minerals. It was also helped by a significant
increase in public development aid to Africa after the
launch of NEPAD and the successful Monterrey
Conference on Financing for Development in 2002.
Other factors contributing to the relatively better
performance were improved economic fundamentals
and the restoration of peace, albeit fragile, in some parts
of the continent, notably the Great Lakes region, Angola
and West Africa. However, the civil war in Côte d’Ivoire
that broke out following the September 2002 failed coup,
continues to impose major constraints on the socioeconomic situation of the country and its neighbours.
Judging by the probable trend in raw material
prices and renewed growth in OECD countries, it is
expected that the average growth of 2003 will hold
up in 2004 and perhaps rise to 4 per cent in 2005,
certainly far below the rate required for reducing
poverty and attaining the internationally agreed
Millennium Development Goals (MDGs).
Nonetheless, Africa’s average economic growth could
be said to be more favourable now than it was in the
first years of the decade.
The next part of this Overview confirms the
diagnosis of last year’s AEO, to the effect that Africa
is, overall, rather far from achieving the MDGs. This
year we make a more in-depth analysis and examine
several MDG targets and their representative indicators,
covering poverty and hunger, health and education. The
Outlook highlights the continent-wide improvements
that NEPAD can be expected to bring in this domain
and discusses recent developments in governance at
the level of national governments in Africa. It is to be
1. Source IMF (2004), World Economic Outlook, April.
2. These figures come from the AEO data base. They exclude Liberia, Libya and Somalia. See Table 1 and Appendix below.
© AfDB/OECD 2004
African Economic Outlook
13
Overview
recalled that NEPAD represents a pledge by African
leaders, based on a common vision and a firm and
shared conviction, that they have a duty to eradicate
poverty and to place their countries on a path of
sustainable growth and development.
However, the challenges that lie ahead are daunting.
There is a need for African countries to co-ordinate the
implementation of NEPAD and, in particular, ensure
that efforts are directed towards accelerated growth
and poverty reduction. To this end, they need to
strengthen the foundations of development by
promoting good economic and political governance.
In particular they need to uphold the standards and
norms of democratic governance and sound public
management. These commitments will need to be
complemented by adequate international assistance.
14
Each year the Outlook provides an in-depth analysis
of an important topic critical for Africa’s development
prospects. In this year’s edition the focus is on the
energy sector, following last year’s focus on the issue
of privatisation. Each country profile covered by the
Outlook analyses the energy sector and discusses the main
policy issues involved. The Outlook also examines
Africa’s energy potential and how it has remained
virtually under-utilised, even though an adequate and
accessible supply of modern energy to households and
production entities is crucial to the process of socioeconomic development, and, hence, to the attainment
of the MDGs. In the absence of adequate modern
energy supplies, households tend to use mostly biomass,
which produces very little energy, impacts negatively
on health and quality of life and helps deplete ecological
resources in many countries where firewood is routinely
used. The fact that most people do not use modern
energy sources also deprives producers of access to
efficient production technology and deprives individuals
of access to vital services that can improve their lives,
such as public and home lighting, refrigerated
conservation of food, medicine and vaccines and access
to information through radio and TV.
The electricity sector is key because of the many
services it provides. It also has a political economy
dimension surrounding its production and distribution.
The chapter closes by evaluating the policies that have
been implemented in recent years to modernise the sector.
The International Environment
Growth in the OECD Area
Changes in international economic conditions have
been very varied since the sharp slowdown in 2001
after the Internet bubble burst and the 11 September
attacks. Overall growth in the OECD zone, which
drives the world economy, fell below one per cent in
2001, the lowest for more than a decade, and then
recovered in 2002 (1.8 per cent) and 2003 (2 per cent).
The OECD Secretariat3 expects growth to climb
to 3 per cent in 2004 and 3.1 in 2005 but remain well
below the peak of the previous cycle. This trend can
be expected to improve international conditions for
African countries over the next two years. However, the
expected stimulus is quite modest and not enough to
generate vigorous economic growth, especially in
meeting the internationally agreed targets for the
Millennium Development Goals.
Africa trades much more with Europe than it
does with the United States. Thus, the analysis of
Africa’s trade-induced economic growth has to be
set against the difference in growth between the
European Union and the United States. Africa sold
48 per cent of its exports to the European Union
(15 member states) in 2002 – 52 per cent when the
other Western, Central and Eastern European
countries (including new EU members) are added –
and only 15 per cent to the United States4. Clearly,
economic trends in Europe would tend to be more
important than those in the United States when it
comes to demand for African goods.
3. Source: OECD (2003), OECD Economic Outlook, December.
4. Source: Authors’ estimates based on IMF data (Direction of Trade Statistics).
African Economic Outlook
© AfDB/OECD 2004
Overview
Since the US and European economic cycles are not
in tandem, growth slowed later in Europe and only
reached its nadir (+0.7 per cent) in 2003. Hence the
disparity benefited Africa in 2001, but not in 2002 and
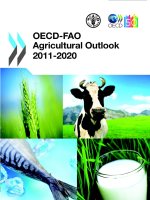
2003. Growth in the OECD zone’s demand for African
products, calculated as the weighted growth of each
OECD member state5, was 1.2 per cent in 2001, 1.6
in 2002 and 1.5 in 2003. Expected weak European
growth in 2004 (1.9 per cent) and 2005 (2.5) will
continue to hold down growth in demand for African
goods in 2005, which is predicted at 2.6 per cent in
2004 and 2.9 in 2005 (Figure 1).
Figure 1 - Growth in Demand for African Goods by OECD Countries
—— United States
—— European Union
—— OECD
---- Trade weighted OECD average
%
5
4
3
2
15
1
0
1995
1996
1997
1998
1999
2000
2001
2002
2003(e)
2004(p)
2005(p)
Source: Authors’ estimates based on OECD data and (for export structure) on IMF statistics.
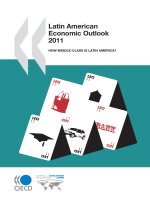
Exchange Rates
European growth has been partly slowed by the
45 per cent nominal appreciation of the euro against
the dollar between February 2002 and February 2004,
exceeding its January 1999 introductory value of $1.16
in October 2003 and reaching about $1.22 in March
2004. This made Euro zone products significantly less
price-competitive compared with the 1999-2001 period.
The OECD Secretariat6 is of the view that the
appreciation of the euro has reached its peak and the
value of the currency is predicted to fall slightly and
settle at around $1.14 in 2004 and 2005, a little higher
than in 2003 (Figure 2).
The appreciation of the euro had a direct impact
on the economies of many African countries in 2003.
The Franc Zone countries whose currency is pegged
to the euro were worst hit because their non-traditional
exports became less price-competitive and the CFA
franc-equivalent value of their raw materials exports,
which are priced in dollars, fell.
5. Weighting coefficients are their respective share in Africa’s exports.
6. Source: OECD (2003), OECD Economic Outlook, December.
© AfDB/OECD 2004
African Economic Outlook
Overview
Figure 2 - Value of the Euro and the Rand against the Dollar
—— Euro
(base 100 in January 1999)
—— Rand
120
100
80
60
40
January-99
July-99
January-00
July-00
January-01
July-01
January-02
July-02
January-03
July-03
January-04
Source: London foreign exchange market.
16
Currency value changes in 2002 and 2003 also
witnessed a spectacular 78 per cent rise in the nominal
value of the South African rand against the US dollar
between January 2002 and December 2003, partly due
to local factors (making up for an excessive fall in its
value in 2001 along with a fairly accurate risk assessment
by would-be investors) but also because of the weakness
of the dollar against all other traded currencies over the
two years and the buoyant price of precious metals.
The rand’s strength affected several Southern African
countries whose currencies are pegged to it.
and hit $37 in March 2004 (NYMEX/WTI price)
because of OPEC’s decision to reduce output (daily
quota cuts of a million barrels – 5 per cent of all OPEC
production – from 1 April 2004), political unrest in
Venezuela and fairly low oil stocks in the United States.
The OECD Secretariat7 predicts however that the price
will stabilise below $30 in 2004 and 2005, slightly
lower than the average price in 2003 (Figure 3). This
prediction hinges crucially on geopolitical developments
in the Middle East.
Metals
Raw Materials Prices
African raw material producers have recently enjoyed
fairly good prices, which were boosted for some countries
by the US economic turn around and for others by
political factors (in the case of gold and oil) or by the
weather (for cotton). This cyclical trend, however, does
not reverse the steady long-term decline in prices.
Oil
The drop in oil prices in 2001 was followed by an
erratic period, with a big rise just before the 2003
invasion of Iraq. The barrel price, which was below $20
at the end of 2001, climbed to $30 at the end of 2003
The price of gold continued on its upward trend
which began in mid-2001 (triggered by international
uncertainty), topping $400 an ounce at the end of
2003 for the first time since February 1996. This was
especially good news for South Africa, the world’s
leading producer (15 per cent of the total) and other
African gold producers, such as Ghana and Mali.
However, for South Africa and Mali, the rise in the value
of the rand and the euro completely cancelled out the
increased price, which fell in rands and did not improve
in CFA francs.
Prices of other metals, such as copper and
aluminium, also rose in 2002 and 2003, benefiting
7. Source: OECD (2003), OECD Economic Outlook, December.
African Economic Outlook
© AfDB/OECD 2004
Overview
Figure 3 - Prices of Oil and Metals
—— Petroleum
—— Gold
(base 100 in January 1999)
----- Copper
----- Aluminium
340
290
240
190
140
90
40
January-99
July-99
January-00
July-00
January-01
July-01
January-02
July-02
January-03
July-03
January-04
Source: IMF.
Zambia (for copper), Mozambique and to a lesser
extent Ghana, Cameroon and Guinea (aluminium).
Agricultural products
Among tropical commodities, cocoa (the main
export crop in Côte d’Ivoire and Ghana) showed the
biggest price fluctuation. It rose 120 per cent between
July 2001 and December 2002 and then fell 30 per cent
between March and June 2003 to settle at 160170 cents/kg. This is about the same as its level at the
end of 1997, at the top of the earlier cycle, but still nearly
half what it was at its peak in the early 1980s.
The price of coffee, exported by many countries,
held fairly steady in 2003 after rising significantly (for
the robusta variety) in 2002, making up for the sharp
fall in 2001. Coffee prices are expected to improve
slightly in 2004 and 2005 but their outlook is not
promising.
Tea prices, which dropped more than 40 per cent
between September 2000 and the end of 2001, have
since risen nearly 25 per cent. However, previous price
levels are unlikely to be reached particularly as prices
are not expected to improve much in 2004 and 2005
(Figure 4).
Figure 4 - Prices of Tropical Beverages
—— Cocoa
----- Tea
(base 100 in January 1999)
—— Coffee (arabica)
----- Coffee (robusta)
180
160
140
120
100
80
60
40
20
0
January-99
July-99
January-00
July-00
January-01
July-01
January-02
July-02
January-03
July-03
Source: IMF.
© AfDB/OECD 2004
African Economic Outlook
17
Overview
The world price of cotton almost doubled between
October 2001 and December 2003, after falling more
than 40 per cent between January and October 2001.
This cyclical change, caused mostly by fluctuations in
weather conditions, which had a negative impact on
US production, allowed African producers to enjoy
better prices. However, prices are not expected to rise
much higher in 2004 and 2005 due to excessive supply
as African countries have greatly increased their output
in recent years (Figure 5).
The cotton price illustrates the special problems
encountered by some of the poorest sub-Saharan
countries in the context of today’s international trade
regime. West and Central African countries produce
low-cost, high-grade cotton but face unattractive and
declining world prices because of the subsidies some
countries accord to their producers.
At the September 2003 WTO ministerial meeting
in Cancún, four African countries (Benin, Burkina
Figure 5 - Price of Cotton
(base 100 in January 1999)
160
140
120
100
80
18
60
40
January-99
July-99
January-00
July-00
January-01
July-01
January-02
July-02
January-03
July-03
Source: IMF.
Faso, Mali and Chad) proposed negotiations to end
cotton subsidies in WTO member countries, but US
opposition, muted enthusiasm from most other
developed countries and failure of discussions on the
meeting’s other agenda items resulted in no action
being taken on the proposal.
Official Development Assistance
A welcome development in the past two years has
been a continued, significant rise in official development
assistance (ODA). This increase, which had been
predicted by the 2002/03 Outlook, has been strongly
confirmed and the OECD’s Development Assistance
Committee (DAC) estimated total net ODA to
developing countries rose by 16 per cent between 2001
and 2002. This increase, although largely accounted
for by debt relief, is in line with promises made at the
African Economic Outlook
March 2002 Monterrey conference and is expected to
continue, with the DAC predicting a 7.9 per cent
growth of ODA by its members (who constitute the
vast majority of the donors) between 2002 and 2006.
If the expected increases are realised and other
donors step up their net aid, as well, net ODA flows
could climb back to their 1996 level and top $76 billion
(Figure 6). This would still be far below the peak
reached in the early 1990s which amounted to
$90 billion annually in 2002 prices. Taking 1989 as a
base year, predictions are that the ground lost in the
1990s will have been regained by 2006, though these
forecasts are still based on political pronouncements
rather than firm decisions.
It must be noted, however, that funding sources have
not all increased their aid at the same pace. US aid has
© AfDB/OECD 2004
Overview
Figure 6 - Net Flow of Official Development Assistance
(billions of 2002 dollars)
100
90
80
70
60
50
40
1980
1982
1984
1986
1988
1990
1992
1994
1996
1998
2000
2002
2004(p)
2006(p)
Source: Authors’ estimates based on OECD data.
risen 15 per cent, mainly in response to new international
challenges after the 11 September terrorist attacks.
Europe’s aid has increased 5.8 per cent, largely thanks
to France, Italy, Sweden and the European Commission.
Other EU members with smaller aid budgets (Belgium,
Finland, Ireland and Portugal) also greatly boosted their
aid, as did Canada. Japan, on the other hand, has
reduced its net aid by the equivalent of $560 million.
Some of these increases in aid donation can be
attributed to increased debt relief under the HeavilyIndebted Poor Countries (HIPC) Initiative, which
accounted for $6 billion in ODA in 2002. Such flows
are expected to stabilise in the medium term (and decline
over the long term) as the remaining countries qualify
for debt relief under the HIPC Initiative.
Growth of aid to Africa
Africa is the continent that has benefited the most
from the recent aid increases. Its share of total global
ODA rose sharply in 2002 — continuing the upward
trend that began in 2001, following the steady decline
of previous years (Figure 7). However, the aggregate
figure that shows an upward trend in ODA flows hides
structural shifts involving a decline in aid from Japan
(reinforcing its traditional tendency to give less aid to
Africa) and an increase in aid from Europe and North
America. Some donors have also significantly changed
their geographical distribution of aid. For instance,
Canada now gives half of all its aid to Africa.
The NEPAD process was, indeed, instrumental in
making the continent the focus of developed-country
aid8. NEPAD has been strongly backed by the
international community since it was launched, with
donors’ support reaffirmed at the G8 summits in Genoa
(2001), Kananaskis (2002) and Evian (2003). By 2002,
Africa’s share of total net ODA flows had returned to
the 36 per cent recorded in the mid-1990s.
Net ODA to Africa jumped 35 per cent in value
between 2001 and 2002 (32 per cent in real terms
taking into account 2.1 per cent inflation in OECD
countries in 2002). This is partly because aid in real
terms has increased globally, and partly because a
larger proportion of aid is now directed toward Africa.
Should Africa’s share of net ODA continue to rise to
reach 40 per cent of the total in 2006, the aid received
by the continent would amount that year to $30 billion
(in 2002 dollars). This implies 36 per cent more aid
compared with 2002. This is very far short of what
is needed to reach the Millennium Development
Goals but it is still a big step forward and more than
8. The NEPAD process is discussed in depth later in this section.
© AfDB/OECD 2004
African Economic Outlook
19
Overview
Figure 7 - Net ODA to Africa
—— Share as % of total ODA
(in 2002 dollars)
—— Level ($ billion)
%
$ billion
40
30
35
20
10
30
1996
1997
1998
1999
2000
2001
2002
Source: Authors’ estimates based on OECD data.
20
could have been realistically expected in the medium
term.
Geographical distribution
to debt relief by the Paris Club under the Lyons terms
at a time when Côte d’Ivoire seemed near HIPC decision
point. However, the civil war that erupted in September
2002 undermined this progress and a return to normal
is not expected before the end of 2004 at the earliest.
Southern Africa (except South Africa) and West
Africa (except Nigeria) are the two regions that benefit
most in per capita terms from ODA. In 2002, these
two sub-regions received $55 and $40 per capita
respectively (Figure 8). In Southern Africa, the main
beneficiaries in order of magnitude, are Mozambique
and Zambia and, in West Africa, Burkina Faso, Mali,
Senegal, Ghana and (irregularly in recent years) Côte
d’Ivoire. Growth of aid to Southern Africa, in 2002,
focused strongly on Mozambique, which received more
than $1 billion extra, mainly in the form of HIPC
debt relief.
Per capita aid to Central and East Africa is usually
about half that to Southern and West Africa. However,
aid to Central Africa has risen sharply, mainly due to
resumption of assistance to Democratic Republic of the
Congo (DRC) as part of post-conflict reconstruction.
Aid to East Africa has fallen, especially to Uganda,
which received 20 per cent less in 2002. This was
mainly because of the fall in additional debt relief as
the country is reaching the end of the HIPC process
that it had begun in 1996. Debt relief had tended to
inflate the amount of the country’s net ODA flows.
A large proportion of the 2002 increase in ODA to
West Africa went to Côte d’Ivoire, which (after a big drop
in aid between 1999 and 2001) received $1 billion as
the political situation seemed to be stabilising before
the failed coup in September that year. As in the case of
Mozambique the rise in ODA flows was closely linked
Aid to North Africa has steadily declined since the
early 1990s due to reduced aid to Egypt which had
enjoyed a substantial increase in aid since the early
1990s largely as a result of debt relief granted to it in
1991. Nevertheless, Egypt is still by far the region’s
largest recipient of ODA.
African Economic Outlook
© AfDB/OECD 2004
Overview
Figure 8 - Net Per Capita ODA by Region
North Africa
Central Africa
Nigeria
(in 2002 dollars)
East Africa
West Africa
South Africa
Southern Africa
70
60
50
40
30
20
10
0
1996
1997
1998
1999
2000
2001
2002
Source: Authors’ estimates based on OECD data.
21
Aid policies are largely guided (with some variations
according to donor) by two major principles: targeting
the poorest and needy countries; and directing aid
toward countries with adequate policies and governance
that give them the best chance to boost growth and
reduce poverty.
includes Egypt and Côte d’Ivoire. In 2001, Egypt lost
its place as Africa’s largest aid recipient which it had
enjoyed since the early 1970s. Aid to Egypt has steadily
declined, from more than $2 billion at the start of the
1990s to under $1.3 billion in 2001 and 2002. Côte
d’Ivoire got substantial aid, especially in 2002, after a
pause in 2000 and especially in 2001 because of political
instability.
The trend in recent years has been to help the
poorest countries. The biggest gainers have been the
first quintile (the 10 poorest countries), which now get
the largest share of aid to Africa (32 per cent in 2002
– up from 23 per cent in 1996). The increase in aid
share of the poorest countries has been largely due to
the rise in aid to Mozambique and Ethiopia. This
increase has been at the cost of countries in the fourth
quintile, which, paradoxically, used to receive the largest
amount of aid in 1996 (more than 30 per cent).
However, in 2002, countries in the fourth quintile
were still receiving a share of 26 per cent. This group
The use of governance criteria for the allocation
of aid can be examined by relating aid allocation to
the Country Policy and Institutional Assessment
(CPIA) indicator which is used by the African
Development Bank for resource allocation 9. The
CPIA assesses the policy stance of countries and their
institutions using 20 criteria grouped into four
clusters: a) macroeconomic policies; b) structural
policies; c) policies for growth with equity and poverty
reduction; and d) governance and public sector
performance. When the CPIA is correlated with
ODA allocation the results reveal that the 20 per
Criteria for aid
9. The indicator is similar to the CPIA of the World Bank and estimates show that the two are closely correlated.
© AfDB/OECD 2004
African Economic Outlook
Overview
22
cent of countries that score best on the indicator
receive only 17.6 per cent of total net ODA
to Africa10, and the proportion has barely changed in
recent years (it was 17.3 per cent in 1996). However,
this result is not surprising in view of the fact that
the group of countries that have the best policies
and institutions includes some middle-income
countries with much lower incidence of poverty. The
countries in the second quintile in the CPIA ranking
received much more ODA, with allocations
amounting to 43.1 per cent in 2002, slightly up from
41.9 in 1996. Those in the third quintile saw their
share fall from 18.3 to 14.1 per cent over this period.
Aid to countries in the fourth and fifth quintiles was
small and fairly stable amounting to 12.2 and 12.9 per
cent in 2002 respectively.
with better CPIA rating (using the World Bank’s
CPIA indicator) received more net ODA from DAC
member countries.
Overall, countries with relatively good policies
and institutions receive a larger share of aid; except
for some countries in the first quintile in the CPIA
ranking that have relatively small incidences of poverty.
The same results apply for both bilateral and
multilateral aid, whose donors follow similar allocation
policies. These observations lend support to the results
of similar analyses by the DAC in its 2003 annual
report, which reveal that, in recent years, countries
Macroeconomic Performance
in Africa
For the continent as whole the degree of aid
dependency is quite modest, measuring 4 per cent of
Africa’s GDP in 2002. However, there is a large variation
of aid dependency among individual African countries.
For instance, there are some 12 countries with ODA
flows that amount to more than a fifth of their GDP,
including Eritrea, Guinea-Bissau, Malawi, Mauritania,
Mozambique and São Tomé. In recent years, the aid
dependency of Ethiopia, Burundi, Rwanda, and Sierra
Leone has grown significantly. These countries will be
the most vulnerable to changes in aid policies.
Economic Growth
The world economic slowdown in 2001 had a
slightly delayed effect on Africa, where growth fell to
2.7 per cent in 2002, from 3.3 per cent in 2001 and
3.6 per cent in 2000. The impact was relatively modest
Table 1 - Average Growth Rates of African Regions
Region
Central Africa
East Africa
North Africa
Southern Africa
West Africa
Total
Average 1996-2001
2002
2003(e)
2004(p)
2005(p)
2.7
4.3
4.5
2.8
3.5
3.6
4.1
1.7
3.3
3.3
1.0
2.7
4.2
2.4
4.9
1.8
4.5
3.6
7.1
4.9
3.5
2.8
3.9
3.6
7.0
4.6
4.2
3.1
4.0
4.0
Note: These aggregates do not include Liberia, Libya and Somalia. Predictions for 2005 are calculated without Congo (DRC),
Angola and Zimbabwe, for which forecasts are not possible.
Source: Authors’ (e) = estimate; (p) = projection.
because of the sharp rise in ODA from 2002, antirecession budget policies and the beginning of a price
recovery for the continent’s raw material exports.
Despite continuing poor demand for African
products in 2003, growth rose to 3.6 per cent, the
average since the mid-1990s. Growth is expected to be
about the same in 2004 and possibly rise to 4 per cent
in 2005, but these predictions should be treated
cautiously. Recent country trends show that growth in
Africa is vulnerable to weather conditions and political
events in certain parts of the continent.
10. Somalia and Libya were not considered in this exercise for lack of enough data.
African Economic Outlook
© AfDB/OECD 2004
Overview
North Africa
The region suffered in 2002 from the backlash of
the 11 September attacks, especially through a drop in
tourism, and only grew 3.3 per cent in 2002 (down
from 4.5 per cent in 2001). The figure was much better
in 2003 at 4.9 per cent according to the estimate of
the AEO, helped by good harvests in the Maghreb
countries and a continuing strong performance by
Algeria’s oil sector. The region also did well due to
government efforts at reform, so growth may continue
in 2004 and 2005, especially in Tunisia where it has
been quite strong in recent years.
Egypt took a big step in January 2003 by partly
liberalising its exchange market, which should increase
its growth possibilities. In addition its natural gas
sector is booming. Growth is none the less fairly small,
since the effective devaluation of the Egyptian pound
has not sufficiently stabilised the currency market or
boosted exports. The economy remains dependent on
the political and economic situation in the Middle
East because of dependence on remittances from
Egyptian workers abroad and on a tourist sector which
is volatile due to regional politics and continued
violence in the region.
West Africa
Growth was quite good in 2003, averaging 4.5 per
cent, the best in recent years and a big improvement
on 2002. It was impressive in view of the serious political
crisis in Côte d’Ivoire from September 2002 and an
economic recession there which started in 2002 and
deepened in 2003.
Côte d’Ivoire sank into civil war in September 2002
after a failed coup that resulted in the country’s being
divided between north and south. A peace agreement
was signed in January 2003 (the Marcoussis accords),
which produced a ceasefire three months later and the
formation of a national unity government which is to
organise elections in October 2005.
Until that date, the situation will remain very
uncertain. A United Nations peacekeeping force
(ONUCI) was installed in April 2004 to replace the
regional ECOWAS force (MICECI). The Ivorian
economy shrank for the second year running in 2003,
by 2.3 per cent, but it may grow slightly in 2004,
though only if political peace returns and reconstruction
gets under way.
Nigeria, which has a special role in West Africa
because of its large size and oil wealth, had robust
growth of about 5 per cent in 2003 due to the good
performance of oil, which meant much more added
value in the energy sector. This also boosted the
government’s revenue and helped restore its finances
after being obliged to declare a debt moratorium
in 2002.
Despite liberalisation of the domestic market for
oil products, which reduced some shortages, the energy
sector, like the rest of the economy, remains inefficient.
President Olusegun Obasanjo was democratically reelected in 2003 but his country still has serious
governance and security problems. Economic growth
is not expected to be strong in 2004 and 2005, when
we predict it will be around 3.7 per cent.
Central Africa
Landlocked neighbours, especially Mali and
Burkina Faso, whose trade depends on their road and
rail links with the port of Abidjan, adapted very well
economically to the disruption. They were helped by
good harvests, used alternatives routes to ports in
Ghana, Togo, Benin, Guinea and Senegal and
government policies managed to limit the economic
effects of the Ivorian crisis. Ghana and Senegal benefited
from the situation with more trade, though this did
not substantially boost their growth.
© AfDB/OECD 2004
The region has had quite good growth (more than
4 per cent) since 2002, thanks to the healthy
performance of the oil sector, helped by favourable
world prices, and also to a calmer political situation in
Congo (DRC) which enabled countries to begin
reconstruction with foreign funding.
Chad, which began producing oil in the Doba
region in July 2003, a few months earlier than scheduled,
African Economic Outlook
23
Overview
has seen strong growth since 2001 due to investment
in the oil sector and is expected to top 40 per cent in
2004, the first full year of oil production. Cameroon
also got a boost from this investment with construction
of the oil pipeline to the port of Kribi.
Equatorial Guinea, also because of its booming oil
sector, had double-digit growth once again and the
figure should be even higher in 2005. Even Gabon,
whose oil output has declined in the past few years, had
a very good year in 2003, as well-extraction rates
improved.
24
In Congo (DRC), the political normalisation that
began with the 2001 ceasefire started to bear political
and economic fruit. A national unity government was
set up in June 2003, ending five years of civil war. But
serious concern about the reunification process remained
because of human rights violations, lawlessness and
political unrest in eastern provinces. There are still
many refugees and displaced persons in the country and
throughout the Great Lakes region.
The government obtained $750 million in PRGF
funds in June 2002 after implementing an IMF Staff
Monitored Programme (SMP) and reaching HIPC
decision point in July 2003. It also received aid from
the African Development Bank, the World Bank and
various bilateral sources, which enabled it to make
progress in reforms and reconstruction, boosting
growth in 2003 to 5 per cent (and an expected 6 per
cent in 2004).
settlement of their border dispute, enforced by the
presence since July 2000 of a UN peacekeeping force
(UNMEE), and a peace accord signed in December
2000. Opposition movements are, however, still active
in Ethiopia, Somalia and (with fewer economic
consequences) Uganda and Tanzania (Zanzibar).
The region has not benefited much from developed
countries’ increased ODA budgets and Kenya, Malawi,
Tanzania and Uganda even saw net ODA receipts fall
in 2002. That year and 2003 were disappointing for
the region, but 2004 should be better. Quite strong
growth is expected in 2003/04 as agricultural output
returns to normal after a bad year in 2002/03.
Projections by donors indicate that Kenya will start
getting more aid in 2004 as its governance improves.
So East Africa could see fairly good growth in 2004,
of around 4.9 per cent, which could hold up well in
2005 barring a new drought.
Southern Africa
Growth slumped badly in 2003 to an average 1.8 per
cent, partly due to South Africa (1.9 per cent in 2003,
down from 3.6 in 2002), which was hit by weak external
(especially European) demand and by the rise in the
value of the rand, which made South African industry
less competitive. The mining sector, notably gold,
suffered from higher costs and the stronger rand. Its
problems could grow with the new mining code being
discussed in early 2004 which could increase royalties
to the government. All this should limit South Africa’s
growth to 2.5 per cent in 2004 and 3.1 per cent in 2005.
East Africa
Growth in East Africa was poor in 2002 and only
slightly better in 2003 (2.4 per cent), partly due to
drought that badly hit the 2002/03 harvests in Ethiopia,
Kenya and Uganda.
The successful democratic handover in Kenya in
December 2002 brought hope of economic progress
but there was none in 2003. The return of civil peace
to Madagascar helped good growth in 2003 (after a
sharp decline in 2002) and the Mauritian economy also
benefited. Ethiopia and Eritrea profited from a fragile
African Economic Outlook
Mozambique maintained healthy growth thanks
to reforms, substantial foreign aid and construction of
the second phase of the Mozal aluminium smelter,
which was set to open in 2004.
Zimbabwe, however, remained in the grip of its
macroeconomic crisis of recent years caused by serious
agricultural problems (due to the land redistribution
programme), a budget crisis, further price distortions
and a big shortage of foreign exchange. International
political isolation increased and Zimbabwe left the
Commonwealth in December 2003. No solution of the
© AfDB/OECD 2004