OECD economic surveys ireland
Bạn đang xem bản rút gọn của tài liệu. Xem và tải ngay bản đầy đủ của tài liệu tại đây (661.32 KB, 132 trang )
ECONOMICS
Special Feature: Public Expenditure Reform
Non-Member Economies
Baltic States, February 2000
Brazil, June 2001
Bulgaria, April 1999
Romania, October 2002
Russian Federation, February 2002
Slovenia, May 1997
Federal Republic of Yougoslavia,
January 2003
Ireland
-:HSTCQE=VUW^\W:
July 2003
ISBN 92-64-10297-3
10 2003 09 1 P
IRELAND
www.oecd.org
ISSN 0376-6438
2003 SUBSCRIPTION
(18 ISSUES)
Volume 2003/9 – July
OECD
Economic Surveys
OECD Economic Surveys
Economic Surveys
Australia, March 2003
Austria, December 2001
Belgium, February 2003
Canada, September 2001
Czech Republic, April 2003
Denmark, July 2003
Euro area, September 2002
Finland, March 2003
France, July 2003
Germany, January 2003
Greece, July 2002
Hungary, June 2002
Iceland, April 2003
Ireland, July 2003
Italy, February 2002
Japan, January 2003
Korea, March 2003
Luxembourg, February 2001
Mexico, April 2002
Netherlands, January 2002
New Zealand, June 2002
Norway, September 2002
Poland, July 2002
Portugal, February 2003
Slovak Republic, June 2002
Spain, May 2003
Sweden, August 2002
Switzerland, May 2002
Turkey, December 2002
United Kingdom, December 2001
United States, November 2002
Volume 2003/9
Ireland
«
Volume 2003/9 – July
© OECD, 2003.
© Software: 1987-1996, Acrobat is a trademark of ADOBE.
All rights reserved. OECD grants you the right to use one copy of this Program for your personal use only.
Unauthorised reproduction, lending, hiring, transmission or distribution of any data or software is
prohibited. You must treat the Program and associated materials and any elements thereof like any other
copyrighted material.
All requests should be made to:
Head of Publications Service,
OECD Publications Service,
2, rue André-Pascal,
75775 Paris Cedex 16, France.
OECD
ECONOMIC
SURVEYS
2002-2003
Ireland
ORGANISATION FOR ECONOMIC CO-OPERATION AND DEVELOPMENT
ORGANISATION FOR ECONOMIC CO-OPERATION
AND DEVELOPMENT
Pursuant to Article 1 of the Convention signed in Paris on 14th December 1960,
and which came into force on 30th September 1961, the Organisation for Economic
Co-operation and Development (OECD) shall promote policies designed:
– to achieve the highest sustainable economic growth and employment and a
rising standard of living in member countries, while maintaining financial
stability, and thus to contribute to the development of the world economy;
– to contribute to sound economic expansion in member as well as non-member
countries in the process of economic development; and
– to contribute to the expansion of world trade on a multilateral, nondiscriminatory basis in accordance with international obligations.
The original member countries of the OECD are Austria, Belgium, Canada,
Denmark, France, Germany, Greece, Iceland, Ireland, Italy, Luxembourg, the
Netherlands, Norway, Portugal, Spain, Sweden, Switzerland, Turkey, the
United Kingdom and the United States. The following countries became members
subsequently through accession at the dates indicated hereafter: Japan
(28th April 1964), Finland (28th January 1969), Australia (7th June 1971),
New Zealand (29th May 1973), Mexico (18th May 1994), the Czech Republic
(21st December 1995), Hungary (7th May 1996), Poland (22nd November 1996),
Korea (12th December 1996) and the Slovak Republic (14th December 2000). The
Commission of the European Communities takes part in the work of the OECD
(Article 13 of the OECD Convention).
Publié également en français.
© OECD 2003
Permission to reproduce a portion of this work for non-commercial purposes or classroom
use should be obtained through the Centre français d’exploitation du droit de copie (CFC),
20, rue des Grands-Augustins, 75006 Paris, France, tel. (33-1) 44 07 47 70, fax (33-1) 46 34 67 19,
for every country except the United States. In the United States permission should be
obtained through the Copyright Clearance Center, Customer Service, (508)750-8400,
222 Rosewood Drive, Danvers, MA 01923 USA, or CCC Online: www.copyright.com. All other
applications for permission to reproduce or translate all or part of this book should be made
to OECD Publications, 2, rue André-Pascal, 75775 Paris Cedex 16, France.
Table of contents
Assessment and recommendations
9
I. Adjusting to slower growth and ensuring prosperity
The nature of the growth slowdown
Future prospects
Policy challenges
II. Consolidating the public finances
Gradual adjustment of public finances to slower growth
Medium-term fiscal position
The impact of ageing on the public finances
Control of the public finances and priorities
III. Enhancing the effectiveness of public expenditure management
Trends in public expenditure and forces shaping them
Strengthening the budgetary process and control
Improving the cost effectiveness of public spending
Challenges of improving spending outcomes in healthcare and infrastructure
Agenda for future reform
IV. Sustaining growth: the structural policy dimensions
Introduction
Improving regulation and promoting competition and market solutions
Changing focus of industrial policy
Priorities in human capital development
Labour market policy
Some aspects of sustainable development
21
21
27
32
37
37
42
44
46
47
49
53
59
70
77
83
83
83
91
91
94
98
Notes
114
Bibliography
122
Annexes
I. Anti-inflation proposals
II. Social partnership in Ireland
III. The problems associated with measuring Irish productivity
125
126
128
•••••
© OECD 2003
OECD Economic Surveys: Ireland
4
Boxes
1.
2.
3.
4.
5.
6.
The new partnership agreement
Special savings incentive scheme
Summary of measures contained in Budget 2003
Benchmarking public sector pay
The budget process in Ireland
The new partnership agreement related to human resource management
in the civil service
7. Mechanisms to introduce competitive pressures on providers
of publicly funded services
8. Local authority funding
9. Private practice in public hospitals
10. Summary of recommendations
11. Policy integration across sustainable development areas
26
39
40
41
56
61
63
65
73
78
99
Tables
1.
2.
3.
4.
5.
6.
7.
8.
9.
10.
11.
12.
13.
14.
15.
16.
17.
18.
19.
Short-term outlook
Comparison of deficits and debt ratios in the EU
General government balance and prospective debt ratio
Long-term demographic projections for Ireland
Long-term sustainability of public finances
General government spending by economic category
Major current government outlays
Public sector employment and pay
Selected health care outcomes, resources and utilisation
Plan for investment in economic and social infrastructure
under National Development Plan (NDP)
Share of public procurement being openly advertised internationally
in European Union countries
Implementing structural reform – an overview of progress
Participants in ALMP programmes
Main indicators: climate change
GHG emissions and sectoral indicators
Influence of a carbon tax on the costs of power generation
Sectoral abatement costs under the Climate Strategy versus imports
of permits
Performance indicators: water pollution
Performance indicators: waste
29
43
43
44
45
50
51
53
72
75
76
84
96
100
101
104
105
108
111
Annex
A1. Productivity growth
A2. Volume indices of production: manufacturing
A3. Productivity and entrepôt type activities
128
129
130
© OECD 2003
Table of Contents
5
Figures
1.
2.
3.
4.
5.
6.
7.
8.
9.
10.
11.
12.
13.
14.
15.
16.
Growth in GDP and GNP: the widening gap
Irish labour force growth
Immigration
Indicators of inflation
Exchange rate and unit labour costs
Decomposition of growth in labour supply
Evolution of Irish public finance
General government spending
Trends in general government spending
Overshooting in current revenue and expenditure
Composition of subnational government financial resources
Local authorities’ current revenue by source
Trends in health care expenditure
Educational attainment of the working-age population
Quality of surface water in Ireland
Financial costs of water pollution.
22
22
24
25
28
31
37
48
52
54
66
68
71
92
107
109
Annex
A1. Social partnership agreements
© OECD 2003
127
BASIC STATISTICS OF IRELAND
THE LAND
Area (thousand sq.km)
Agricultural area, 1995, as per cent of total area
70 Population of major cities, 19961 census (thousands):
Dublin (Country and Co. Borough)
Cork (Co. Borough)
Limerick (Co. Borough)
57
1 057
127
52
THE PEOPLE
1
Population in thousands (April 2002)
Number of inhabitants per sq.km
Increase in population: annual average
1996-2002
Natural increase in population: annual
average 2001-2002
3 897 Net emigration: average 1993-95
56 Net immigration: average 1996-99
Net immigration: average 2000-2002
Total labour force, Sept.-Nov. 2002 (thousands)
291 249 Civilian employment, Sept.-Nov. 2002 (thousands):
Agriculture, forestry and fishing
27 550
Industry and construction
Other sectors
2 333
16 075
25 033
1 855
120
493
1 158
THE GOVERNMENT
Public current expenditure on goods and
services, 1999 (as per cent of GNP)
Current government receipts, 1998
(as per cent of GNP)
General government debt, 2001
(as per cent of GNP)
Composition of Parliament (June 2002):
Fianna Fail
Fine Gael
40
Labour
Progressive Democrats
44
Green
Socialist
Sinn Fein
Others
Last general election: May 2002
18
Seats:
81
31
21
8
6
1
5
13
FOREIGN TRADE
Exports:
Exports of goods and services,
as per cent of GNP (2001)
Main exports, 2001 (per cent of total):
Meat and meat preparation
Dairy products
Beverages
Organic chemicals
Medical and pharmaceutical products
Machinery and transport equipment
of which:
Office machines
Electrical machinery
Main customers, 2001 (per cent of total):
United Kingdom
Other European Union
United States
117
2
1
1
14
7
45
27
11
Imports:
Imports of goods and services,
as per cent of GNP (2001)
Main imports, 2001 (per cent of total):
Petroleum products
Chemicals and related products
Textile manufacturing, clothing and footwear
Machinery and transport equipment
of which:
Office machines
Electrical machinery
Main suppliers, 2001 (per cent of total):
United Kingdom
Other European Union
United States
100
3
12
3
51
18
14
35
23
15
23
38
17
THE CURRENCY
Monetary unit: Euro
1. Preliminary.
Currency unit per US dollar, average of daily figures:
Year 2002
March 2003
0.94
1.08
This Survey is published on the responsibility of the Economic and
Development Review Committee of the OECD, which is charged with the
examination of the economic situation of Member countries.
The economic situation and policies of Ireland were reviewed by the
Committee on 14 April 2003. The draft report was then revised in the
light of the discussions and given final approval as the agreed report of
the whole Committee on 23 May 2003.
The Secretariat’s draft report was prepared for the Committee by
Hideyuki Ibaragi, Young-Sook Nam and Boris Cournède under the
supervision of Yutaka Imai.
The previous Survey of Ireland was issued in June 2001.
Assessment and recommendations
The Celtic Tiger
era is over
© OECD 2003
The extraordinary growth in the second half of the
1990s, the era of the “Celtic Tiger”, has given way to a more
normal, albeit still rapid pace of expansion since 2001,
though the extent of the slowdown has been more marked
outside the multinationals sector. Some slackening in
growth was in any case inevitable and even desirable given
increased tensions in the economy, manifest in high inflation, worsening traffic congestion, rapidly rising house prices
and recruitment difficulties. While the slowdown is closely
linked to the burst of the ICT bubble, it also reflects a deterioration in Irish cost competitiveness. This has been due to
strong inflation in the sheltered sector of the economy,
reflecting the combined influence of large wage gains emanating from the tradables sector, low productivity growth in
the sheltered sector and the generally expansionary effects
of very low real interest rates since Ireland joined the European Monetary Union. The future trend growth over the
medium term is now widely believed to be between 4 and
5 per cent for real GDP and a shade lower for GNP, a view
shared by the OECD. The policy challenge facing the Irish
economy in the immediate future is to ensure that both
income expectations and public finances adjust to a slower
growth environment. The former is necessary to guard
against deterioration in international competitiveness, while
the latter is required to ensure fiscal sustainability and the
maintenance of a growth-supportive tax environment. Over
a longer term, the broad aim of the authorities should be to
ensure that the economy will continue to grow at a reasonably high rate and that policies will be more clearly oriented
towards protecting interests of consumers rather than producers, notably through enhanced competition in service
sectors.
10
OECD Economic Surveys: Ireland
The resilience
of GDP masks
the weakness
of the national
economy
At 6 per cent, real GDP growth was relatively well maintained in 2002, but in terms of real GNP, a measure not of
domestic production but of national economic activity,
growth was much weaker at well below 2 per cent. The wide
gap between GDP and GNP that is accounted for by net factor income payments has been a consistent feature of the
Irish economy, but a growth gap of over 4 per cent is unprecedented and attributable to a strong performance of the
biomedical and pharmaceutical sectors where, margins are
exceptionally high and accrue largely to foreign owners. The
economy has lost momentum since late 2002 with a further
slowdown in exports and a substantial weakening in business confidence. The demand for labour slackened throughout 2002, leading to a rise in the unemployment rate from its
historical lows to 4.4 per cent in 2002, The current weak
trend in activity is expected to prevail during 2003 but is
forecast to give way to modest acceleration in 2004 on the
assumed recovery of export markets. Construction activities
are likely to remain a major source of buoyancy due to rapid
development of the physical infrastructure and continued
strong demand for housing.
The adjustment
of income
expectations
to slower growth
appears to be
in progress
There are signs that adjustment in income expectations
has begun to take hold. The recent central wage agreement
of 7 per cent over the next eighteen months indicates that
income expectations are adjusting to the new situation and
will help to moderate inflation. The partnership process
seems to have contributed to this outcome by promoting
the common understanding of the emerging economic reality, even without a tax concession as offered by the government in the past. The new partnership agreement
nonetheless included a series of special initiatives to deal
with certain social issues. On the other hand, strong price
pressures that prevail in the sheltered sector of the economy suggest that the adaptation of income expectations to
slower growth still has some way to go. Inflation in the sheltered sector, however, could be expected to subside with
wage moderation, though remaining higher than in the sector open to international competition. One reason for this
projected inflation gap is the level adjustments to public
sector wages following the benchmarking exercise, which
put upward pressure on indirect taxes and public charges. It
© OECD 2003
Assessment and recommendations
11
is important that future wage adjustment in the public sector should be strictly conditional upon the demonstration of
higher efficiency.
… and so does
the adjustment
in public finances
The adjustment also appears to be taking place in public finances. The 2003 budget seems to be more consistent
with slower underlying growth in the tax base than its two
predecessors. Both the 2001 and 2002 budgets substantially
overestimated revenues while underestimating spending
pressures, which resulted in a worsening of the general government position from a surplus of 4.4 per cent of GDP in
2000 to an estimated deficit of 0.1 per cent in 2002. The error
in the revenue projection was in part due to the reform of
taxation which, despite its positive effects on economic
incentives, made forecasting difficult. But it was also attributable to overestimation of Irish growth due to the unforeseen slowdown in global economic activity. The 2003 budget
marks a departure from the earlier budgets in that it relies
on increased taxation and allows a smaller increase in
spending that is allocated selectively to priority areas. Even
so, the general government deficit is projected to rise to
0.8 per cent of GDP in 2003.
But managing
public spending
and maintaining
a supportive tax
environment
remains
a longer-term
challenge
The budget projections to 2005 in Ireland’s latest Stability Programme Update envision the deficit continuing to
rise to 1.2 per cent of GDP in the context of economic growth
below potential. However, both the spending and revenue
shares are projected to fall and the debt to GDP ratio to
remain below 35 per cent. In the following decade, it will be
necessary to exercise continued budget prudence so as to
deal with spending pressures related to infrastructure
development and a range of social services and to prepare
further for the budgetary implications of population ageing.
In an environment of less buoyant fiscal revenues, the need
to clearly establish spending priorities and to ensure that
value for money becomes the key criterion in all spending
areas will become more important than ever.
Reforms to budget
process and
control should be
intensified
To meet this challenge requires further significant
improvements to the public expenditure management system. Despite some progress, further reforms to institutional
arrangements will be needed to enhance aggregate spend-
© OECD 2003
12
OECD Economic Surveys: Ireland
ing control and strategic prioritisation. Among the most
important is the adoption of a more top-down budgeting
process and a rolling multi-annual budget “envelope” system. The move to a multi-annual framework for public
investment is a positive step in this regard. Prioritisation of
spending could also be facilitated by stepping up the ongoing efforts for systematic expenditure reviews, and by introducing sunset clauses to new programmes, which should
help move resources away from those which no longer serve
the original objectives.
The shift toward
more flexible and
results-focused
budgeting and
management
should be
stepped up
To enhance the efficiency of public service delivery, the
government should accelerate its efforts to move from
input-oriented management and budgeting toward one centred on outputs and outcomes. This will however need to be
pursued in conjunction with strengthening accountability for
results, which in turn requires developing more specific performance criteria and more effective monitoring and control
systems. Routine and systematic evaluation and value-formoney audits should be in place in all spending areas. The
government should also take steps to systematically integrate output indicators into the budgetary and policy-making process. Both ex ante indicators in the form of goals and
ex post indicators as a means of verifying performance will
need to be integrated to show the effectiveness of alternative programmes. In particular, it will be important to
strengthen the role of the Parliament and the Comptroller
and Auditor General in results-oriented auditing and
reviewing control mechanisms. At the same time, the current
efforts to develop the Management Information Framework
(MIF) needs to be stepped up. Efficiency gains could also
be made from reforms to human resource management in
the public service including more open and competitive
recruitment and performance-oriented personnel management practices. Given the limited progress made in this
area in the past, it will be particularly important to develop
the link between public sector pay increases and the modernisation of the public service, which was established in
the new partnership agreement.
© OECD 2003
Assessment and recommendations
13
The use of market
instruments
in the public
sector should
be expanded
A more extensive use of market-based instruments
such as contracting out, vouchers, internal contracts and
benchmarking should help generate higher efficiency and
better delivery of publicly funded services. In particular,
there is still substantial scope for more use of user charges
as a mean to contain cost pressures or reduce excessive
demand. Water charges are a case in point. Ireland is unique
among OECD countries in not charging domestic consumers
for water services. A charging regime in this area could
contribute to more efficient use of what is becoming an
increasingly expensive resource. In addition, fees for higher
education could be re-introduced. Several OECD countries
have successfully targeted support for higher education
through fees, loans and grant schemes which include provisions for the less well-off.
Funding of local
governments
could be better
geared toward
promoting
the effectiveness
of public
expenditure
Improving the effectiveness of spending by subnational governments should be a key element of public
expenditure management reform. A wide-ranging programme of local government reform in recent years has
greatly enhanced the quality of performance management
system at local level. While pursuing the ongoing efforts to
improve local accountability, reform should now aim at providing greater flexibility and decision making power to local
authorities and increasing the share of funding which is
locally levied. In this regard, serious consideration should
be given to raising revenues by re-introducing local property taxes on residential housing, which has many advantages as a sub-national tax. The current grant system might
be reformed to improve allocative and cost efficiency by
moving towards block grants for those services which do not
provide clear spillover effects and modifying the financing
arrangements for earmarked grants to provide incentive to
contain costs. There is also scope for streamlining subnational public administration, given the plethora of local or
regionally-based public bodies that operate outside local
government. Efforts should also be made to enhance the
level of co-ordination and co-operation between local
authorities and between national/local authorities and other
public service bodies to achieve effective planning and
delivery of services.
© OECD 2003
14
OECD Economic Surveys: Ireland
Better planning
and increased
efficiency in
infrastructure
investment
are necessary
Costs and benefits of public spending in several priority areas should be carefully considered. One such area is
public infrastructure investment. The substantial increase in
spending planned under the National Development Plan is
justified to respond to the infrastructure needs resulting
from strong economic growth in Ireland, in particular, in
roads, public transport, and housing. But it is important to
get the maximum mileage out of the increased spending.
The final costs of the infrastructure investment under the
National Development Plan are now envisaged to be much
higher than initially planned. For example, the estimated
costs of the national road programme had soared from
€ 5.9 billion in 1999 to € 15.8 billion in 2002, due mainly to
construction cost inflation, design changes, additional land
acquisition costs, and under-estimation of project prices.
One way to overcome the constraints in the construction
sector will be to accelerate the efforts to increase the import
content of construction services, through such measures as
further increasing the share of public procurement openly
advertised internationally. The Government’s intention to
expand the involvement of the private sector in the funding
and operation of the public infrastructure through Public Private Partnerships (PPP) is welcome in this regard, but in pursuing this strategy the appraisal procedures in place to
determine that PPP is the best value option should be rigorously applied. In addition, contracts will need to be
designed carefully to allow for an appropriate sharing of the
risks associated with such major projects and emphasis will
need to be placed on regulation and on providing the right
frameworks and incentives.
The effectiveness
of healthcare
spending also
needs to be
improved
Another priority spending area is healthcare. Given the
enormous increases in government expenditure on the
health services and notwithstanding some real improvements in outputs, concerns remain about the efficiency and
productivity of this sector. This is particularly manifest in
public dissatisfaction about long waiting times for access to
public hospitals, which seems to be exacerbated by a prevailing perception that people with private insurance jump
the queue. To respond to the issue of access to care for public patients in public hospitals the regulations which limit
the share of public beds occupied by private patients
© OECD 2003
Assessment and recommendations
15
should be fully enforced. To better inform public perceptions and to improve decision making about priorities,
greater transparency is required in relation to the existing
distribution of resources within, and outputs of, the health
services. More generally, the poorly developed information
systems in the health sector hamper the measurement of
performance, and priority should be given to accelerating
efforts to improve the availability of relevant information.
Enhancing the efficiency and effectiveness of health spending also requires comprehensive reforms to the organisation
and management of the health sector. In particular, more
co-ordination across the ambulatory sector and the inpatient care sector could help to achieve productivity gains
and reduce the workload of hospitals. Serious consideration
should be given to the proposals calling for a smaller number of health boards with improved governance structure,
which would improve accountability and facilitate the rationalisation of service provision. Enhanced co-operation
among health boards should be encouraged to reap the
benefits from synergies and economies of scale. This would
help to ensure consistent application of service and quality
standards nation-wide.
Future prosperity
will continue
to depend on
safeguarding
competitiveness
and remaining
attractive to
investment
© OECD 2003
Getting maximum value for money out of public spending will help to improve the quality of public services and to
maintain the current tax environment. This is good for the
citizen’s welfare and for business development generally. It
also helps Ireland to remain an attractive place for the foreign direct investment (FDI) that will continue to play a
major role in the growth process. While Ireland’s low-tax and
other advantages such as English language and well-trained
workers will continue to be positive features in attracting
foreign investment, their merit is likely to diminish in relation to newly emerging competitors, particularly some of the
candidate countries for EU accession. In addition, given the
particularly strong response of productivity growth to FDI it
would not be difficult for these countries to gain cost competitiveness quickly once the scale of FDI is increased.
Faced with this challenge the authorities should at a minimum ensure that inflation in the sheltered sector does not
undermine cost competitiveness given that the Irish price
16
OECD Economic Surveys: Ireland
level converged to the average EU level and is now becoming
among the highest in the region.
Inflation in the
sheltered sector
matters
Inflation in the sheltered sector of the economy matters
for growth in several ways. First, it affects the cost competitiveness of the internationally traded sector to the extent
that the services provided by the sheltered sector serve as
inputs. Second, by raising the cost of living of workers it
pushes up the wage claims in the internationally competing
sector. Third, it influences inward migration that is likely to
constitute an increasing source of labour force growth. The
cost of housing is an important element of domestic inflation and needs to be reined in. The price of housing has
been rising rapidly despite the increasing supply, and as
more new houses have been built further away from the city
centres the commuting time has lengthened and pressures
on infrastructure have intensified. While roads and other
physical infrastructure are being built within the framework
of the National Development Plan, new forms of public
transport such as the light rail system currently under
construction in Dublin would alleviate the problem of
commuting. In parallel, reform in urban planning regulations
seems necessary to promote the housing capacity within the
cities.
Progress in
regulatory reform
has been uneven
and much
remains
to be done
Regulatory reform in the sheltered sector could contribute importantly to enhancing the growth prospect by weakening the pricing power of incumbents and boosting
productivity. Good progress has been made in strengthening competitive forces in some areas such as telecommunications and taxis. Moreover, the Competition Authority has
seen both its independence and resources substantially
reinforced in line with the recommendations made by the
OECD. In contrast, progress has been sluggish in most other
areas, including pubs and legal and other professions, and
further steps are necessary even in those areas where good
progress has been made. In electricity, the creation of a
power exchange would considerably promote the development of additional generating capacity by independent generators. This could and perhaps should be further
encouraged by making an ownership separation between
generation and transmission assets, and splitting the Elec-
© OECD 2003
Assessment and recommendations
17
tricity Supply Board’s generating capacity into a number of
competing units. In pharmacies, an arbitrary rule limiting the
operation of pharmacists trained outside the country should
be abolished. New initiatives to bring in more competition
to land transport and airport operations are welcome, but
they need to be followed through.
Strengthening
focus on
consumer
interests not only
enhances welfare
but also helps the
growth process
A key to future reform process, however, is the proposed National Policy Statement on Regulation that sets
down the principles for the regulatory system. To mark a
clear departure from the traditional policy focus on producer interests, the principles should anchor the regulatory
system firmly in competition policy. There appears to be an
increasing realisation among Irish people that the legacy of
protecting producer interests in the sheltered sector at the
expense of consumer interests is not only hurting their own
welfare but also the competitiveness of the economy. The
anti-inflation initiative in the new partnership agreement is
a concrete manifestation of such a realisation. It is hoped
that this initiative reinforces the role of the Competition
Authority in fighting unhealthy pricing power in sectors
where competitive forces are still inadequate.
The success
in upgrading
investment will
depend on the
availability of
high-quality
human capital
While safeguarding cost competitiveness helps, for a
high income country like Ireland to continue to grow there is
no escaping a shift in the supply structure towards higher
value added. The authorities are now trying to promote
higher value-added investment, through encouraging existing
domestic and foreign companies to engage in knowledgeintensive activities and by inviting innovation-oriented new
FDI. Given the large-scale presence of high-tech foreign
companies, there appear to exist some economies of
agglomeration, as illustrated by successful cases of domestic venture start-ups and diversification of activities by multinationals, notably in Dublin. The success of the strategy of
upgrading business activity will, however, depend importantly on how many high-skilled workers and researchers
Ireland can provide or attract.
© OECD 2003
18
OECD Economic Surveys: Ireland
… that can be
increased by
the reform of the
innovation system
and education
and training
With the rapidly upgrading skill requirements, higher
education institutions now face the challenges to increase
enrolment and retention rates, to maintain high standards of
teaching and to further develop research capability.
Research and development activities at the universities are
being strengthened by the unprecedented increase in the
funding for research, which needs to be allocated based on
competitive evaluation by a third party. In addition, more
systematic efforts will be needed to address the weaknesses in technology transfer and commercialisation of
research results through an improved co-operation between
businesses and higher education institutions, while ensuring competition between different consortia. Emphasis has
also been placed on improving human capital at work, by
encouraging lifelong learning and business investment in
training, for example through the “skillnets” initiative. Flexible arrangements are being introduced to allow employed
early school-leavers to obtain certificates on a part-time
basis. The increased number of mature age students seeking learning opportunities could be accommodated more
effectively by introducing flexibility into the traditionally
rigid system of student selection and administration in
higher education institutions.
Growth should
also be
environmentally
sustainable
Continuing economic growth should also be environmentally sustainable. Achievement of this objective is being
aided by the increasing use of economic instruments. Carbon
taxation is being considered to reduce greenhouse gas emissions and would be a step forward, provided that tax rates are
uniform across all sectors and in line with expected prices for
EU emission permits. The peat industry should not be
exempt from such taxation. Waste management is also moving in the right direction with the introduction of a landfill tax,
weight-based charges for households and use of producer
responsibility levies. Taxes and levies should, however, be
soundly anchored to measured externalities and should not
be used to meet arbitrary targets. While there is no shortage
of water and clean rivers, water quality has deteriorated.
There seems no reason to continue to finance household
water supplies and waste water treatment from general taxation. The main environmental problem, seen as excess nutrient content in rivers, will be addressed in the context of the
© OECD 2003
Assessment and recommendations
19
development of a national action programme to give effect to
the Nitrates and other Directives. This effort should include the
use of economic instruments.
In conclusion
© OECD 2003
Having slowed down sharply, the Irish economy is now
faced with the challenge of securing the basis for future growth.
Income expectations seem to be adjusting to the new reality,
and so does the 2003 budget. Yet difficult tasks remain in safeguarding cost competitiveness, moving up the value chain,
securing sound public finances, ensuring value for money in
public services and making growth environmentally sustainable. Safeguarding cost competitiveness and enhancing welfare require new initiatives to contain housing prices as well as
stepped-up reform efforts in much of the sheltered sector of
the economy, including the public sector, which affects prices
through both taxation and public charges. Fiscal policy needs
to guard against complacency, and to move back towards balance, or a surplus if circumstances require, over the mediumterm, while focussing on improving the structure of the economy. To maintain a growth-friendly tax environment and ensure
fiscal sustainability, it is essential to further improve the management of public expenditure by: harnessing an output orientation and top-down approach in budgeting; assessing projects
on their relative merits; giving local governments both greater
freedom and responsibility in decision making; and taking
advantage of market mechanisms in some appropriate areas of
the provision of merit goods. To break away for good from the
legacy of protecting producer interests, the National Policy
Statement on Regulation should establish principles for the
regulatory system that are firmly based on the idea of promoting competition. Linked to this, the high value-added orientation of business investment strategy requires enhanced quality
of human capital and capacity for innovation, the efficient provision of which is most likely achieved through a system where
competition plays an important role. In sum, with the Irish
economy moving to a rather slower growth path than in the second half of the 1990s, both income expectations and public
finances are having to adjust. But taking full advantage of Ireland’s growth potential requires a range of structural reforms, in
both the public and the private sectors, to create a more
competitive environment and contribute to continuing
prosperity and enhanced welfare.
I.
Adjusting to slower growth and ensuring
prosperity
The nature of the growth slowdown
Ireland’s remarkable growth performance that began from the mid-1990s
and continued into the start of the new millennium has led to rapid convergence
of productivity levels towards the EU average, while employment growth has also
been exceptionally strong. Living standards have increased dramatically as a
result. Between 1995 and 2000 real GDP grew by an annual average of nearly
10 per cent. It slowed sharply in 2001 to 5.7 per cent but is estimated to have
grown at about the same rate in 2002. The resilience in terms of GDP is in marked
contrast to the sharper slowdown evident in terms of GNP, which is estimated to
have slowed to below 2 per cent in 2002 from 4.6 per cent in 2001 and a high of
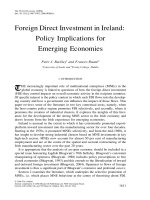
10.7 per cent in 2000 (Figure 1). This reflects a continued expansion of the large
multinational sector operating in Ireland.1
Growth since the mid-1990s had been clearly above the economy’s potential growth rate, though it is difficult to measure this given the endogenous nature
of both productivity and labour supply. The Irish population structure in the 1990s
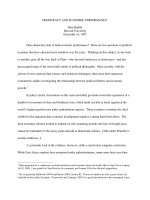
has been unusually favourable in increasing labour supply. The expansion in the
labour force has been much greater than in the rest of the EU, reflecting different
demographic circumstances; namely rising female participation rates, inflows of
migration, a high rate of natural increase and a corresponding reduction in age
dependency (Figures 2 and 6). But the available pool of labour that existed at the
start of the 1990s has effectively been exhausted as the Irish economy moved to
full employment levels in recent years. The unemployment rate fell from as high
as 15.7 per cent in April 1993 to a low of 3.7 per cent in the first half of 2001, which
led to increased recruitment difficulties.
Above potential growth has also resulted in growing infrastructure pressures as evidenced by rapid house price increases, congestion and longer commuting times, particularly in Dublin.2 Competitiveness has been reduced by price
and wage inflation, which has been reinforced by infrastructure constraints. Given
these considerations, growth has had to slow sooner or later even though the shift
down in Irish economic growth has been undoubtedly linked to internationally
© OECD 2003
OECD Economic Surveys: Ireland
22
Figure 1.
Growth in GDP and GNP: the widening gap
Per cent change
Per cent
Per cent
12
12
10
10
GDP
GNP
8
8
6
6
4
4
2
2
0
1991
1992
1993
1994
1995
1996
1997
1998
1999
2000
2001
2002
0
Source: Central Statistics Office.
Figure 2. Irish labour force growth
Annual per cent change
Per cent
Per cent
8
8
7
7
Total labour force
Females
6
6
5
5
4
4
3
3
2
2
1
1
0
0
-1
-1
-2
1999
2000
2001
2002
-2
Source: Central Statistics Office.
© OECD 2003
Adjusting to slower growth and ensuring prosperity
23
weak FDI flows that fed into a fall in the number of employed in the multinational
companies, particularly in the ICT sector.
The apparent resilience of economic activity is, however, somewhat surprising given the series of economic shocks that affected the Irish economy
between mid-2000 and 2002. Dependence on foreign direct investment (FDI),
especially in high-tech sectors originating in the United States, meant that Ireland
was particularly exposed to the slowdown in the technology sector from mid-2000.
Furthermore, the foot and mouth disease scare and the containment measures
invoked curtailed domestic activity in the first half of 2001. The slowdown in world
economic activity in the wake of the September 11 terrorist attacks, corporate
accounting scandals and the on-going threat of war throughout 2002 suggested
that an open-economy like Ireland’s would have been expected to experience a
much pronounced slowdown in economic activity. The diversification in FDI
investment in recent years would seem to have helped buffer Ireland’s growth
performance from the full impact of these shocks. While sectors like ICT, tourism
and agri-food took the brunt of the shocks, biomedical and pharmaceutical sectors
continued to perform strongly in the difficult global trading environments.3 As
well, while machinery and equipment investment weakened sharply, housing
construction and public investment, mainly in road building, has remained quite
strong. The continued expansion of public investment associated with the
implementation of the National Development Plan, together with the large scale
of hiring by the public sector, suggests that fiscal policy was expansionary.
A persistent and widening gap between GDP (a measure of all economic
activity in Ireland) and GNP (a measure of activity by Irish nationals) is an important feature of the Irish economy that has depended heavily on foreign direct
investment. The gap corresponds to net factor income payments, mostly profits
accruing to foreign companies operating in Ireland. It has increased from 4 per
cent of GDP in 1980 to 11.4 per cent in 1990, and further to an estimated 19.8 per
cent in 2002. As Figure 1 shows, the gap can be volatile, reflecting a large fluctuation in the composition of production by sectors that are rather narrowly-based
and have varying profit margins (see Annex III).
The demand for labour throughout the economy has begun to slacken
over the last eighteen months. The unemployment rate began to rise from its historical lows to some 4.4 per cent in 2002. The rebound in the unemployment rate
has not been as substantial as might have been expected, partly because of the
strong growth in public sector jobs. The muted rise in unemployment may also
reflect labour hoarding following the shortages and recruitment difficulties of
recent years. Employment in the private sector, however, has ceased to grow.
Labour force growth slowed significantly during 2002. Even the rise in
female participation rates slowed during 2002. Somewhat contrary to expectations,
given cost of living increases and the rapid increase in house prices, migration
© OECD 2003
OECD Economic Surveys: Ireland
24
flows into Ireland have remained strong with the net inflow into the country reaching
28 800 in the year to April 2002 (the latest available data), up from 26 300 a year
earlier (Figure 3). These high migration flows could reflect the more pronounced
slowdown in other economies making Ireland still attractive for relocation.
In the face of the slowdown in activity from the highs of the 1990s, inflation
remains the highest in the euro area, reflecting rapid price increases in the nontraded sectors of the economy, particularly services. Having remained low for
much of the exceptional growth phase, higher inflation appeared to become more
entrenched throughout 2001 and 2002 (Figure 4). Although the impact of some
one-off factors from 2001 has worn off, the inflation rate in 2002 remained persistently high due mainly to non-traded service inflation. One important factor
behind the high service price inflation is a rapid rise in housing prices, which
affected inflation both directly through greater interest payments and indirectly
through larger wage claims.
Despite concerns about a possible bubble, housing price increases
slowed in 2001, partly as a result of the strong supply response with another new
peak being set for house completions. Having increased stamp duties and
removed mortgage interest deductibility against rental income in recent years, the
authorities reversed these measures in the 2002 budget, which provided a boost
Figure 3. Immigration
Net immigration, thousands
Thousands
30
25
20
Thousands
30
United Kingdom
Other EU
United States
Rest of the world
Total net migration
25
20
15
15
10
10
5
5
0
0
-5
-5
-10
1996
1997
1998
1999
2000
2001
2002
-10
Source: Central Statistics Office.
© OECD 2003