Material Modelling In The Seismic Response Analysis For The Design Of Rc Framed Structures
Bạn đang xem bản rút gọn của tài liệu. Xem và tải ngay bản đầy đủ của tài liệu tại đây (1.56 MB, 10 trang )
Engineering Structures 27 (2005) 1014–1023
www.elsevier.com/locate/engstruct
Material modelling in the seismic response analysis for the design of RC
framed structures
Pankaj Pankaj∗, Ermiao Lin
School of Engineering and Electronics, The University of Edinburgh, Edinburgh, UK
Received 14 June 2004; received in revised form 3 February 2005; accepted 3 February 2005
Available online 8 March 2005
Abstract
Two similar continuum plasticity material models are used to examine the influence of material modelling on the seismic response
of reinforced concrete frame structures. In the first model reinforced concrete is modelled as a homogenised material using an isotropic
Drucker–Prager yield criterion. In the second model, also based on the Drucker–Prager criterion, concrete and reinforcement are included
separately. While the latter considers strain softening in tension the former does not. The seismic input is provided using the Eurocode 8
elastic spectrum and five compatible acceleration histories. The results show that the design response from response history analyses (RHAs)
is significantly different for the two models. The influence of compression hardening and strength enhancement with strain rate is also
examined for the two models. It is found that the effect of these parameters is relatively small. In recent years there has been considerable
research in nonlinear static analysis (NSA) or pushover procedures for seismic design. The NSA response is frequently compared with that
obtained using RHA, which also uses the same material models, to verify the accuracy of the static procedure. A number of features exhibited
by reinforced concrete during dynamic or cyclic loading cannot be easily included in a static procedure. The design NSA and RHA responses
for the two material models are compared. The NSA procedures considered are the Displacement Coefficient Method and the Capacity
Spectrum Method. A comparison of RHA and NSA procedures shows that there can be a significant difference in local design response even
though the target deformation values at the control node are close. Moreover, the difference between the mean peak RHA response and the
pushover response is not independent of the material model.
© 2005 Elsevier Ltd. All rights reserved.
Keywords: Seismic design; Continuum plasticity; Response history analysis; Pushover methods
1. Introduction
Economic considerations and the seismic design philosophy dictate that building structures be able to resist major
earthquakes without collapse but with some structural damage. Therefore it is imperative that seismic design is based
on nonlinear analysis of structures. For the nonlinear analysis of reinforced concrete structures a variety of models
have been considered [1,2]. These include: linear elasticfracture models; hypoelastic models; continuum plasticity
models; hysteretic plastic and degrading stiffness models;
∗ Corresponding address: School of Engineering and Electronics, The
University of Edinburgh, Alexander Graham Bell Building, Edinburgh EH9
3JL, UK. Tel.: +44 131 6505800; fax: +44 131 6506781.
E-mail address: (P. Pankaj).
0141-0296/$ - see front matter © 2005 Elsevier Ltd. All rights reserved.
doi:10.1016/j.engstruct.2005.02.003
and continuum damage models. The most commonly used
models for RC frame structures are hysteretic plastic and
degrading stiffness models [e.g. [3,4]].
Numerical simulation of the behaviour of plain and
reinforced concrete using continuum plasticity models has
been a subject of intense research and the past two
decades have seen the development of a plethora of
diverse mathematical models for use with finite element
analyses [5–9]. Most of these models have been validated
and used for static (or slow cyclic) analyses and there is
little evidence of continuum plasticity models finding a place
in the seismic analysis of framed structures. This paper
examines the influence of two similar continuum plasticity
models, the Drucker–Prager (DP) model and the Concrete
Damaged Plasticity (CDP) model, on the analytical seismic
response of a framed structure. While both these models are
P. Pankaj, E. Lin / Engineering Structures 27 (2005) 1014–1023
1015
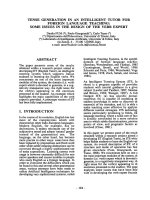
Fig. 1. The four-storey frame used: (a) dimension; (b) beam cross-section; (c) column cross-section.
essentially based on the Drucker–Prager yield criterion [10],
the latter is capable of incorporating complex features such
as strain softening in tension, hardening in compression and
stiffness degradation. The influence of material modelling
on seismic response was considered earlier briefly by the
authors [11] and in this paper this influence is examined in
detail for a simple reinforced concrete plane frame.
Nonlinear response history analysis for several possible
ground motions, as prescribed by a number of codes,
makes seismic design of structures very complicated. As
a result, there has been considerable research to develop
displacement based nonlinear static analysis (NSA) or
pushover procedures that can provide seismic design values.
NSA response is frequently compared with that obtained
using response history analysis (RHA), which also uses the
same material models, to verify the accuracy of the static
procedure. A number of features exhibited by reinforced
concrete during dynamic or cyclic loading (e.g. progressive
degradation with each cycle of loading, influence of strain
rate) cannot be easily included in a static procedure.
Therefore it is important to examine whether the difference
between the design RHA and NSA response is influenced by
the choice of material models. In other words, the hypothesis
that the comparison between a given NSA and RHA
procedure will show similar trends for different material
models needs to be tested.
Displacement-based NSA procedures exist in several
codes and guidelines in one form or the other [12–15].
The existing nonlinear static techniques can be broadly
divided into two categories: Displacement Coefficient
Method (DCM) [13,14,16,17] and Capacity Spectrum
Method (CSM) [15,18–20]. The common feature of
these techniques is that appropriately distributed lateral
forces are applied along the height of the building,
and then monotonically increased with a displacement
control until a certain deformation is reached. The
key difference between the CSM and DCM procedures
is that the former usually requires formulation in an
acceleration–displacement format.
Theoretically, for a general nonlinear multiple degrees
of freedom system, the peak seismic response (required for
design) can only be approximated by a static procedure.
There has been considerable research directed towards
improving pushover procedures so they can reflect various
aspects of a nonlinear dynamic analysis. For example,
Chopra and Goel [16,17] proposed a modal pushover
procedure to include contribution of higher modes. Chopra
and Goel [18] provided a method to determine a capacitydemand diagram, in which the displacement demand was
determined by analysing inelastic systems in place of
equivalent linear systems. The suggested method used the
constant-ductility design spectra and was shown to be an
improvement over the ATC-40 [15] procedures. Farfaj and
co-workers [19,20] extended the CSM procedure to include
cumulative damage and called the method N2. The method
has been shown to be a significant improvement over CSM
and in many studies N2 is referred as a method distinct
from CSM. This paper examines this difference between the
design RHA and NSA response for both DCM and CSM
procedures for a simple frame.
2. The test structure and material modelling
The test structure used to evaluate the influence of
material modelling was a single-bay, four-storey frame.
The reinforced concrete members were modelled using
Drucker–Prager plasticity and concrete damaged plasticity.
In each case a number of variations were considered.
2.1. The test structure
The test structure is shown in Fig. 1. The total mass
including live load for the frame is 97 000 kg. The columns
were assumed fixed at the base. A damping ratio of 5%
was assumed. The finite element model used two-node cubic
beam elements. The finite element mesh comprised of four
elements (for two columns) in each storey and four elements
representing beams at each floor level.
1016
P. Pankaj, E. Lin / Engineering Structures 27 (2005) 1014–1023
2.2. The Drucker–Prager (DP) model
The Drucker–Prager criterion [10] is an approximation
of the Mohr–Coulomb criterion. In the principal stress space
the Mohr–Coulomb criterion is an irregular hexagonal pyramid [21]. Points of singularity at the intersections between
the surfaces of the pyramid can cause computational difficulties, although algorithms exist to overcome these [22]. The
Drucker–Prager criterion, on the other hand, is a smooth circular cone in principal stress space. In the DP model considered in this study, reinforced concrete was treated as a
homogenized continuum. The criterion is pressure sensitive,
which is an important feature of materials like reinforced
concrete that have varying yield strengths in tension and
compression. The Drucker–Prager criterion uses the cohesion and friction angle as parameters to define yield. Cohesion can be determined from compressive, tensile or shear
tests. The advantage of using a simple two-parameter model
is that it provides computational transparency. The properties used with the DP model are given in Table 1. The friction angle β is based on the study by Lowes [7].
Table 1
Material properties used with the DP model
Young’s modulus of reinforced concrete, E
Poisson’s ratio of reinforced concrete, ν
Friction angle, β
Compressive yield strength, f c
28.6 × 10⁹ N/m2
0.15
15◦
20.86 × 10⁶ N/m2
The model was used with both perfect plasticity and
hardening plasticity. For hardening plasticity the hardening
modulus Hc = 0.05E, which is similar to some other
studies [e.g. [23]], was assumed. In this model for perfect
plasticity (PP) the yield surface remains unchanged with
increasing plastic strain. For hardening plasticity the yield
surface expands isotropically. No strain softening is assumed
for this model.
To examine the influence of strain rate on dynamic
response the strength amplification results of Bischoff and
Perry [24] were used. The authors compiled a range of tests
conducted by different investigators and plotted the ratio
of dynamic compressive strength to static strength against
logarithm of the strain rate. They found that there was no
clear increase in strength up to a strain rate of about 5×10⁻⁵ .
At higher strain rates the strength increases linearly on the
above-mentioned log-linear graph. In this study the variation
of strain rate was taken as shown in Fig. 2. This is similar to
the upper limit suggested by Bischoff and Perry [24].
2.3. The concrete damaged plasticity model
The Concrete Damaged Plasticity (CDP) model used
is due to Hibbitt, Karlsson and Sorensen [8]. In this
study the concrete damaged plasticity was used to model
concrete and the reinforcement was modelled separately
Fig. 2. Assumed dynamic strength amplification.
using rebar elements that employed metal plasticity. The
CDP model is applicable for monotonic, cyclic and dynamic
loading. The yield criterion is based on the work by
Lee and Fenves [5] and Lubliner et al. [6]. In biaxial
compression, the criterion reduces to the Drucker–Prager
criterion. The material model uses two concepts, isotropic
damaged elasticity in association with isotropic tensile and
compressive plasticity, to represent the inelastic behaviour
of concrete. Both tensile cracking and compressive crushing
are included in this model. This means the evolution of the
yield surface is controlled by both compression and tension
yield parameters. In the elastic regime, the response is linear.
Beyond the failure stress in tension, the formation of microcracks is represented macroscopically with a softening
stress–strain response, which induces strain localisation. The
post-failure behaviour for direct straining is modelled using
tension stiffening, which also allows for the effects of the
reinforcement interaction with concrete. In compression the
model permits strain hardening prior to strain softening.
Thus, this material model reflects the key characteristics of
concrete well. The interaction of the rebar and concrete,
such as bond slip, is modelled through concrete’s tension
stiffening, which can simulate the load transferred across
cracks through the rebar. The rebar within the concrete
element is defined by the fractional distances along the
axes in the cross section of the element. In this study,
only longitudinal reinforcement was included. Bars were
assumed to be elastic-perfectly plastic. To avoid excessive
dissimilarity from the DP model discussed, strain softening
in compression and stiffness degradation were not included.
The material properties that remain unchanged in this model
are given in Table 2.
In compression either perfect plasticity or hardening plasticity was assumed. For hardening plasticity the hardening
P. Pankaj, E. Lin / Engineering Structures 27 (2005) 1014–1023
1017
Table 2
Material properties used with the CDP model
Young’s modulus of concrete, E c
Young’s modulus of reinforcement, E s
Poisson’s ratio of concrete, ν
Dilation angle, ψ
Ratio of initial equibiaxial compressive yield stress
to initial uniaxial compressive yield stress, σb0 /σc0
Ratio of the second stress invariant on the tensile
meridian to that on the compressive meridian, K c
Compressive yield strength, f c
Initial tensile crack stress, σt1
Yield stress for reinforcement, f y
28.6 × 10⁹ N/m2
20 × 1010 N/m2
0.15
15◦
1.16
2/3
20.86 × 10⁶ N/m2
1.78 × 10⁶ N/m2
460 × 106 N/m2
modulus Hc = 0.05E c (for concrete) was assumed. No
strain softening is assumed in compression. Although it is
now well recognised that strain softening is not a material
property and the strain softening modulus has mesh (or element) size dependence [e.g. [25]]; for simplicity, a constant
strain softening modulus in tension of HT = −0.122E c was
assumed for all CDP analyses. The influence of strain rate
was also considered and included as discussed for the DP
model.
3. Earthquake loading
In this study the seismic excitation is prescribed using the
elastic design spectrum of Eurocode 8 [12] corresponding to
Soil Subclass B (limits of the constant spectral acceleration
branch TB = 0.15 s and TC = 0.60 s respectively) were
taken with 5% critical damping and amplification factor
of 2.5. The peak ground acceleration used was 0.3g. The
pushover analysis procedures adopted use this spectrum
directly.
For response history analyses, to avoid the peculiarity
of a particular time history, five compatible time histories
are used as suggested by Eurocode 8. For the generation
of time histories, the program developed by Basu et al.
[26] was used. The algorithm uses a target spectrum or
design spectrum that is defined using straight lines on
a tripartite plot. The algorithm makes use of modulated
filtered stationary white noise to produce an artificial
accelerogram. It begins with a random number generator
and the amplitudes are continuously modified in the iterative
process. The artificially generated accelerograms have a
clear rise phase, a strong motion phase and a decay phase.
Five acceleration time histories (called V, W, X, Y and
Z) were generated. A typical simulated earthquake ground
acceleration history is shown in Fig. 3(a). The response
spectrum of this generated acceleration history is compared
with the design spectrum of Eurocode 8 in Fig. 3(b). For
convenience, the elastic design spectrum is normalised with
respect to the peak ground acceleration. The computation
of the response spectrum from acceleration histories was
conducted at 159 periods. At each period the ratio of the
computed pseudo-acceleration (spectral acceleration value
Fig. 3. (a) A typical generated acceleration history and (b) its compatibility
to the design spectrum.
from the response spectrum of the acceleration history) and
the target value (spectral acceleration corresponding to the
elastic design spectrum) was obtained. The statistics of these
spectral ratios shows that the response spectra of simulated
histories match the target spectrum well. All generated
histories were also checked to ensure that they satisfy the
requirements of Eurocode 8.
4. Analytical methods
The RHAs were conducted using an implicit integration
approach [8]. The acceleration time history was generated
at 0.01 s intervals, but the integration scheme provides
an automatic time step adjustment based on a half step
residual concept [27]. A single parameter operator [28]
with controllable numerical damping is used to remove high
frequency noise, due to time step change [29], through the
introduction of numerical damping.
As discussed, two pushover analysis techniques are used.
The DCM approach was based on FEMA 273 [13]. FEMA
273 recommends that two different loading patterns be
1018
P. Pankaj, E. Lin / Engineering Structures 27 (2005) 1014–1023
Fig. 4. Top displacement history in the DP structure subjected to ground
motion V.
considered. However, in this study the loading is applied
according to the first mode pattern only. FEMA 273 does
not provide a clear methodology for the determination of
yield displacement and strength from the pushover curve.
The bilinear curve determined from the pushover curve is
often sensitive to the target displacement. This has been
recognised in FEMA 274 [14]. In this study an iterative
process was used to evaluate the yield values. Since the
process is load controlled, it is often necessary to use the
Riks procedure [8] to avoid problems with convergence.
The CSM procedure adopted is numerical (rather than
graphical) based on the studies of Fajfar [20], Chopra and
Goel [18] and Vidic et al. [30].
5. Influence of material modelling on dynamic response
5.1. DP material model
Typical responses of the frame for excitation history V
are shown in Figs. 4 and 5. In these figures HP denotes
hardening plasticity and PP denotes perfect plasticity. The
value ‘0’ indicates that strain rate effects are not included,
while ‘001’ indicates that they are. The figures show that
inclusion or exclusion of strain rate or hardening makes
little difference to the overall frequency content of the
response. However, for this model the amplitude quantities
for different cases appear to suffer an influence, albeit this is
not significant.
The values of typical peak responses were examined for
all time histories. The peak top deformation (Table 3) shows,
as one would expect intuitively, the inclusion of strain rate
effect on strength reduces the peak deformation. Further,
the peak value is influenced more significantly for some
time histories than for others. The response to excitation
Z shows a 23% difference due to strain rate. On the other
hand the difference is only about 2% for excitation W. This
Fig. 5. Base shear history in the DP structure subjected to ground motion V.
indicates that the response induced by the peculiar nature
of a time history can sometimes cause a strain rate that is
sufficiently significant to affect peak response. The influence
of the hardening parameter also varies significantly from
one excitation to another. The maximum variation due to
the hardening parameter is for excitation V. It is interesting
to note that in the dynamic environment hardening can
cause either an increase or decrease in the peak deformation
response. Comparing the peak responses from different
excitation histories with the mean values shows the largest
difference for the case DP-PP with strain rate effect included
for the excitation history X. In general, the peak values vary
far more significantly when different spectrum compatible
time histories are used than due to inclusion of hardening or
strain rate.
Table 3
The peak top deformation (m) in the DP structure
Model
Strain rate
included
Earthquake history
Mean
V
W
X
Y
Z
DP-HP
No
Yes
0.20
0.17
0.15
0.15
0.26
0.24
0.18
0.17
0.21
0.16
0.20
0.18
DP-PP
No
Yes
0.18
0.16
0.14
0.14
0.27
0.24
0.18
0.15
0.21
0.17
0.20
0.17
The peak base shear variations were also examined
(Table 4) and show that the variation of base shears for
different histories is not as significant as top deformation.
The inclusion of hardening generally tends to increase
the base shear, as does the inclusion of strain rate effect.
Examining the local parameter — moment at a base node
again showed a significant influence of strain rate and
hardening parameter for some excitation histories.
P. Pankaj, E. Lin / Engineering Structures 27 (2005) 1014–1023
1019
Table 4
The peak base shear (kN) in the DP structure
Model
Strain rate
included
Earthquake history
Mean
V
W
X
Y
Z
DP-HP
No
Yes
236
262
219
237
239
267
230
205
254
271
236
249
DP-PP
No
Yes
225
226
226
206
204
238
215
195
239
259
222
225
Fig. 7. Base shear history in the CDP structure subjected to ground
motion V.
Fig. 6. Top deformation history in the CDP structure subjected to ground
motion V.
5.2. CDP material model
Some typical responses of the structure subjected to
excitation V and modelled using CDP are shown in Figs. 6
and 7. The nomenclature used in these figures is similar
to that used earlier, i.e. HP and PP stand for hardening
and perfect plasticity respectively; ‘0’ and ‘001’ indicate
exclusion and inclusion of strain rate effects respectively.
For this model the response histories show that there is
negligible influence of hardening parameter or strain rate on
the design parameters.
Once again the peak values of various response quantities
were examined. For example Table 5 lists the peak top
deformations. From Table 5 it can be seen that there is
little influence of strain rate for any of the five earthquakes.
Comparing the response between the hardening and perfect
plasticity, it can be seen that the differences are again
small with maximum for earthquake Y (∼5%). The major
difference in the peak response is again due to different
excitation histories. For example the top deformation of
earthquake history X is around 28% higher than the mean
peak value. The analysis showed that the peak strain rate
during seismic excitation was around 0.004 per second.
However, this did not appear to influence the peak response
significantly. Similarly it can be seen that the influence of
strain rate on base shear (Table 6) is small for different
earthquake histories with the maximum of around 4%.
The influence of hardening parameter is even smaller.
Interestingly, the base shear values did not vary significantly
for different earthquake histories. The maximum variation
was found to be around 8% from the mean. This indicates
that earthquake excitation histories have larger influence on
top deformation than on base shear. This is clearly due to the
generally flat load–displacement response in the post-elastic
range.
Table 5
The peak top deformation (m) in the structure modelled using CDP
Model
Strain rate
included
Earthquake history
Mean
V
W
X
Y
Z
CDP-HP
No
Yes
0.18
0.18
0.17
0.17
0.27
0.26
0.18
0.17
0.25
0.24
0.21
0.21
CDP-PP
No
Yes
0.18
0.18
0.17
0.17
0.27
0.26
0.17
0.16
0.25
0.25
0.21
0.21
Table 6
The peak base shear (kN) in the structure modelled using CDP
Model
Strain rate
included
Earthquake history
Mean
V
W
X
Y
Z
CDP-HP
No
Yes
122
125
128
129
124
125
119
123
136
138
126
128
CDP-PP
No
Yes
121
125
125
127
122
125
118
122
134
137
124
127
The response of a local parameter, namely the peak moment at a base node (not shown), indicated a slightly higher
variation due to the strain rate effect (maximum ∼9%),
1020
P. Pankaj, E. Lin / Engineering Structures 27 (2005) 1014–1023
Fig. 8. Top deformation history for different material models for
excitation V.
Fig. 9. Base shear history for different material models for excitation V.
but the influence of the hardening parameter was still found
to be small (maximum ∼4%).
The above results show that the hardening parameter and
strain rate effects as used in this study have little influence
on the peak response for the CDP model.
5.3. Comparison of response for CDP and DP material
models
In this section, the response of the frame structure when
modelled using CDP and DP is compared. It should be
noted that both the models are based on the Drucker–Prager
criterion. Although CDP and DP models come into play only
in the post-elastic domain, it is important to realise that the
two models are slightly different even in the elastic domain
— the CDP model includes reinforcement bars separately
whilst the DP model does not. As a result the CDP model
has slightly higher natural frequencies.
Figs. 8–10 show the variation of typical responses for
the two material models. For ease in comparison, strain
rate effects have not been included. These figures show that
the response histories can be significantly different when
two different material models are used. It is also interesting
to see that the peaks and troughs for the two models are
similarly located. It can be seen that the direction of the peak
response can be different for the two models. For example,
the maximum top deformation in the DP model is positive
whilst the same quantity for the CDP model is negative
(Fig. 8). The peak values also occur at different times.
Time history of the internal force responses shown in
Fig. 9 (base shear) and Fig. 10 (moment at a base node) are
consistently smaller for the CDP model. This is apparently
because of strain softening included in the CDP model.
Comparing the mean peak values from the five earthquakes
for the two material models, it can be seen that the mean top
deformations (Tables 3 and 5) are not significantly different;
on the other hand, the base shear values (Tables 4 and 6)
Fig. 10. History of moment at a base node for different material models for
excitation V.
are almost half for the CDP models when compared to the
DP models. Thus the mean reflects what is observed for the
excitation V in Figs. 8 and 9. Even more dramatic variation
is seen for the mean value of the moment at the base node.
The peak moment response from the Drucker–Prager model
is about two and half times the value from the CDP model.
The low internal force peak responses from the CDP model
are clearly due to strain softening in tension.
6. Performance of pushover procedures for different
material models
The performance of pushover analysis procedures is
generally evaluated against response history analysis.
Clearly for both analysis procedures the same material
model is used. Thus the inherent assumption made is that
if the two procedures compare well for a given material
model they would do so for another. In this section the
P. Pankaj, E. Lin / Engineering Structures 27 (2005) 1014–1023
1021
Table 7
Peak responses from RHA, DCM and CSM for CDP and DP structures
Response quantity
CDP-HP
RHA
DCM
CSM
DP-HP
RHA
DCM
CSM
Deformation (m) floor 4
Deformation (m) floor 3
Deformation (m) floor 2
Deformation (m) floor 1
Base shear (kN)
Moment base node (kN m)
0.209
0.181
0.130
0.061
126
132
0.206
0.173
0.121
0.055
98
69
0.201
0.168
0.116
0.051
97
70
0.199
0.145
0.086
0.032
236
358
0.182
0.134
0.079
0.028
166
329
0.179
0.131
0.077
0.027
166
328
pushover analysis procedures are evaluated with respect
to response history analysis for different material models.
The motivation is to examine how these nonlinear static
procedures perform without the inclusion of cyclic loading
presented in a real seismic situation for different material
models. Both CDP and DP material models are considered.
For both models only the hardening plasticity cases are
included. Once again the four-storey single-bay frame
discussed earlier is used.
Using pushover procedures the target displacement was
obtained for both DCM and CSM procedures. These are
given in Table 7 (deformation floor 4) along with the
peak deformation obtained from RHA. The RHA values
are the mean of the peak deformation values from the
five earthquake motions. It can be seen that the target
displacement from pushover procedures match the RHA
values very well, more so for the CDP model than for the
DP model. In general the pushover values are slightly lower
than the RHA values.
For pushover procedures the monotonically increasing
lateral forces were applied based on the fundamental mode.
In Table 7 typical responses for the pushover procedures
are compared with the mean peak RHA values for some
typical response quantities. It can be seen that while the top
deformation values from DCM and CSM match the RHA
values closely, the error increases for deformation in lower
floors for both CDP and DP structures. The base shear values
are underestimated by the pushover procedures by around
22% for the CDP structure and by about 30% for the DP
structure. The moment for a node at the base of the frame is
underestimated by about 47% and 8% respectively.
The variation of inter-storey drifts is shown in Figs. 11
and 12. It may be noted that for RHA, the drifts are not
evaluated from the peak deformations, but from the peak
of the time-wise variation of drifts. It can be seen that the
pushover procedures underestimate the drift of the lowest
storey and overestimate the drifts of other storeys for the
CDP model. However, for the DP model the drifts are
underestimated for all storeys by the pushover procedures.
Thus the difference in results between RHA and pushover
response is not similar for the two material models.
These comparisons between the design response obtained
using RHA and pushover analysis procedures show two
important features. Firstly, they show that for a given
Fig. 11. Heightwise variation of storey drifts for CDP-HP structure.
Fig. 12. Heightwise variation of storey drifts for DP-HP structure.
material model the two design responses can be significantly
different. Improvement of pushover procedures so that they
can accurately calculate the design response for a dynamic
problem has been a subject of active research in the
past decade. The fact that some of the design quantities
differ significantly from the RHA responses even when the
evaluation of the top displacement response is relatively
accurate can be partly attributed to the choice of the loading
1022
P. Pankaj, E. Lin / Engineering Structures 27 (2005) 1014–1023
pattern that assumes that the response is controlled by the
fundamental mode even in the post-elastic regime. This is
consistent with previous findings [16].
The second and perhaps a more interesting feature
demonstrated by the results is that the difference between
pushover and RHA response is not independent of the
material model. In other words this means that even if
pushover and RHA responses closely match for a particular
material model they may be different for another. The cause
of these relative differences can be understood by examining
the two material models used in this study. The DP model
essentially behaves like a bilinear force–deformation model
of the kind used in previous pushover studies [16,17]. During
monotonically increasing lateral loading of a pushover
analysis both branches of hysteretic force–deformation
relationship are utilized in a manner not too different from
a cyclic loading situation. Thus a simple model of this
kind is more likely to provide a better match between
the pushover and RHA response as the key attributes of
the model are captured by the pushover procedure. Indeed
examining Fig. 12 it can be seen that the drift trend for RHA
and pushover procedures are similar along the height. In
fact the difference is largely due to the target deformation
that is underestimated by the pushover procedures (Table 7).
On the other hand the CDP model presents attributes that
cannot be captured by the pushover procedures used. In this
model, while the reinforcement behaves in a bilinear manner
concrete does not. During a loading cycle elements undergo
compression hardening on one face and tensile strength
degradation on the other, followed by tensile degradation
and hardening on respective faces. These complex attributes
of the model are only available in a cyclic loading regime
and not in a monotonically increasing lateral load procedure.
As a result the trend for storey drift for RHA and pushover
procedures can be seen to be different along the height in
Fig. 11 even though the target displacements are close.
7. Conclusions
This simple study shows that the influence of strain rate
on the seismic analysis of reinforced concrete structures is
small. The inclusion of a small value of hardening parameter
has negligible influence on the RHA response for the CDP
model and a small influence for the DP model. For a
given material model the peak RHA response from different
excitation histories causes significantly larger variation than
does inclusion or exclusion of compression hardening and
strain rate parameters. However, when the RHA response
of the two material models is compared a significant
difference is observed. In the CDP model reinforcement is
included separately and it also includes strain softening in
tension, while the DP model treats reinforced concrete as a
homogenized continuum. It is found that although the peak
deformation response (represented by the mean peak RHA
values) is fairly close, the internal force peak response from
CDP is significantly lower than that obtained from DP.
A comparison of RHA response with that obtained using
DCM and CSM procedures shows that there can be a
significant difference in the internal force response between
dynamic and static procedures even though the target
deformation values at the control node match. Moreover, the
difference between the mean peak RHA response and the
pushover response is not independent of the material model,
i.e. the static and dynamic procedures can yield similar
values for one material model and fairly dissimilar values
for another.
8. Notation
The following abbreviations and symbols have been used
in this paper:
CDP
CSM
DCM
DP
HP
PP
E
Ec
Es
fc
fy
HC
HT
Kc
NSA
RHA
β
ν
ψ
σb0 /σc0
σt 1
Concrete damaged plasticity (model)
Capacity spectrum method
Displacement coefficient method
Drucker–Prager (model)
Hardening plasticity
Perfect plasticity
Young’s modulus of reinforced concrete (for
homogenised DP model)
Young’s modulus of concrete (for CDP model)
Young’s modulus of reinforcement (for CDP
model)
Compressive yield strength of concrete
Yield stress for reinforcement (for CDP model)
Hardening modulus
Softening modulus for concrete in tension (for CDP
model)
Ratio of the second stress invariant on the tensile
meridian to that on the compressive meridian for
concrete (for CDP model)
Nonlinear static analysis
Response history analysis
Friction angle
Poisson’s ratio of concrete
Dilation angle
Ratio of initial equibiaxial compressive yield stress
to initial uniaxial compressive yield stress (for CDP
model)
Initial tensile crack stress (for CDP model)
References
[1] CEB. Behaviour and analysis of reinforced concrete structures under
alternate actions inducing inelastic response – vol. 1, General models.
Bull d’ Inf CEB, 210, Lausanne, 1991.
[2] Penelis GG, Kappos AJ. Earthquake-resistant concrete structures.
E&FN Spon; 1997.
[3] Takeda T, Sozen MA, Nielsen NN. Reinforced concrete response to
simulated earthquakes. J Struct Eng Div, ASCE 1970;96(12):2557–73.
P. Pankaj, E. Lin / Engineering Structures 27 (2005) 1014–1023
[4] Saiidi M. Hysteresis models for reinforced concrete. J Struct Eng Div,
ASCE 1982;108(5):1077–87.
[5] Lee J, Fenves GL. Plastic-damage model for cyclic loading of concrete
structures. J Eng Mech 1998;124(8):892–900.
[6] Lubliner J, Oliver J, Oller S, Oñate E. A plastic-damage model for
concrete. Int J Solids Struct 1989;25(3):229–326.
[7] Lowes LN. Finite element modeling of reinforced concrete beamcolumn bridge connections. Ph.D. thesis. Berkeley: University of
California; 1999.
[8] ABAQUS V6. 3. ABAQUS/Standard user’s manual. Pawtucket (RI):
Hibbitt, Karlsson & Sorensen Inc; 2002.
[9] Pivonka P, Lackner R, Mang HA. Shapes of loading surfaces of
concrete models and their influence on the peak load and failure mode
in structural analyses. Int J Eng Sci 2003;41(13–4):1649–65.
[10] Drucker DC, Prager W. Soil mechanics and plastic analysis or limit
design. Q Appl Math 1952;10(2):157–65.
[11] Lin E, Pankaj P. Nonlinear static and dynamic analysis – the influence
of material modeling in reinforced concrete frame structures. In:
Thirteenth world conference on earthquake engineering. 2004, Paper
no 430.
[12] Eurocode 8, CEN. Design provisions for earthquake resistance
of structures, Part 1.1, General rules – seismic actions and
general requirements for structures, Draft for development. European
Committee for Standardization; 1998.
[13] FEMA-273. NEHRP Guidelines for the seismic rehabilitation
of buildings. Washington (DC): Federal Emergency Management
Agency; 1997.
[14] FEMA 274. NEHRP commentary on the guidelines for the seismic
rehabilitation of building seismic safety council. Washington, DC;
1997.
[15] Applied Technology Council. Seismic evaluation and retrofit of
concrete buildings. Report ATC 40, CA, USA; 1996.
[16] Chopra AK, Goel RK. A modal pushover analysis procedure to estimate seismic demands for buildings: theory and preliminary evaluation. Pacific Earthquake Engineering Research Center, University of
California, Berkeley, Report No. PEER- 2001/03; 2001.
[17] Chopra AK, Goel RK. A modal pushover analysis procedure for
[18]
[19]
[20]
[21]
[22]
[23]
[24]
[25]
[26]
[27]
[28]
[29]
[30]
1023
estimating seismic demands for buildings. Struct Dyn Earthq Eng
2002;31(3):561–82.
Chopra AK, Goel RK. Capacity-demand-diagram methods for
estimating seismic deformation of inelastic structures: SDF systems.
Pacific Earthquake Engineering Research Center, University of
California, Berkeley, Report No. PEER-1999/02; 1999.
Fajfar P, Gaspersic P. The N2 method for the seismic damage analysis
of RC buildings. Earthq Eng Struct Dyn 1996;25:31–46.
Fajfar P. Capacity spectrum method based on inelastic demand
spectra. Earthq Eng Struct Dyn 1999;28:979–93.
Pankaj, Moin K. Exact prescribed displacement field solutions in
Mohr Coulomb elastoplasticity. Eng Comput 1996;13:4–14.
Pankaj, Bicanic N. Detection of multiple active yield conditions for
Mohr Coulomb elasto-plasticity. Comput Struct 1997;62:51–61.
Correnza JC, Hutchinson GL, Chandler AM. A review of reference
models for assessing inelastic seismic torsional effects in buildings.
Soil Dyn Earthq Eng 1992;11:465–84.
Bischoff PH, Perry SH. Compressive behaviour of concrete at high
strain rates. Mater Struct 1991;24:435–50.
Bicanic N, Pankaj. Some computational aspects of tensile strain
localisation modelling in concrete. Eng Fracture Mech 1990;35(4–5):
697–707.
Basu S et al. Recommendations for design acceleration response
spectra and time history of ground motion for Kakrapar site.
Earthquake Engineering Studies, EQ∼83-5(revised), Department of
Earthquake Engineering, University of Roorkee; 1985.
Hibbitt HD, Karlsson BI. Analysis of Pipe Whip, EPRI, Report NP1208; 1979.
Hilber HM, Hughes TJR, Taylor RL. Collocation, dissipation and
‘overshoot’ for time integration schemes in structural dynamics.
Earthq Eng Struct Dyn 1978;6:99–117.
Pankaj, Kumar A, Basu S. Interpolation of design accelerogram
for direct integration analysis of concrete structures. In: Bicanic N,
Mang H, de Borst R, editors. Computational modelling of concrete
structures, EURO-C, vol. 2. Pineridge Press; 1994. p. 1091–101.
Vidic T, Fajfar P, Fischinger M. Consistent inelastic design spectra:
strength and displacement. Earthq Eng Struct Dyn 1994;23:507–21.