reading for financial risk manager volume 2
Bạn đang xem bản rút gọn của tài liệu. Xem và tải ngay bản đầy đủ của tài liệu tại đây (13.46 MB, 536 trang )
Readings for
the Financial
Risk Manager
Volume 2
Founded in 1807, John Wiley & Sons is the oldest independent publishing
company in the United States. With offices in North America, Europe,
Australia, and Asia, Wiley is globally committed to developing and marketing
print and electronic products and services for our customers’ professional and
personal knowledge and understanding.
The Wiley Finance series contains books written specifically for finance
and investment professionals as well as sophisticated individual investors
and their financial advisors. Book topics range from portfolio management
to e-commerce, risk management, financial engineering, valuation, and
financial instrument analysis as well as much more.
For a list of available titles, visit our web site at www.WileyFinance.com.
Readings for
the Financial
Risk Manager
Volume 2
RENÉ M. STULZ, EDITOR
RICH APOSTOLIK, EDITOR
GLOBAL ASSOCIATION
OF RISK PROFESSIONALS, INC.
John Wiley & Sons, Inc.
Copyright © 2005 by Global Association of Risk Professionals, Inc. All rights reserved.
Please see Credits for additional copyright and source information. In all instances,
permission credits and source information appear directly on any reprinted chapter.
Published by John Wiley & Sons, Inc., Hoboken, New Jersey.
Published simultaneously in Canada.
No part of this publication may be reproduced, stored in a retrieval system, or transmitted
in any form or by any means, electronic, mechanical, photocopying, recording, scanning,
or otherwise, except as permitted under Section 107 or 108 of the 1976 United States
Copyright Act, without either the prior written permission of the Publisher, or authorization
through payment of the appropriate per-copy fee to the Copyright Clearance Center, Inc.,
222 Rosewood Drive, Danvers, MA 01923, 978-750-8400, fax 978-646-8600, or on the
web at www.copyright.com. Requests to the Publisher for permission should be addressed
to the Permissions Department, John Wiley & Sons, Inc., 111 River Street, Hoboken, NJ 07030,
201-748-6011, fax 201-748-6008, or online at />Limit of Liability/Disclaimer of Warranty: While the publisher and author have used their
best efforts in preparing this book, they make no representations or warranties with respect
to the accuracy or completeness of the contents of this book and specifically disclaim any
implied warranties of merchantability or fitness for a particular purpose. No warranty may
be created or extended by sales representatives or written sales materials. The advice and
strategies contained herein may not be suitable for your situation. You should consult with a
professional where appropriate. Neither the publisher nor author shall be liable for any loss
of profit or any other commercial damages, including but not limited to special, incidental,
consequential, or other damages.
For general information on our other products and services or for technical support, please
contact our Customer Care Department within the United States at 800-762-2974,
outside the United States at 317-572-3993 or fax 317-572-4002.
Wiley also publishes its books in a variety of electronic formats. Some content that appears
in print may not be available in electronic books.
For more information about Wiley products, visit our web site at www.wiley.com.
ISBN-13 978-0-471-78297-1
ISBN-10 0-471-78297-1
Printed in the United States of America.
Contents
Editors’ Note
Acknowledgments
READING 57
Computing Value-at-Risk
Philippe Jorion
Reproduced with permission from Value at Risk, 2nd ed.
(New York: McGraw-Hill, 2001): 107–128.
READING 58
VaR Methods
Philippe Jorion
Reproduced with permission from Value at Risk, 2nd ed.
(New York: McGraw-Hill, 2001): 205–230.
READING 59
Liquidity Risk
Philippe Jorion
Reproduced with permission from Value at Risk, 2nd ed.
(New York: McGraw-Hill, 2001): 339–357.
READING 60
Credit Risks and Credit Derivatives
René M. Stulz
Reproduced with permission from Risk Management and
Derivatives (Mason, Ohio: South-Western, 2003): 571–604.
READING 61
Extending the VaR Approach to Operational Risk
Linda Allen, Jacob Boudoukh, and Anthony Saunders
Reproduced with permission from Understanding Market,
Credit and Operational Risk: The Value at Risk Approach
(Oxford: Blackwell Publishing, 2004): 158–199.
v
vi
READINGS FOR THE FINANCIAL RISK MANAGER
READING 62
Case Studies
Reto Gallati
Reproduced with permission from Risk Management and Capital
Adequacy (New York: McGraw-Hill, 2003): 441–493.
READING 63
What Is Operational Risk?
Douglas G. Hoffman
Reproduced with permission from Managing Operational Risk
(New York: John Wiley & Sons, 2002): 29–55.
READING 64
Risk Assessment Strategies
Douglas G. Hoffman
Reproduced with permission from Managing Operational Risk
(New York: John Wiley & Sons, 2002): 181–212.
READING 65
Operational Risk Analysis and Measurement:
Practical Building Blocks
Douglas G. Hoffman
Reproduced with permission from Managing Operational Risk
(New York: John Wiley & Sons, 2002): 257–304.
READING 66
Economic Risk Capital Modeling
Douglas G. Hoffman
Reproduced with permission from Managing Operational Risk
(New York: John Wiley & Sons, 2002): 375–403.
READING 67
Capital Allocation and Performance Measurement
Michel Crouhy, Dan Galai, and Robert Mark
Reproduced with permission from Risk Management
(New York: McGraw-Hill, 2001): 529–578.
Contents
READING 68
The Capital Asset Pricing Model and Its Application to
Performance Measurement
Noël Amenc and Véronique Le Sourd
Reproduced with permission from Portfolio Theory and
Performance Analysis (West Sussex: John Wiley & Sons,
2003): 95–102, 108–116.
READING 69
Multi-Factor Models and Their Application to
Performance Measurement
Noël Amenc and Véronique Le Sourd
Reproduced with permission from Portfolio Theory and
Performance Analysis (West Sussex: John Wiley & Sons,
2003): 149–194.
READING 70
Fixed Income Security Investment
Noël Amenc and Véronique Le Sourd
Reproduced with permission from Portfolio Theory and
Performance Analysis (West Sussex: John Wiley & Sons,
2003): 229–252.
READING 71
Funds of Hedge Funds
Jaffer Sohail
Reproduced with permission. Lars Jaeger, ed., The New
Generation of Risk Management for Hedge Funds and
Private Equity Investments (London: Euromoney Books,
2003): 88–107.
READING 72
Style Drifts: Monitoring, Detection and Control
Pierre-Yves Moix
Reproduced with permission. Lars Jaeger, ed., The New
Generation of Risk Management for Hedge Funds and
Private Equity Investments (London: Euromoney Books,
2003): 387–398.
vii
viii
READINGS FOR THE FINANCIAL RISK MANAGER
READING 73
Risk Control Strategies: The Manager’s Perspective
Pierre-Yves Moix and Stefan Scholz
Reproduced with permission. Jaffer Sohail, ed., Funds of
Hedge Funds (London: Euromoney Books, 2003):
219–233.
APPENDIX
FRM Suggested Readings for Further Study
Credits
About the CD-ROM
Editors’ Note
he objective of this volume is to provide core readings recommended by
the Global Association of Risk Professionals’ Financial Risk Manager
(FRM®) Committee for the 2005 exam that are not available on the first
Readings for the Financial Risk Manager CD-ROM. The FRM Committee, which oversees the selection of reading materials for the FRM Exam,
suggests 100 readings for those registered for the FRM Exam and any
other risk professionals interested in the critical knowledge essential to
their profession. Fifty-five of these recommended readings appear on the
Readings for the Financial Risk Manager CD-ROM* and 17 appear on
this CD-ROM.
While every attempt has been made by GARP to obtain permissions
from authors and their respective publishers to reprint all materials on the
FRM Committee’s recommended reading list, not all readings were available for reprinting. A list of those readings that are not reprinted on either
the Readings for the Financial Risk Manager CD-ROM or this CD-ROM
can be found in the Appendix of this CD-ROM. In every instance, full bibliographic information is provided for those interested in referencing these
materials for study, citing them in their own research, or ultimately acquiring the volumes in which the readings first appeared for their own risk
management libraries.
GARP thanks all authors and publishers mentioned—particularly those
who graciously agreed to allow their materials to be reprinted here as a
companion text to the Financial Risk Manager Handbook, Third Edition,
by Philippe Jorion. We hope these books of readings prove to be of great
convenience and use to all risk professionals, including those enrolled for
the FRM Exam.
T
*The Editors note that Reading 56, which appears on the first Readings for the Financial Risk Manager CD-ROM, is not on the suggested reading list for the 2005
FRM Exam. To avoid confusion, we have labeled the first reading on Volume 2 as
Reading 57, so that each suggested reading, whether current or dormant, has its
own unique assigned number.
ix
Acknowledgments
his second volume of Readings for the Financial Risk Manager was
made possible through the work of the Global Association of Risk Professionals’ FRM Committee. To choose the readings for the FRM Exam,
the Committee reviewed an extremely large number of published works.
The readings selected were chosen because they meet high expositional
standards and together provide coverage of the issues the Committee expects candidates to master.
GARP’s FRM Exam has attained global benchmark status in large part
because of the hard work and dedication of this core group of risk management professionals. These highly regarded professionals have volunteered their time to develop, without a historical road map, the minimum
standards that risk managers must meet. The challenge to successfully implement this approach on a global basis cannot be overstated.
GARP’s FRM Committee meets regularly via e-mail, through conference calls, and in person to identify and discuss financial risk management
trends and theories. Its objective is to ensure that what is tested each year
in the FRM Exam is timely, comprehensive, and relevant. The results of
these discussions are memorialized in the FRM Study Guide. The Study
Guide, which is revised annually, clearly delineates in a topical outline the
base level of knowledge that a financial risk manager should possess in order to provide competent financial risk management advice to a firm’s senior management and directors.
FRM Committee members represent some of the industry’s most
knowledgeable financial risk professionals. The following individuals were
the Committee members responsible for developing the 2005 FRM Study
Guide:
T
Dr. René Stulz (Chairman)
Richard Apostolik
Juan Carlos Garcia Cespedes
Dr. Marcelo Cruz
Dr. James Gutman
Kai Leifert
Steve Lerit, CFA
x
Ohio State University
Global Association of Risk Professionals
Banco Bilbao Vizcaya Argentaria
Risk Maths, Inc.
Goldman Sachs International
Credit Suisse Asset Management
New York Life Investment Management
xi
Acknowledgments
Michelle McCarthy
Dr. Susan Mangiero
Michael B. Miller
Peter Nerby
Dr. Victor Ng
Dr. Elliot Noma
Gadi Pickholz
Robert Scanlon
Omer Tareen
Alan Weindorf
Washington Mutual Bank
BVA, LLC
Fortress Investment Group
Moody’s Investors Service
Goldman Sachs & Co.
Asset Alliance Corporation
Ben Gurion University of the Negev
Standard Chartered Bank
Microsoft Corporation
Starbucks Coffee Company
This chapter with
has been
reproducedfrom
with permission
from Value
at Risk,
2 Ed. byJorion.
Philippe©
Jorion,
by McGraw-Hill
, New
Reproduced
permission
Value at Risk,
2nd ed.,
by Philippe
2001published
The McGraw-Hill
Companies,
York
2001
(©
McGraw-Hill,
all
rights
reserved).
Inc.
9706.Ch.05 7/19/00 3:34 PM Page 107
nd
CHAPTER
5
Computing Value at Risk
The Daily Earnings at Risk (DEaR) estimate for our combined trading
activities averaged approximately $15 million.
J.P. Morgan 1994 Annual Report
P
erhaps the greatest advantage of value at risk (VAR) is that it summarizes in a single, easy to understand number the downside risk of an
institution due to financial market variables. No doubt this explains why
VAR is fast becoming an essential tool for conveying trading risks to senior management, directors, and shareholders. J.P. Morgan, for example,
was one of the first users of VAR. It revealed in its 1994 Annual Report
that its trading VAR was an average of $15 million at the 95 percent level
over 1 day. Shareholders can then assess whether they are comfortable
with this level of risk. Before such figures were released, shareholders
had only a vague idea of the extent of trading activities assumed by the
bank.
This chapter turns to a formal definition of value at risk (VAR). VAR
assumes that the portfolio is “frozen” over the horizon or, more generally,
that the risk profile of the institution remains constant. In addition, VAR
assumes that the current portfolio will be marked-to-market on the target
horizon. Section 5.1 shows how to derive VAR figures from probability
distributions. This can be done in two ways, either from considering the
actual empirical distribution or by approximating the distribution by a
parametric approximation, such as the normal distribution, in which case
VAR is derived from the standard deviation.
Section 5.2 then discusses the choice of the quantitative factors, the
confidence level and the horizon. Criteria for this choice should be guided
by the use of the VAR number. If VAR is simply a benchmark for risk,
107
This chapter with
has been
reproducedfrom
with permission
from Value
at Risk,
2 Ed. byJorion.
Philippe©
Jorion,
by McGraw-Hill
, New
Reproduced
permission
Value at Risk,
2nd ed.,
by Philippe
2001published
The McGraw-Hill
Companies,
York
2001
(©
McGraw-Hill,
all
rights
reserved).
Inc.
9706.Ch.05 7/19/00 3:34 PM Page 108
nd
PART 2 Building Blocks
108
the choice is totally arbitrary. In contrast, if VAR is used to set equity capital, the choice is quite delicate. Criteria for parameter selection are also
explained in the context of the Basel Accord rules.
The next section turns to an important and often ignored issue, which
is the precision of the reported VAR number. Due to normal sampling
variation, there is some inherent imprecision in VAR numbers. Thus, observing changes in VAR numbers for different estimation windows is perfectly normal. Section 5.3 provides a framework for analyzing normal
sampling variation in VAR and discusses methods to improve the accuracy of VAR figures. Finally, Section 5.4 provides some concluding
thoughts.
5.1 COMPUTING VAR
With all the requisite tools in place, we can now formally define the value
at risk (VAR) of a portfolio. VAR summarizes the expected maximum loss
(or worst loss) over a target horizon within a given confidence interval.
Initially, we take the quantitative factors, the horizon and confidence level,
as given.
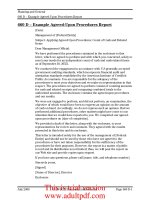
5.1.1 Steps in Constructing VAR
Assume, for instance, that we need to measure the VAR of a $100 million equity portfolio over 10 days at the 99 percent confidence level. The
following steps are required to compute VAR:
■
■
■
■
■
Mark-to-market of the current portfolio (e.g., $100 million).
Measure the variability of the risk factors(s) (e.g., 15 percent
per annum).
Set the time horizon, or the holding period (e.g., adjust to 10
business days).
Set the confidence level (e.g., 99 percent, which yields a 2.33
factor assuming a normal distribution).
Report the worst loss by processing all the preceding information (e.g., a $7 million VAR).
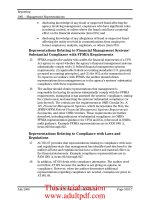
These steps are illustrated in Figure 5–1. The precise detail of the computation is described next.
This chapter with
has been
reproducedfrom
with permission
from Value
at Risk,
2 Ed. byJorion.
Philippe©
Jorion,
by McGraw-Hill
, New
Reproduced
permission
Value at Risk,
2nd ed.,
by Philippe
2001published
The McGraw-Hill
Companies,
York
2001
(©
McGraw-Hill,
all
rights
reserved).
Inc.
9706.Ch.05 7/19/00 3:34 PM Page 109
nd
CHAPTER 5 Computing Value at Risk
FIGURE
109
5–1
Steps in constructing VAR.
Mark
position
to market
Set
Measure
variability of time
risk factors horizon
Set
confidence
level
Report
potential
loss
Value
Value
Frequency
Value
VAR
σ
10 days
Time
−α
Horizon
Horizon
Sample computation:
$100M
x
15%
x
͙(10/252)
x
2.33
=
$7M
5.1.2 VAR for General Distributions
To compute the VAR of a portfolio, define W0 as the initial investment
and R as its rate of return. The portfolio value at the end of the target
horizon is W ϭ W0 (1 ϩ R). As before, the expected return and volatility of R are and . Define now the lowest portfolio value at the given
confidence level c as W* ϭ W0 (1 ϩ R*). The relative VAR is defined as
the dollar loss relative to the mean:
VAR(mean) ϭ E(W) Ϫ W* ϭ ϪW0 (R* Ϫ )
(5.1)
Sometimes VAR is defined as the absolute VAR, that is, the dollar loss
relative to zero or without reference to the expected value:
VAR(zero) ϭ W0 Ϫ W* ϭ ϪW0R*
(5.2)
In both cases, finding VAR is equivalent to identifying the minimum value
W* or the cutoff return R*.
If the horizon is short, the mean return could be small, in which case
both methods will give similar results. Otherwise, relative VAR is conceptually more appropriate because it views risk in terms of a deviation
This chapter with
has been
reproducedfrom
with permission
from Value
at Risk,
2 Ed. byJorion.
Philippe©
Jorion,
by McGraw-Hill
, New
Reproduced
permission
Value at Risk,
2nd ed.,
by Philippe
2001published
The McGraw-Hill
Companies,
York
2001
(©
McGraw-Hill,
all
rights
reserved).
Inc.
9706.Ch.05 7/19/00 3:34 PM Page 110
nd
PART 2 Building Blocks
110
from the mean, or “budget,” on the target date, appropriately accounting
for the time value of money. This approach is also more conservative if
the mean value is positive. Its only drawback is that the mean return is
sometimes difficult to estimate.
In its most general form, VAR can be derived from the probability
distribution of the future portfolio value f(w). At a given confidence level
c, we wish to find the worst possible realization W* such that the probability of exceeding this value is c:
͵
∞
cϭ
f(w) dw
(5.3)
W*
or such that the probability of a value lower than W*, p ϭ P(w Յ W*),
is 1 Ϫ c:
͵
W*
1Ϫcϭ
f(w) dw ϭ P(w Յ W*) ϭ p
(5.4)
Ϫ∞
In other words, the area from Ϫ∞ to W* must sum to p ϭ 1 Ϫ c, for instance, 5 percent. The number W* is called the quantile of the distribution, which is the cutoff value with a fixed probability of being exceeded.
Note that we did not use the standard deviation to find the VAR.
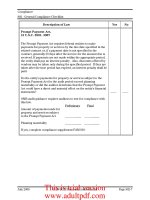
This specification is valid for any distribution, discrete or continuous, fat- or thin-tailed. Figure 5–2, for instance, reports J.P. Morgan’s distribution of daily revenues in 1994.
To compute VAR, assume that daily revenues are identically and independently distributed. We can then derive the VAR at the 95 percent confidence level from the 5 percent left-side “losing tail” from the histogram.
From this graph, the average revenue is about $5.1 million. There is
a total of 254 observations; therefore, we would like to find W* such that
the number of observations to its left is 254 ϫ 5 percent ϭ 12.7. We
have 11 observations to the left of Ϫ$10 million and 15 to the left of Ϫ$9
million. Interpolating, we find W* ϭ Ϫ$9.6 million. The VAR of daily
revenues, measured relative to the mean, is VAR ϭ E(W) Ϫ W* ϭ $5.1
million Ϫ (Ϫ$9.6 million) ϭ $14.7 million. If one wishes to measure
VAR in terms of absolute dollar loss, VAR is then $9.6 million.
5.1.3 VAR for Parametric Distributions
The VAR computation can be simplified considerably if the distribution
can be assumed to belong to a parametric family, such as the normal dis-
This chapter with
has been
reproducedfrom
with permission
from Value
at Risk,
2 Ed. byJorion.
Philippe©
Jorion,
by McGraw-Hill
, New
Reproduced
permission
Value at Risk,
2nd ed.,
by Philippe
2001published
The McGraw-Hill
Companies,
York
2001
(©
McGraw-Hill,
all
rights
reserved).
Inc.
9706.Ch.05 7/19/00 3:34 PM Page 111
nd
CHAPTER 5 Computing Value at Risk
FIGURE
111
5–2
Distribution of daily revenues.
20
Number of days
VAR=$15 million
Average=$5 million
5% of Occurrences
15
10
5
0
<-25
-20
-15
-10
-5
0
5
10
15
Daily revenue ($ million)
20
tribution. When this is the case, the VAR figure can be derived directly
from the portfolio standard deviation using a multiplicative factor that depends on the confidence level. This approach is sometimes called parametric because it involves estimation of parameters, such as the standard
deviation, instead of just reading the quantile off the empirical distribution.
This method is simple and convenient and, as we shall see later,
produces more accurate measures of VAR. The issue is whether the normal approximation is realistic. If not, another distribution may fit the data
better.
First, we need to translate the general distribution f(w) into a standard normal distribution ⌽(⑀), where ⑀ has mean zero and standard deviation of unity. We associate W* with the cutoff return R* such that W* ϭ
W0(1 ϩ R*). Generally, R* is negative and also can be written as Ϫ|R*|.
This chapter with
has been
reproducedfrom
with permission
from Value
at Risk,
2 Ed. byJorion.
Philippe©
Jorion,
by McGraw-Hill
, New
Reproduced
permission
Value at Risk,
2nd ed.,
by Philippe
2001published
The McGraw-Hill
Companies,
York
2001
(©
McGraw-Hill,
all
rights
reserved).
Inc.
9706.Ch.05 7/19/00 3:34 PM Page 112
nd
PART 2 Building Blocks
112
Further, we can associate R* with a standard normal deviate ␣ Ͼ 0 by
setting
Ϫ|R*| Ϫ
Ϫ␣ ϭ ᎏᎏ
(5.5)
It is equivalent to set
͵
͵
Ϫ|R*|
W*
1Ϫcϭ
f(w) dw ϭ
Ϫ∞
͵
Ϫ␣
f(r) dr ϭ
Ϫ∞
⌽(⑀) d⑀
(5.6)
Ϫ∞
Thus the problem of finding a VAR is equivalent to finding the deviate ␣
such that the area to the left of it is equal to 1 Ϫ c. This is made possible by turning to tables of the cumulative standard normal distribution
function, which is the area to the left of a standard normal variable with
value equal to d:
͵
d
N(d) ϭ
⌽(⑀) d⑀
(5.7)
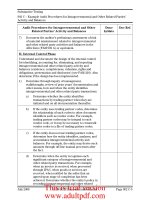
Ϫ∞
This function also plays a key role in the Black-Scholes option pricing
model. Figure 5–3 graphs the cumulative density function N(d), which
increases monotonically from 0 (for d ϭ Ϫ∞) to 1 (for d ϭ ϩ∞), going
through 0.5 as d passes through 0.
To find the VAR of a standard normal variable, select the desired
left-tail confidence level on the vertical axis, say, 5 percent. This corresponds to a value of ␣ ϭ 1.65 below 0. We then retrace our steps, back
from the ␣ we just found to the cutoff return R* and VAR. From Equation
(5.5), the cutoff return is
R* ϭ Ϫ␣ ϩ
(5.8)
For more generality, assume now that the parameters and are expressed on an annual basis. The time interval considered is ⌬t, in years.
We can use the time aggregation results developed in the preceding chapter, which assume uncorrelated returns.
Using Equation (5.1), we find the VAR below the mean as
ෆ
VAR(mean) ϭ ϪW0(R* Ϫ ) ϭ W0␣͙⌬t
(5.9)
In other words, the VAR figure is simply a multiple of the standard deviation of the distribution times an adjustment factor that is directly related
to the confidence level and horizon.
This chapter with
has been
reproducedfrom
with permission
from Value
at Risk,
2 Ed. byJorion.
Philippe©
Jorion,
by McGraw-Hill
, New
Reproduced
permission
Value at Risk,
2nd ed.,
by Philippe
2001published
The McGraw-Hill
Companies,
York
2001
(©
McGraw-Hill,
all
rights
reserved).
Inc.
9706.Ch.05 7/19/00 3:34 PM Page 113
nd
CHAPTER 5 Computing Value at Risk
FIGURE
113
5–3
Cumulative normal probability distribution.
1
N(d)
1.65σ
0.5
c = 5%
confidence
level
0.05
0
-3
-2
-1
0
1
d=Standard normal variable
2
3
When VAR is defined as an absolute dollar loss, we have
ෆ Ϫ ⌬t)
VAR(zero) ϭ ϪW0R* ϭ W0(␣͙⌬t
(5.10)
This method generalizes to other cumulative probability functions
(cdf) as well as the normal, as long as all the uncertainty is contained in
. Other distributions will entail different values of ␣. The normal distribution is just particularly easy to deal with because it adequately represents many empirical distributions. This is especially true for large, welldiversified portfolios but certainly not for portfolios with heavy option
components and exposures to a small number of financial risks.
5.1.4 Comparison of Approaches
How well does this approximation work? For some distributions, the fit
can be quite good. Consider, for instance, the daily revenues in Figure
5–2. The standard deviation of the distribution is $9.2 million. According
This chapter with
has been
reproducedfrom
with permission
from Value
at Risk,
2 Ed. byJorion.
Philippe©
Jorion,
by McGraw-Hill
, New
Reproduced
permission
Value at Risk,
2nd ed.,
by Philippe
2001published
The McGraw-Hill
Companies,
York
2001
(©
McGraw-Hill,
all
rights
reserved).
Inc.
9706.Ch.05 7/19/00 3:34 PM Page 114
nd
PART 2 Building Blocks
114
FIGURE
5–4
Comparison of cumulative distributions.
1
Cumulative probability
0.5
Normal distribution
Actual distribution
5%
0
<-25
-20
-15
-10
-5
0
5
10
15
Daily revenue ($ million)
20
to Equation (5.9), the normal-distribution VAR is ␣ ϫ (W0) ϭ 1.65 ϫ
$9.2 million ϭ $15.2 million. Note that this number is very close to the
VAR obtained from the general distribution, which was $14.7 million.
Indeed, Figure 5–4 presents the cumulative distribution functions
(cdf) obtained from the histogram in Figure 5–2 and from its normal approximation. The actual cdf is obtained from summing, starting from the
left, all numbers of occurrences in Figure 5–2 and then scaling by the total number of observations. The normal cdf is the same as that in Figure
5–3, with the horizontal axis scaled back into dollar revenues using
Equation (5.8). The two lines are generally very close, suggesting that the
normal approximation provides a good fit to the actual data.
5.1.5 VAR as a Risk Measure
VAR’s heritage can be traced to Markowitz’s (1952) seminal work on portfolio choice. He noted that “you should be interested in risk as well as
This chapter with
has been
reproducedfrom
with permission
from Value
at Risk,
2 Ed. byJorion.
Philippe©
Jorion,
by McGraw-Hill
, New
Reproduced
permission
Value at Risk,
2nd ed.,
by Philippe
2001published
The McGraw-Hill
Companies,
York
2001
(©
McGraw-Hill,
all
rights
reserved).
Inc.
9706.Ch.05 7/19/00 3:34 PM Page 115
nd
CHAPTER 5 Computing Value at Risk
115
return” and advocated the use of the standard deviation as an intuitive
measure of dispersion.
Much of Markowitz’s work was devoted to studying the tradeoff between expected return and risk in the mean-variance framework, which is
appropriate when either returns are normally distributed or investors have
quadratic utility functions.
Perhaps the first mention of confidence-based risk measures can be
traced to Roy (1952), who presented a “safety first” criterion for portfolio selection. He advocated choosing portfolios that minimize the probability of a loss greater than a disaster level. Baumol (1963) also proposed
a risk measurement criterion based on a lower confidence limit at some
probability level:
L ϭ ␣ Ϫ
(5.11)
which is an early description of Equation (5.10).
Other measures of risk have also been proposed, including semideviation, which counts only deviations below a target value, and lower partial moments, which apply to a wider range of utility functions.
More recently, Artzner et al. (1999) list four desirable properties for
risk measures for capital adequacy purposes. A risk measure can be viewed
as a function of the distribution of portfolio value W, which is summarized into a single number (W):
■
■
■
■
Monotonicity: If W1 Յ W2, (W1) Ն (W2), or if a portfolio
has systematically lower returns than another for all states of
the world, its risk must be greater.
Translation invariance. (W ϩ k) ϭ (W) Ϫ k, or adding cash
k to a portfolio should reduce its risk by k.
Homogeneity. (bW) ϭ b(W), or increasing the size of a portfolio by b should simply scale its risk by the same factor (this
rules out liquidity effects for large portfolios, however).
Subadditivity. (W1 ϩ W2) Յ (W1) ϩ (W2), or merging portfolios cannot increase risk.
Artzner et al. (1999) show that the quantile-based VAR measure fails
to satisfy the last property. Indeed, one can come up with pathologic examples of short option positions that can create large losses with a low probability and hence have low VAR yet combine to create portfolios with larger
VAR. One can also show that the shortfall measure E(ϪX|X Յ ϪVAR),
This chapter with
has been
reproducedfrom
with permission
from Value
at Risk,
2 Ed. byJorion.
Philippe©
Jorion,
by McGraw-Hill
, New
Reproduced
permission
Value at Risk,
2nd ed.,
by Philippe
2001published
The McGraw-Hill
Companies,
York
2001
(©
McGraw-Hill,
all
rights
reserved).
Inc.
9706.Ch.05 7/19/00 3:34 PM Page 116
nd
116
PART 2 Building Blocks
which is the expected loss conditional on exceeding VAR, satisfies these
desirable “coherence” properties.
When returns are normally distributed, however, the standard deviation–based VAR satisfies the last property, (W1 ϩ W2) Յ (W1) ϩ
(W2). Indeed, as Markowitz had shown, the volatility of a portfolio is
less than the sum of volatilities.
Of course, the preceding discussion does not consider another essential component for portfolio comparisons: expected returns. In practice, one obviously would want to balance increasing risk against increasing expected returns. The great benefit of VAR, however, is that it
brings attention and transparency to the measure of risk, a component of
the decision process that is not intuitive and as a result too often ignored.
5.2 CHOICE OF QUANTITATIVE FACTORS
We now turn to the choice of two quantitative factors: the length of the
holding horizon and the confidence level. In general, VAR will increase
with either a longer horizon or a greater confidence level. Under certain
conditions, increasing one or the other factor produces equivalent VAR
numbers. This section provides guidance on the choice of c and ⌬t, which
should depend on the use of the VAR number.
5.2.1 VAR as a Benchmark Measure
The first, most general use of VAR is simply to provide a companywide
yardstick to compare risks across different markets. In this situation, the
choice of the factors is arbitrary. Bankers Trust, for instance, has long
used a 99 percent VAR over an annual horizon to compare the risks of
various units. Assuming a normal distribution, we show later that it is easy
to convert disparate bank measures into a common number.
The focus here is on cross-sectional or time differences in VAR. For
instance, the institution wants to know if a trading unit has greater risk
than another. Or whether today’s VAR is in line with yesterday’s. If not,
the institution should “drill down” into its risk reports and find whether
today’s higher VAR is due to increased volatility or larger bets. For this
purpose, the choice of the confidence level and horizon does not matter
much as long as consistency is maintained.
This chapter with
has been
reproducedfrom
with permission
from Value
at Risk,
2 Ed. byJorion.
Philippe©
Jorion,
by McGraw-Hill
, New
Reproduced
permission
Value at Risk,
2nd ed.,
by Philippe
2001published
The McGraw-Hill
Companies,
York
2001
(©
McGraw-Hill,
all
rights
reserved).
Inc.
9706.Ch.05 7/19/00 3:34 PM Page 117
nd
CHAPTER 5 Computing Value at Risk
117
5.2.2 VAR as a Potential Loss Measure
Another application of VAR is to give a broad idea of the worst loss an
institution can incur. If so, the horizon should be determined by the nature of the portfolio.
A first interpretation is that the horizon is defined by the liquidation
period. Commercial banks currently report their trading VAR over a daily
horizon because of the liquidity and rapid turnover in their portfolios. In
contrast, investment portfolios such as pension funds generally invest in
less liquid assets and adjust their risk exposures only slowly, which is why
a 1-month horizon is generally chosen for investment purposes. Since the
holding period should correspond to the longest period needed for an orderly portfolio liquidation, the horizon should be related to the liquidity
of the securities, defined in terms of the length of time ����������������������������������������������������������������������������������������������������������������������������������������������������������������������������������������������������������������������������������������������������������������������������������������������������������������������������������������������������������������������������������������������������������������������������������������������������������������������������������������������������������������������������������������������������������������������������������������������������������������������������������������������������������������������������������������������������������������������������������������������������������������������������������������������������������������������������������������������������������������������������������������������������������������������������������������������������������������������������������������������������������������������������������������������������������������������������������������������������������������������������������������������������������������������������������������������������������������������������������������������������������������������������������������������������������������������������������������������������������������������������������������������������������������������������������������������������������������������������������������������������������������������������������������������������������������������������������������������������������������������������������������������������������������������������������������������������������������������������������������������������������������������������������������������������������������������������������������������������������������������������������������������������������������������������������������������������������������������������������������������������������������������������������������������������������������������������������������������������������������������������������������������������������������������������������������������������������������������������������������������������������������������������������������������������������������������������������������������������������������������������������������������������������������������������������������������������������������������������������������������������������������������������������������������������������������������������������������������������������������������������������������������������������������������������������������������������������������������������������������������������������������������������������������������������������������������������������������������������������������������������������������������������������������������������������������������������������������������������������������������������������������������������������������������������������������������������������������������������������������������������������������������������������������������������������������������������������������������������������������������������������������������������������������������������������������������������������������������������������������������������������������������������������������������������������������������������������������������������������������������������������������������������������������������������������������������������������������������������������������������������������������������������������������������������������������������������������������������������������������������������������������������������������������������������������������������������������������������������������������������������������������������������������������������������������������������������������������������������������������������������������������������������������������������������������������������������������������������������������������������������������������������������������������������������������������������������������������������������������������������������������������������������������������������������������������������������������������������������������������������������������������������������������������������������������������������������������������������������������������������������������������������������������������������������������������������������������������������������������������������������������������������������������������������������������������������������������������������������������������������������������������������������������������������������������������������������������������������������������������������������������������������������������������������������������������������������������������������������������������������������������������������������������������������������������������������������������������������������������������������������������������������������������������������������������������������������������������������������������������������������������������������������������������������������������������������������������������������������������������������������������������������������������������������������������������������������������������������������������������������������������������������������������������������������������������������������������������������������������������������������������������������������������������������������������������������������������������������������������������������������������������������������������������������������������������������������������������������������������������������������������������������������������������������������������������������������������������������������������������������������������������������������������������������������������������������������������������������������������������������������������������������������������������������������������������������������������������������������������������������������������������������������������������������������������������������������������������������������������������������������������������������������������������������������������������������������������������������������������������������������������������������������������������������������������������������������������������������������������������������������������������������������������������������������������������������������������������������������������������������������������������������������������������������������������������������������������������������������������������������������������������������������������������������������������������������������������������������������������������������������������������������������������������������������������������������������������������������������������������������������������������������������������������������������������������������������������������������������������������������������������������������������������������������������������������������������������������������������������������������������������������������������������������������������������������������������������������������������������������������������������������������������������������������������������������������������������������������������������������������������������������������������������������������������������������������������������������������������������������������������������������������������������������������������������������������������������������������������������������������������������������������������������������������������������������������������������������������������������������������������������������������������������������������������������������������������������������������������������������������������������������������������������������������������������������������������������������������������������������������������������������������������������������������������������������������������������������������������������������������������������������������������������������������������������������������������������������������������������������������������������������������������������������������������������������������������������������������������������������������������������������������������������������������������������������������������������������������������������������������������������������������������������������������������������������������������������������������������������������������������������������������������������������������������������������������������������������������������������������������������������������������������������������������������������������������������������������������������������������������������������������������������������������������������������������������������������������������������������������������������������������������������������������������������������������������������������������������������������������������������������������������������������������������������������������������������������������������������������������������������������������������������������������������������������������������������������������������������������������������������������������������������������������������������������������������������������������������������������������������������������������������������������������������������������������������������������������������������������������������������������������������������������������������������������������������������������������������������������������������������������������������������������������������������������������������������������������������������������������������������������������������������������������������������������������������������������������������������������������������������������������������������������������������������������������������������������������������������������������������������������������������������������������������������������������������������������������������������������������������������������������������������������������������������������������������������������������������������������������������������������������������������������������������������������������������������������������������������������������������������������������������������������������������������������������������������������������������������������������������������������������������������������������������������������������������������������������������������������������������������������������������������������������������������������������������������������������������������������������������������������������������������������������������������������������������������������������������������������������������������������������������������������������������������������������������������������������������������������������������������������������������������������������������������������������������������������������������������������������������������������������������������������������������������������������������������������������������������������������������������������������������������������������������������������������������������������������������������������������������������������������������������������������������������������������������������������������������������������������������������������������������������������������������������������������������������������������������������������������������������������������������������������������������������������������������������������������������������������������������������������������������������������������������������������������������������������������������������������������������������������������������������������������������������������������������������������������������������������������������������������������������������������������������������������������������������������������������������������������������������������������������������������������������������������������������������������������������������������������������������������������������������������������������������������������������������������������������������������������������������������������������������������������������������������������������������������������������������������������������������������������������������������������������������������������������������������������������������������������������������������������������������������������������������������������������������������������������������������������������������������������������������������������������������������������������������������������������������������������������������������������������������������������������������������������������������������������������������������������������������������������������������������������������������������������������������������������������������������������������������������������������������������������������������������������������������������������������������������������������������������������������������������������������������������������������������������������������������������������������������������������������������������������������������������������������������������������������������������������������������������������������������������������������������������������������������������������������������������������������������������������������������������������������������������������������������������������������������������������������������������������������������������������������������������������������������������������������������������������������������������������������������������������������������������������������������������������������������������������������������������������������������������������������������������������������������������������������������������������������������������������������������������������������������������������������������������������������������������������������������������������������������������������������������������������������������������������������������������������������������������������������������������������������������������������������������������������������������������������������������������������������������������������������������������������������������������������������������������������������������������������������������������������������������������������������������������������������������������������������������������������������������������������������������������������������������������������������������������������������������������������������������������������������������������������������������������������������������������������������������������������������������������������������������������������������������������������������������������������������������������������������������������������������������������������������������������������������������������������������������������������������������������������������������������������������������������������������������������������������������������������������������������������������������������������������������������������������������������������������������������������������������������������������������������������������������������������������������������������������������������������������������������������������������������������������������������������������������������������������������������������������������������������������������������������������������������������������������������������������������������������������������������������������������������������������������������������������������������������������������������������������������������������������������������������������������������������������������������������������������������������������������������������������������������������������������������������������������������������������������������������������������������������������������������������������������������������������������������������������������������������������������������������������������������������������������������������������������������������������������������������������������������������������������������������������������������������������������������������������������������������������������������������������������������������������������������������������������������������������������������������������������������������������������������������������������������������������������������������������������������������������������������������������������������������������������������������������������������������������������������������������������������������������������������������������������������������������������������������������������������������������������������������������������������������������������������������������������������������������������������������������������������������������������������������������������������������������������������������������������������������������������������������������������������������������������������������������������������������������������������������������������������������������������������������������������������������������������������������������������������������������������������������������������������������������������������������������������������������������������������������������������������������������������������������������������������������������������������������������������������������������������������������������������������������������������������������������������������������������������������������������������������������������������������������������������������������������������������������������������������������������������������������������������������������������������������������������������������������������������������������������������������������������������������������������������������������������������������������������������������������������������������������������������������������������������������������������������������������������������������������������������������������������������������������������������������������������������������������������������������������������������������������������������������������������������������������������������������������������������������������������������������������������������������������������������������������������������������������������������������������������������������������������������������������������������������������������������������������������������������������������������������������������������������������������������������������������������������������������������������������������������������������������������������������������������������������������������������������������������������������������������������������������������������������������������������������������������������������������������������������������������������������������������������������������������������������������������������������������������������������������������������������������������������������������������������������������������������������������������������������������������������������������������������������������������������������������������������������������������������������������������������������������������������������������������������������������������������������������������������������������������������������������������������������������������������������������������������������������������������������������������������������������������������������������������������������������������������������������������������������������������������������������������������������������������������������������������������������������������������������������������������������������������������������������������������������������������������������������������������������������������������������������������������������������������������������������������������������������������������������������������������������������������������������������������������������������������������������������������������������������������������������������������������������������������������������������������������������������������������������������������������������������������������������������������������������������������������������������������������������������������������������������������������������������������������������������������������������������������������������������������������������������������������������������������������������������������������������������������������������������������������������������������������������������������������������������������������������������������������������������������������������������������������������������������������������������������������������������������������������������������������������������������������������������������������������������������������������������������������������������������������������������������������������������������������������������������������������������������������������������������������������������������������������������������������������������������������������������������������������������������������������������������������������������������������������������������������������������������������������������������������������������������������������������������������������������������������������������������������������������������������������������������������������������������������������������������������������������������������������������������������������������������������������������������������������������������������������������������������������������������������������������������������������������������������������������������������������������������������������������������������������������������������������������������������������������������������������������������������������������������������������������������������������������������������������������������������������������������������������������������������������������������������������������������������������������������������������������������������������������������������������������������������������������������������������������������������������������������������������������������������������������������������������������������������������������������������������������������������������������������������������������������������������������������������������������������������������������������������������������������������������������������������������������������������������������������������������������������������������������������������������������������������������������������������������������������������������������������������������������������������������������������������������������������������������������������������������������������������������������������������������������������������������������������������������������������������������������������������������������������������������������������������������������������������������������������������������������������������������������������������������������������������������������������������������������������������������������������������������������������������������������������������������������������������������������������������������������������������������������������������������������������������������������������������������������������������������������������������������������������������������������������������������������������������������������������������������������������������������������������������������������������������������������������������������������������������������������������������������������������������������������������������������������������������������������������������������������������������������������������������������������������������������������������������������������������������������������������������������������������������������������������������������������������������������������������������������������������������������������������������������������������������������������������������������������������������������������������������������������������������������������������������������������������������������������������������������������������������������������������������������������������������������������������������������������������������������������������������������������������������������������������������������������������������������������������������������������������������������������������������������������������������������������������������������������������������������������������������������������������������������������������������������������������������������������������������������������������������������������������������������������������������������������������������������������������������������������������������������������������������������������������������������������������������������������������������������������������������������������������������������������������������������������������������������������������������������������������������������������������������������������������������������������������������������������������������������������������������������������������������������������������������������������������������������������������������������������������������������������������������������������������������������������������������������������������������������������������������������������������������������������������������������������������������������������������������������������������������������������������������������������������������������������������������������������������������������������������������������������������������������������������������������������������������������������������������������������������������������������������������������������������������������������������������������������������������������������������������������������������������������������������������������������������������������������������������������������������������������������������������������������������������������������������������������������������������������������������������������������������������������������������������������������������������������������������������������������������������������������������������������������������������������������������������������������������������������������������������������������������������������������������������������������������������������������������������������������������������������������������������������������������������������������������������������������������������������������������������������������������������������������������������������������������������������������������������������������������������������������������������������������������������������������������������������������������������������������������������������������������������������������������������������������������������������������������������������������������������������������������������������������������������������������������������������������������������������������������������������������������������������������������������������������������������������������������������������������������������������������������������������������������������������������������������������������������������������������������������������������������������������������������������������������������������������������������������������������������������������������������������������������������������������������������������������������������������������������������������������������������������������������������������������������������������������������������������������������������������������������������������������������������������������������������������������������������������������������������������������������������������������������������������������������������������������������������������������������������������������������������������������������������������������������������������������������������������������������������������������������������������������������������������������������������������������������������������������������������������������������������������������������������������������������������������������������������������������������������������������������������������������������������������������������������������������������������������������������������������������������������������������������������������������������������������������������������������������������������������������������������������������������������������������������������������������������������������������������������������������������������������������������������������������������������������������������������������������������������������������������������������������������������������������������������������������������������������������������������������������������������������������������������������������������������������������������������������������������������������������������������������������������������������������������������������������������������������������������������������������������������������������������������������������������������������������������������������������������������������������������������������������������������������������������������������������������������������������������������������������������������������������������������������������������������������������������������������������������������������������������������������������������������������������������������������������������������������������������������������������������������������������������������������������������������������������������������������������������������������������������������������������������������������������������������������������������������������������������������������������������������������������������������������������������������������������������������������������������������������������������������������������������������������������������������������������������������������������������������������������������������������������������������������������������������������������������������������������������������������������������������������������������������������������������������������������������������������������������������������������������������������������������������������������������������������������������������������������������������������������������������������������������������������������������������������������������������������������������������������������������������������������������������������������������������������������������������������������������������������������������������������������������������������������������������������������������������������������������������������������������������������������������������������������������������������������������������������������������������������������������������������������������������������������������������������������������������������������������������������������������������������������������������������������������������������������������������������������������������������������������������������������������������������������������������������������������������������������������������������������������������������������������������������������������������������������������������������������������������������������������������������������������������������������������������������������������������������������������������������������������������������������������������������������������������������������������������������������������������������������������������������������������������������������������������������������������������������������������������������������������������������������������������������������������������������������������������������������������������������������������������������������������������������������������������������������������������������������������������������������������������������������������������������������������������������������������������������������������������������������������������������������������������������������������������������������������������������������������������������������������������������������������������������������������������������������������������������������������������������������������������������������������������������������������������������������������������������������������������������������������������������������������������������������������������������������������������������������������������������������������������������������������������������������������������������������������������������������������������������������������������������������������������������������������������������������������������������������������������������������������������������������������������������������������������������������������������������������������������������������������������������������������������������������������������������������������������������������������������������������������������������������������������������������������������������������������������������������������������������������������������������������������������������������������������������������������������������������������������������������������������������������������������������������������������������������������������������������������������������������������������������������������������������������������������������������������������������������������������������������������������������������������������������������������������������������������������������������������������������������������������������������������������������������������������������������������������������������������������������������������������������������������������������������������������������������������������������������������������������������������������������������������������������������������������������������������������������������������������������������������������������������������������������������������������������������������������������������������������������������������������������������������������������������������������������������������������������������������������������������������������������������������������������������������������������������������������������������������������������������������������������������������������������������������������������������������������������������������������������������������������������������������������������������������������������������������������������������������������������������������������������������������������������������������������������������������������������������������������������������������������������������������������������������������������������������������������������������������������������������������������������������������������������������������������������������������������������������������������������������������������������������������������������������������������������������������������������������������������������������������������������������������������������������������������������������������������������������������������������������������������������������������������������������������������������������������������������������������������������������������������������������������������������������������������������������������������������������������������������������������������������������������������������������������������������������������������������������������������������������������������������������������������������������������������������������������������������������������������������������������������������������������������������������������������������������������������������������������������������������������������������������������������������������������������������������������������������������������������������������������������������������������������������������������������������������������������������������������������������������������������������������������������������������������������������������������������������������������������������������������������������������������������������������������������������������������������������������������������������������������������������������������������������������������������������������������������������������������������������������������������������������������������������������������������������������������������������������������������������������������������������������������������������������������������������������������������������������������������������������������������������������������������������������������������������������������������������������������������������������������������������������������������������������������������������������������������������������������������������������������������������������������������������������������������������������������������������������������������������������������������������������������������������������������������������������������������������������������������������������������������������������������������������������������������������������������������������������������������������������������������������������������������������������������������������������������������������������������������������������������������������������������������������������������������������������������������������������������������������������������������������������������������������������������������������������������������������������������������������������������������������������������������������������������������������������������������������������������������������������������������������������������������������������������������������������������������������������������������������������������������������������������������������������������������������������������������������������������������������������������������������������������������������������������������������������������������������������������������������������������������������������������������������������������������������������������������������������������������������������������������������������������������������������������������������������������������������������������������������������������������������������������������������������������������������������������������������������������������������������������������������������������������������������������������������������������������������������������������������������������������������������������������������������������������������������������������������������������������������������������������������������������������������������������������������������������������������������������������������������������������������������������������������������������������������������������������������������������������������������������������������������������������������������������������������������������������������������������������������������������������������������������������������������������������������������������������������������������������������������������������������������������������������������������������������������������������������������������������������������������������������������������������������������������������������������������������������������������������������������������������������������������������������������������������������������������������������������������������������������������������������������������������������������������������������������������������������������������������������������������������������������������������������������������������������������������������������������������������������������������������������������������������������������������������������������������������������������������������������������������������������������������������������������������������������������������������������������������������������������������������������������������������������������������������������������������������������������������������������������������������������������������������������������������������������������������������������������������������������������������������������������������������������������������������������������������������������������������������������������������������������������������������������������������������������������������������������������������������������������������������������������������������������������������������������������������������������������������������������������������������������������������������������������������������������������������������������������������������������������������������������������������������������������������������������������������������������������������������������������������������������������������������������������������������������������������������������������������������������������������������������������������������������������������������������������������������������������������������������������������������������������������������������������������������������������������������������������������������������������������������������������������������������������������������������������������������������������������������������������������������������������������������������������������������������������������������������������������������������������������������������������������������������������������������������������������������������������������������������������������������������������������������������������������������������������������������������������������������������������������������������������������������������������������������������������������������������������������������������������������������������������������������������������������������������������������������������������������������������������������������������������������������������������������������������������������������������������������������������������������������������������������������������������������������������������������������������������������������������������������������������������������������������������������������������������������������������������������������������������������������������������������������������������������������������������������������������������������������������������������������������������������������������������������������������������������������������������������������������������������������������������������������������������������������������������������������������������������������������������������������������������������������������������������������������������������������������������������������������������������������������������������������������������������������������������������������������������������������������������������������������������������������������������������������������������������������������������������������������������������������������������������������������������������������������������������������������������������������������������������������������������������������������������������������������������������������������������������������������������������������������������������������������������������������������������������������������������������������������������������������������������������������������������������������������������������������������������������������������������������������������������������������������������������������������������������������������������������������������������������������������������������������������������������������������������������������������������������������������������������������������������������������������������������������������������������������������������������������������������������������������������������������������������������������������������������������������������������������������������������������������������������������������������������������������������������������������������������������������������������������������������������������������������������������������������������������������������������������������������������������������������������������������������������������������������������������������������������������������������������������������������������������������������������������������������������������������������������������������������������������������������������������������������������������������������������������������������������������������������������������������������������������������������������������������������������������������������������������������������������������������������������������������������������������������������������������������������������������������������������������������������������������������������������������������������������������������������������������������������������������������������������������������������������������������������������������������������������������������������������������������������������������������������������������������������������������������������������������������������������������������������������������������������������������������������������������������������������������������������������������������������������������������������������������������������������������������������������������������������������������������������������������������������������������������������������������������������������������������������������������������������������������������������������������������������������������������������������������������������������������������������������������������������������������������������������������������������������������������������������������������������������������������������������������������������������������������������������������������������������������������������������������������������������������������������������������������������������������������������������������������������������������������������������������������������������������������������������������������������������������������������������������������������������������������������������������������������������������������������������������������������������������������������������������������������������������������������������������������������������������������������������������������������������������������������������������������������������������������������������������������������������������������������������������������������������������������������������������������������������������������������������������������������������������������������������������������������������������������������������������������������������������������������������������������������������������������������������������������������������������������������������������������������������������������������������������������������������������������������������������������������������������������������������������������������������������������������������������������������������������������������������������������������������������������������������������������������������������������������������������������������������������������������������������������������������������������������������������������������������������������������������������������������������������������������������������������������������������������������������������������������������������������������������������������������������������������������������������������������������������������������������������������������������������������������������������������������������������������������������������������������������������������������������������������������������������������������������������������������������������������������������������������������������������������������������������������������������������������������������������������������������������������������������������������������������������������������������������������������������������������������������������������������������������������������������������������������������������������������������������������������������������������������������������������������������������������������������������������������������������������������������������������������������������������������������������������������������������������������������������������������������������������������������������������������������������������������������������������������������������������������������������������������������������������������������������������������������������������������������������������������������������������������������������������������������������������������������������������������������������������������������������������������������������������������������������������������������������������������������������������������������������������������������������������������������������������������������������������������������������������������������������������������������������������������������������������������������������������������������������������������������������������������������������������������������������������������������������������������������������������������������������������������������������������������������������������������������������������������������������������������������������������������������������������������������������������������������������������������������������������������������������������������������������������������������������������������������������������������������������������������������������������������������������������������������������������������������������������������������������������������������������������������������������������������������������������������������������������������������������������������������������������������������������������������������������������������������������������������������������������������������������������������������������������������������������������������������������������������������������������������������������������������������������������������������������������������������������������������������������������������������������������������������������������������������������������������������������������������������������������������������������������������������������������������������������������������������������������������������������������������������������������������������������������������������������������������������������������������������������������������������������������������������������������������������������������������������������������������������������������������������������������������������������������������������������������������������������������������������������������������������������������������������������������������������������������������������������������������������������������������������������������������������������������������������������������������������������������������������������������������������������������������������������������������������������������������������������������������������������������������������������������������������������������������������������������������������������������������������������������������������������������������������������������������������������������������������������������������������������������������������������������������������������������������������������������������������������������������������������������������������������������������������������������������������������������������������������������������������������������������������������������������������������������������������������������������������������������������������������������������������������������������������������������������������������������������������������������������������������������������������������������������������������������������������������������������������������������������������������������������������������������������������������������������������������������������������������������������������������������������������������������������������������������������������������������������������������������������������������������������������������������������������������������������������������������������������������������������������������������������������������������������������������������������������������������������������������������������������������������������������������������������������������������������������������������������������������������������������������������������������������������������������������������������������������������������������������������������������������������������������������������������������������������������������������������������������������������������������������������������������������������������������������������������������������������������������������������������������������������������������������������������������������������������������������������������������������������������������������������������������������������������������������������������������������������������������������������������������������������������������������������������������������������������������������������������������������������������������������������������������������������������������������������������������������������������������������������������������������������������������������������������������������������������������������������������������������������������������������������������������������������������������������������������������������������������������������������������������������������������������������������������������������������������������������������������������������������������������������������������������������������������������������������������������������������������������������������������������������������������������������������������������������������������������������������������������������������������������������������������������������������������������������������������������������������������������������������������������������������������������������������������������������������������������������������������������������������������������������������������������������������������������������������������������������������������������������������������������������������������������������������������������������������������������������������������������������������������������������������������������������������������������������������������������������������������������������������������������������������������������������������������������������������������������������������������������������������������������������������������������������������������������������������������������������������������������������������������������������������������������������������������������������������������������������������������������������������������������������������������������������������������������������������������������������������������������������������������������������������������������������������������������������������������������������������������������������������������������������������������������������������������������������������������������������������������������������������������������������������������������������������������������������������������������������������������������������������������������������������������������������������������������������������������������������������������������������������������������������������������������������������������������������������������������������������������������������������������������������������������������������������������������������������������������������������������������������������������������������������������������������������������������������������������������������������������������������������������������������������������������������������������������������������������������������������������������������������������������������������������������������������������������������������������������������������������������������������������������������������������������������������������������������������������������������������������������������������������������������������������������������������������������������������������������������������������������������������������������������������������������������������������������������������������������������������������������������������������������������������������������������������������������������������������������������������������������������������������������������������������������������������������������������������������������������������������������������������������������������������������������������������������������������������������������������������������������������������������������������������������������������������������������������������������������������������������������������������������������������������������������������������������������������������������������������������������������������������������������������������������������������������������������������������������������������������������������������������������������������������������������������������������������������������������������������������������������������������������������������������������������������������������������������������������������������������������������������������������������������������������������������������������������������������������������������������������������������������������������������������������������������������������������������������������������������������������������������������������������������������������������������������������������������������������������������������������������������������������������������������������������������������������������������������������������������������������������������������������������������������������������������������������������������������������������������������������������������������������������������������������������������������������������������������������������������������������������������������������������������������������������������������������������������������������������������������������������������������������������������������������������������������������������������������������������������������������������������������������������������������������������������������������������������������������������������������������������������������������������������������������������������������������������������������������������������������������������������������������������������������������������������������������������������������������������������������������������������������������������������������������������������������������������������������������������������������������������������������������������������������������������������������������������������������������������������������������������������������������������������������������������������������������������������������������������������������������������������������������������������������������������������������������������������������������������������������������������������������������������������������������������������������������������������������������������������������������������������������������������������������������������������������������������������������������������������������������������������������������������������������������������������������������������������������������������������������������������������������������������������������������������������������������������������������������������������������������������������������������������������������������������������������������������������������������������������������������������������������������������������������������������������������������������������������������������������������������������������������������������������������������������������������������������������������������������������������������������������������������������������������������������������������������������������������������������������������������������������������������������������������������������������������������������������������������������������������������������������������������������������������������������������������������������������������������������������������������������������������������������������������������������������������������������������������������������������������������������������������������������������������������������������������������������������������������������������������������������������������������������������������������������������������������������������������������������������������������������������������������������������������������������������������������������������������������������������������������������������������������������������������������������������������������������������������������������������������������������������������������������������������������������������������������������������������������������������������������������������������������������������������������������������������������������������������������������������������������������������������������������������������������������������������������������������������������������������������������������������������������������������������������������������������������������������������������������������������������������������������������������������������������������������������������������������������������������������������������������������������������������������������������������������������������������������������������������������������������������������������������������������������������������������������������������������������������������������������������������������������������������������������������������������������������������������������������������������������������������������������������������������������������������������������������������������������������������������������������������������������������������������������������������������������������������������������������������������������������������������������������������������������������������������������������������������������������������������������������������������������������������������������������������������������������������������������������������������������������������������������������������������������������������������������������������������������������������������������������������������������������������������������������������������������������������������������������������������������������������������������������������������������������������������������������������������������������������������������������������������������������������������������������������������������������������������������������������������������������������������������������������������������������������������������������������������������������������������������������������������������������������������������������������������������������������������������������������������������������������������������������������������������������������������������������������������������������������������������������������������������������������������������������������������������������������������������������������������������������������������������������������������������������������������������������������������������������������������������������������������������������������������������������������������������������������������������������������������������������������������������������������������������������������������������������������������������������������������������������������������������������������������������������������������������������������������������������������������������������������������������������������������������������������������������������������������������������������������������������������������������������������������������������������������������������������������������������������������������������������������������������������������������������������������������������������������������������������������������������������������������������������������������������������������������������������������������������������������������������������������������������������������������������������������������������������������������������������������������������������������������������������������������������������������������������������������������������������������������������������������������������������������������������������������������������������������������������������������������������������������������������������������������������������������������������������������������������������������������������������������������������������������������������������������������������������������������������������������������������������������������������������������������������������������������������������������������������������������������������������������������������������������������������������������������������������������������������������������������������������������������������ribution is then obtained from ranking the Rk and cumulating the associated weights to find the selected confidence level.
This chapter with
has been
reproducedfrom
with permission
from Value
at Risk,
2 Ed. byJorion.
Philippe©
Jorion,
by McGraw-Hill
, New
Reproduced
permission
Value at Risk,
2nd ed.,
by Philippe
2001published
The McGraw-Hill
Companies,
York
2001
(©
McGraw-Hill,
all
rights
reserved).
Inc.
9706.Ch.09 7/19/00 3:38 PM Page 225
nd
CHAPTER 9 VAR Methods
FIGURE
225
9–10
Monte Carlo method.
Historical/implied
data
Model
parameters
Stochastic
model
Future rates
Securities
model
Full
valuation
Portfolio
positions
Distribution
of values
from which a VAR figure can be measured. The method is summarized
in Figure 9–10.
The Monte Carlo method is thus similar to the historical simulation
method, except that the hypothetical changes in prices ⌬Si for asset i in
Equation (9.20) are created by random draws from a prespecified stochastic process instead of sampled from historical data.
9.4.2 Advantages
Monte Carlo analysis is by far the most powerful method to compute VAR.
It can account for a wide range of exposures and risks, including nonlinear price risk, volatility risk, and even model risk. It is flexible enough
to incorporate time variation in volatility, fat tails, and extreme scenarios.
Simulations generate the entire pdf, not just one quantile, and can be used
to examine, for instance, the expected loss beyond a particular VAR.
MC simulation also can incorporate the passage of time, which will
create structural changes in the portfolio. This includes the time decay of
options; the daily settlement of fixed, floating, or contractually specified
cash flows; or the effect of prespecified trading or hedging strategies.
This chapter with
has been
reproducedfrom
with permission
from Value
at Risk,
2 Ed. byJorion.
Philippe©
Jorion,
by McGraw-Hill
, New
Reproduced
permission
Value at Risk,
2nd ed.,
by Philippe
2001published
The McGraw-Hill
Companies,
York
2001
(©
McGraw-Hill,
all
rights
reserved).
Inc.
9706.Ch.09 7/19/00 3:38 PM Page 226
nd
PART 3 Value-at-Risk Systems
226
These effects are especially important as the time horizon lengthens, which
is the case for the measurement of credit risk.
9.4.3 Problems
The biggest drawback of this method is its computational time. If 1000
sample paths are generated with a portfolio of 1000 assets, the total number of valuations amounts to 1 million. In addition, if the valuation of assets on the target date involves itself a simulation, the method requires a
“simulation within a simulation.’’ This quickly becomes too onerous to
implement on a frequent basis.
This method is the most expensive to implement in terms of systems
infrastructure and intellectual development. The MC simulation method
is relatively onerous to develop from scratch, despite rapidly falling prices
for hardware. Perhaps, then, it should be purchased from outside vendors.
On the other hand, when the institution already has in place a system to
model complex structures using simulations, implementing MC simulation is less costly because the required expertise is in place. Also, these
are situations where proper risk management of complex positions is absolutely necessary.
Another potential weakness of the method is model risk. MC relies
on specific stochastic processes for the underlying risk factors as well as
pricing models for securities such as options or mortgages. Therefore, it
is subject to the risk that the models are wrong. To check if the results
are robust to changes in the model, simulation results should be complemented by some sensitivity analysis.
Finally, VAR estimates from MC simulation are subject to sampling
variation, which is due to the limited number of replications. Consider,
for instance, a case where the risk factors are jointly normal and all payoffs linear. The delta-normal method will then provide the correct measure of VAR, in one easy step. MC simulations based on the same covariance matrix will give only an approximation, albeit increasingly good as
the number of replications increases.
Overall, this method is probably the most comprehensive approach
to measuring market risk if modeling is done correctly. To some extent,
the method can even handle credit risks. This is why a full chapter is devoted to the implementation of Monte Carlo simulation methods.
This chapter with
has been
reproducedfrom
with permission
from Value
at Risk,
2 Ed. byJorion.
Philippe©
Jorion,
by McGraw-Hill
, New
Reproduced
permission
Value at Risk,
2nd ed.,
by Philippe
2001published
The McGraw-Hill
Companies,
York
2001
(©
McGraw-Hill,
all
rights
reserved).
Inc.
9706.Ch.09 7/19/00 3:38 PM Page 227
nd
CHAPTER 9 VAR Methods
227
9.5 EMPIRICAL COMPARISONS
It is instructive to compare the VAR numbers obtained from the three
methods discussed. Hendricks (1996), for instance, calculated 1-day VARs
for randomly selected foreign currency portfolios using a delta-normal
method based on fixed windows of equal weights and exponential weights
as well as a historical simulation method.
Table 9–2 summarizes the results, which are compared in terms of
percentage of outcomes falling within the VAR forecast. The middle column shows that all methods give a coverage that is very close to the ideal
number, which is the 95 percent confidence level. At the 99 percent confidence level, however, the delta-normal methods seem to underestimate
VAR slightly, since their coverage falls short of the ideal 99 percent.
Hendricks also reports that the delta-normal VAR measures should
be increased by about 9 to 15 percent to achieve correct coverage. In
other words, the fat tails in the data could be modeled by choosing a
T A B L E 9–2
Empirical Comparison of VAR Methods:
Fraction of Outcomes Covered
Method
Delta-normal
Equal weights over
50 days
250 days
1250 days
Delta-normal
Exponential weights:
ϭ 0.94
ϭ 0.97
ϭ 0.99
Historical simulation
Equal weights over
125 days
250 days
1250 days
95% VAR
99% VAR
95.1%
95.3%
95.4%
98.4%
98.4%
98.5%
94.7%
95.0%
95.4%
98.2%
98.4%
98.5%
94.4%
94.9%
95.1%
98.3%
98.8%
99.0%