Artificial intelligence methodology, systems, and applications 17th international conference, AIMSA 2016
Bạn đang xem bản rút gọn của tài liệu. Xem và tải ngay bản đầy đủ của tài liệu tại đây (23.64 MB, 373 trang )
LNAI 9883
Christo Dichev
Gennady Agre (Eds.)
Artificial Intelligence:
Methodology, Systems,
and Applications
17th International Conference, AIMSA 2016
Varna, Bulgaria, September 7–10, 2016
Proceedings
123
Lecture Notes in Artificial Intelligence
Subseries of Lecture Notes in Computer Science
LNAI Series Editors
Randy Goebel
University of Alberta, Edmonton, Canada
Yuzuru Tanaka
Hokkaido University, Sapporo, Japan
Wolfgang Wahlster
DFKI and Saarland University, Saarbrücken, Germany
LNAI Founding Series Editor
Joerg Siekmann
DFKI and Saarland University, Saarbrücken, Germany
9883
More information about this series at />
Christo Dichev Gennady Agre (Eds.)
•
Artificial Intelligence:
Methodology, Systems,
and Applications
17th International Conference, AIMSA 2016
Varna, Bulgaria, September 7–10, 2016
Proceedings
123
Editors
Christo Dichev
Winston-Salem State University
Winston Salem, NC
USA
Gennady Agre
Institute of Information and Communication
Technologies
Bulgarian Academy of Sciences
Sofia
Bulgaria
ISSN 0302-9743
ISSN 1611-3349 (electronic)
Lecture Notes in Artificial Intelligence
ISBN 978-3-319-44747-6
ISBN 978-3-319-44748-3 (eBook)
DOI 10.1007/978-3-319-44748-3
Library of Congress Control Number: 2016947780
LNCS Sublibrary: SL7 – Artificial Intelligence
© Springer International Publishing Switzerland 2016
This work is subject to copyright. All rights are reserved by the Publisher, whether the whole or part of the
material is concerned, specifically the rights of translation, reprinting, reuse of illustrations, recitation,
broadcasting, reproduction on microfilms or in any other physical way, and transmission or information
storage and retrieval, electronic adaptation, computer software, or by similar or dissimilar methodology now
known or hereafter developed.
The use of general descriptive names, registered names, trademarks, service marks, etc. in this publication
does not imply, even in the absence of a specific statement, that such names are exempt from the relevant
protective laws and regulations and therefore free for general use.
The publisher, the authors and the editors are safe to assume that the advice and information in this book are
believed to be true and accurate at the date of publication. Neither the publisher nor the authors or the editors
give a warranty, express or implied, with respect to the material contained herein or for any errors or
omissions that may have been made.
Printed on acid-free paper
This Springer imprint is published by Springer Nature
The registered company is Springer International Publishing AG Switzerland
Preface
This volume contains the papers presented at the 17th International Conference on
Artificial Intelligence: Methodology, Systems and Applications (AIMSA 2016). The
conference was held in Varna, Bulgaria, during September 7–10, 2016 under the
auspices of the Bulgarian Artificial Intelligence Association (BAIA). This longestablished biannual international conference is a forum both for the presentation of
research advances in artificial intelligence and for scientific interchange among
researchers and practitioners in the field of artificial intelligence.
With the rapid growth of the Internet, social media, mobile devices, and low-cost
sensors, the volume of data is increasing dramatically. The availability of such data
sources has allowed artificial intelligence (AI) to take the next evolutionary step. AI has
evolved to embrace Web-scale content and data and has demonstrated to be a fruitful
research area whose results have found numerous real-life applications. The recent
technological and scientific developments defining AI in a new light explain the theme
of the 17th edition of AIMSA: “AI in the Data-Driven World.”
We received 86 papers in total, and accepted 32 papers for oral and six for poster
presentation. Every submitted paper went through a rigorous review process. Each
paper received at least three reviews from the Program Committee. The papers included
in this volume cover a wide range of topics in AI: from machine learning to natural
language systems, from information extraction to text mining, from knowledge representation to soft computing, from theoretical issues to real-world applications. The
conference theme is reflected in several of the accepted papers. There was also a
workshop run as part of AIMSA 2016: Workshop on Deep Language Processing for
Quality Machine Translation (DeepLP4QMT). The conference program featured three
keynote presentations: one by Josef van Genabith, Scientific Director at DFKI, the
German Research Centre for Artificial Intelligence, the second one from Benedict Du
Boulay, University of Sussex, United Kingdom, and the third one by Barry O’Sullivan
Director of the Insight Centre for Data Analytics in the Department of Computer
Science at University College Cork.
As with all conferences, the success of AIMSA 2016 depended on its authors,
reviewers, and organizers. We are very grateful to all the authors for their paper
submissions, and to all the reviewers for their outstanding work in refereeing the papers
within a very tight schedule. We would also like to thank the local organizers for their
excellent work that made the conference run smoothly. AIMSA 2016 was organized by
the Institute of Information and Communication Technologies Bulgarian Academy of
Sciences, Sofia, Bulgaria, which provided generous financial and organizational support. A special thank you is extended to the providers of the EasyChair conference
management system; the use of EasyChair for managing the reviewing process and for
creating these proceedings eased our work tremendously.
July 2016
Christo Dichev
Gennady Agre
Organization
Program Committee
Gennady Agre
Galia Angelova
Grigoris Antoniou
Roman Bartak
Eric Bell
Tarek Richard Besold
Maria Bielikova
Loris Bozzato
Justin F. Brunelle
Ricardo Calix
Diego Calvanese
Soon Ae Chun
Sarah Jane Delany
Christo Dichev
Darina Dicheva
Danail Dochev
Benedict Du Boulay
Stefan Edelkamp
Love Ekenberg
Floriana Esposito
Albert Esterline
Michael Floyd
Susan Fox
Geert-Jan Houben
Dmitry Ignatov
Grigory Kabatyanskiy
Mehdi Kaytoue
Kristian Kersting
Institute of Information and Communication
Technologies at Bulgarian Academy of Sciences,
Bulgaria
Institute of Information and Communication
Technologies at Bulgarian Academy of Sciences,
Bulgaria
University of Huddersfield, UK
Charles University in Prague, Czech Republic
Pacific Northwest National Laboratory, USA
Free University of Bozen-Bolzano, Italy
Slovak University of Technology in Bratislava, Slovakia
Fondazione Bruno Kessler, Italy
Old Dominion University, USA
Purdue University Calumet, USA
Free University of Bozen-Bolzano, Italy
CUNY, USA
Dublin Institute of Technology, Ireland
Winston-Salem State University, USA
Winston-Salem State University, USA
Institute of Information and Communication
Technologies at Bulgarian Academy of Sciences,
Bulgaria
University of Sussex, UK
University of Bremen, Germany
International Institute of Applied Systems Analysis,
Austria
University of Bari Aldo Moro, Italy
North Carolina A&T State University, USA
Knexus Research Corporation, USA
Macalester College, USA
TU Delft, The Netherlands
National Research University,
Higher School of Economics, Russia
Institute for Information Transmission Problems, Russia
INSA, France
Technical University of Dortmund, Germany
VIII
Organization
Vladimir Khoroshevsky
Matthias Knorr
Petia Koprinkova-Hristova
Leila Kosseim
Adila A. Krisnadhi
Kai-Uwe Kuehnberger
Sergei O. Kuznetsov
Evelina Lamma
Frederick Maier
Riichiro Mizoguchi
Malek Mouhoub
Amedeo Napoli
Michael O’Mahony
Sergei Obiedkov
Manuel Ojeda-Aciego
Horia Pop
Allan Ramsay
Chedy Raïssi
Ioannis Refanidis
Roberto Santana
Ute Schmid
Sergey Sosnovsky
Stefan Trausan-Matu
Dan Tufis
Petko Valtchev
Julita Vassileva
Tulay Yildirim
David Young
Dominik Ślezak
Computer Center of Russian Academy of Science,
Russia
Universidade Nova de Lisboa, Portugal
Institute of Information and Communication
Technologies at Bulgarian Academy of Sciences,
Bulgaria
Concordia University, Montreal, Canada
Wright State University, USA
University of Osnabrück, Germany
National Research University,
Higher School of Economics, Russia
University of Ferrara, Italy
Florida Institute for Human and Machine Cognition,
USA
Japan Advanced Institute of Science and Technology,
Japan
University of Regina, Canada
LORIA, France
University College Dublin, Ireland
National Research University,
Higher School of Economics, Russia
University of Malaga, Spain
University Babes-Bolyai, Romania
University of Manchester, UK
Inria, France
University of Macedonia, Greece
University of the Basque Country, Spain
University of Bamberg, Germany
CeLTech, DFKI, Germany
University Politehnica of Bucharest, Romania
Research Institute for Artificial Intelligence,
Romanian Academy, Romania
University of Montreal, Canada
University of Saskatchewan, Canada
Yildiz Technical University, Turkey
University of Sussex, UK
University of Warsaw, Poland
Additional Reviewers
Boytcheva, Svetla
Cercel, Dumitru-Clementin
Loglisci, Corrado
Rizzo, Giuseppe
Stoimenova, Eugenua
Zese, Riccardo
Contents
Machine Learning and Data Mining
Algorithm Selection Using Performance and Run Time Behavior . . . . . . . . .
Tri Doan and Jugal Kalita
3
A Weighted Feature Selection Method for Instance-Based Classification . . . .
Gennady Agre and Anton Dzhondzhorov
14
Handling Uncertain Attribute Values in Decision Tree Classifier
Using the Belief Function Theory . . . . . . . . . . . . . . . . . . . . . . . . . . . . . . .
Asma Trabelsi, Zied Elouedi, and Eric Lefevre
26
Using Machine Learning to Generate Predictions Based on the Information
Extracted from Automobile Ads . . . . . . . . . . . . . . . . . . . . . . . . . . . . . . . .
Stere Caciandone and Costin-Gabriel Chiru
36
Estimating the Accuracy of Spectral Learning for HMMs. . . . . . . . . . . . . . .
Farhana Ferdousi Liza and Marek Grześ
46
Combining Structured and Free Textual Data of Diabetic Patients’
Smoking Status. . . . . . . . . . . . . . . . . . . . . . . . . . . . . . . . . . . . . . . . . . . .
Ivelina Nikolova, Svetla Boytcheva, Galia Angelova, and Zhivko Angelov
57
Deep Learning Architecture for Part-of-Speech Tagging with Word
and Suffix Embeddings . . . . . . . . . . . . . . . . . . . . . . . . . . . . . . . . . . . . . .
Alexander Popov
68
Response Time Analysis of Text-Based CAPTCHA by Association Rules . . .
Darko Brodić, Alessia Amelio, and Ivo R. Draganov
78
New Model Distances and Uncertainty Measures for Multivalued Logic . . . .
Alexander Vikent’ev and Mikhail Avilov
89
Visual Anomaly Detection in Educational Data. . . . . . . . . . . . . . . . . . . . . .
Jan Géryk, Luboš Popelínský, and Jozef Triščík
99
Extracting Patterns from Educational Traces via Clustering
and Associated Quality Metrics. . . . . . . . . . . . . . . . . . . . . . . . . . . . . . . . .
Marian Cristian Mihăescu, Alexandru Virgil Tănasie, Mihai Dascalu,
and Stefan Trausan-Matu
109
X
Contents
Natural Language Processing and Sentiment Analysis
Classifying Written Texts Through Rhythmic Features. . . . . . . . . . . . . . . . .
Mihaela Balint, Mihai Dascalu, and Stefan Trausan-Matu
Using Context Information for Knowledge-Based Word Sense
Disambiguation. . . . . . . . . . . . . . . . . . . . . . . . . . . . . . . . . . . . . . . . . . . .
Kiril Simov, Petya Osenova, and Alexander Popov
121
130
Towards Translation of Tags in Large Annotated Image Collections . . . . . . .
Olga Kanishcheva, Galia Angelova, and Stavri G. Nikolov
140
Linking Tweets to News: Is All News of Interest? . . . . . . . . . . . . . . . . . . .
Tariq Ahmad and Allan Ramsay
151
A Novel Method for Extracting Feature Opinion Pairs for Turkish . . . . . . . .
Hazal Türkmen, Ekin Ekinci, and Sevinç İlhan Omurca
162
In Search of Credible News . . . . . . . . . . . . . . . . . . . . . . . . . . . . . . . . . . .
Momchil Hardalov, Ivan Koychev, and Preslav Nakov
172
Image Processing
Smooth Stroke Width Transform for Text Detection . . . . . . . . . . . . . . . . . .
Il-Seok Oh and Jin-Seon Lee
Hearthstone Helper - Using Optical Character Recognition Techniques
for Cards Detection . . . . . . . . . . . . . . . . . . . . . . . . . . . . . . . . . . . . . . . . .
Costin-Gabriel Chiru and Florin Oprea
183
192
Reasoning and Search
Reasoning with Co-variations . . . . . . . . . . . . . . . . . . . . . . . . . . . . . . . . . .
Fadi Badra
205
Influencing the Beliefs of a Dialogue Partner . . . . . . . . . . . . . . . . . . . . . . .
Mare Koit
216
Combining Ontologies and IFML Models Regarding the GUIs of Rich
Internet Applications . . . . . . . . . . . . . . . . . . . . . . . . . . . . . . . . . . . . . . . .
Naziha Laaz and Samir Mbarki
Identity Judgments, Situations, and Semantic Web Representations . . . . . . . .
William Nick, Yenny Dominguez, and Albert Esterline
Local Search for Maximizing Satisfiability in Qualitative Spatial and
Temporal Constraint Networks . . . . . . . . . . . . . . . . . . . . . . . . . . . . . . . . .
Jean-François Condotta, Ali Mensi, Issam Nouaouri, Michael Sioutis,
and Lamjed Ben Saïd
226
237
247
Contents
Forming Student Groups with Student Preferences Using Constraint
Logic Programming. . . . . . . . . . . . . . . . . . . . . . . . . . . . . . . . . . . . . . . . .
Grace Tacadao and Ramon Prudencio Toledo
XI
259
Intelligent Agents and Planning
InterCriteria Analysis of Ant Algorithm with Environment Change for GPS
Surveying Problem . . . . . . . . . . . . . . . . . . . . . . . . . . . . . . . . . . . . . . . . .
Stefka Fidanova, Olympia Roeva, Antonio Mucherino,
and Kristina Kapanova
271
GPU-Accelerated Flight Route Planning for Multi-UAV Systems
Using Simulated Annealing . . . . . . . . . . . . . . . . . . . . . . . . . . . . . . . . . . .
Tolgahan Turker, Guray Yilmaz, and Ozgur Koray Sahingoz
279
Reconstruction of Battery Level Curves Based on User Data Collected
from a Smartphone . . . . . . . . . . . . . . . . . . . . . . . . . . . . . . . . . . . . . . . . .
Franck Gechter, Alastair R. Beresford, and Andrew Rice
289
Possible Bribery in k-Approval and k-Veto Under Partial Information . . . . . .
Gábor Erdélyi and Christian Reger
299
An Adjusted Recommendation List Size Approach for Users’ Multiple
Item Preferences . . . . . . . . . . . . . . . . . . . . . . . . . . . . . . . . . . . . . . . . . . .
Serhat Peker and Altan Kocyigit
310
mRHR: A Modified Reciprocal Hit Rank Metric for Ranking Evaluation
of Multiple Preferences in Top-N Recommender Systems . . . . . . . . . . . . . .
Serhat Peker and Altan Kocyigit
320
A Cooperative Control System for Virtual Train Crossing . . . . . . . . . . . . . .
Bofei Chen and Franck Gechter
330
Posters
Artificial Intelligence in Data Science . . . . . . . . . . . . . . . . . . . . . . . . . . . .
Lillian Cassel, Darina Dicheva, Christo Dichev, Don Goelman,
and Michael Posner
343
Exploring the Use of Resources in the Educational Site Ucha.SE . . . . . . . . .
Ivelina Nikolova, Darina Dicheva, Gennady Agre, Zhivko Angelov,
Galia Angelova, Christo Dichev, and Darin Madzharov
347
Expressing Sentiments in Game Reviews . . . . . . . . . . . . . . . . . . . . . . . . . .
Ana Secui, Maria-Dorinela Sirbu, Mihai Dascalu, Scott Crossley,
Stefan Ruseti, and Stefan Trausan-Matu
352
XII
Contents
The Select and Test (ST) Algorithm and Drill-Locate-Drill (DLD)
Algorithm for Medical Diagnostic Reasoning . . . . . . . . . . . . . . . . . . . . . . .
D.A. Irosh P. Fernando and Frans A. Henskens
How to Detect and Analyze Atherosclerotic Plaques in B-MODE
Ultrasound Images: A Pilot Study of Reproducibility
of Computer Analysis . . . . . . . . . . . . . . . . . . . . . . . . . . . . . . . . . . . . . . .
Jiri Blahuta, Tomas Soukup, and Petr Cermak
356
360
Multifactor Modelling with Regularization . . . . . . . . . . . . . . . . . . . . . . . . .
Ventsislav Nikolov
364
Author Index . . . . . . . . . . . . . . . . . . . . . . . . . . . . . . . . . . . . . . . . . . . .
369
Machine Learning and Data Mining
Algorithm Selection Using Performance
and Run Time Behavior
Tri Doan(B) and Jugal Kalita
University of Colorado Colorado Springs, 1420 Austin Bluffs Pkwy,
Colorado Springs, CO 80918, USA
{tdoan,jkalita}@uccs.edu
Abstract. In data mining, an important early decision for a user to make
is to choose an appropriate technique for analyzing the dataset at hand
so that generalizations can be learned. Intuitively, a trial-and-error approach becomes impractical when the number of data mining algorithms is
large while experts’ advice to choose among them is not always available
and affordable. Our approach is based on meta-learning, a way to learn
from prior learning experience. We propose a new approach using regression to obtain a ranked list of algorithms based on data characteristics and
past performance of algorithms in classification tasks. We consider both
accuracy and time in generating the final ranked result for classification,
although our approach can be extended to regression problems.
Keywords: Algorithm selection
1
· Meta-learning · Regression
Introduction
Different data mining algorithms seek out with different patterns hidden inside
a dataset. Choosing the right algorithm can be a decisive activity before a data
mining model is used to uncover hidden information in the data. Given a new
dataset, data mining practitioners often explore several algorithms they are used
to, to select the one to finally use. In reality, no algorithms can outperform all
others in all data mining tasks [22] because data mining algorithms are designed
with specific assumptions in mind to allow them to effectively work in particular
domains or situations.
Experimenting may become impractical due to the large number of machine
learning algorithms that are readily available these days. Our proposed solution uses a meta-learning framework to build a model to predict an algorithm’s
behavior on unseen datasets. We convert the algorithm selection problem into a
problem of generating a ranked list of data mining algorithms so that regression
can be used to solve it.
The remainder of the paper is organized as follows. Section 2 presents related
work. Section 3 presents our proposed approach followed by our experiments
with discussion in Sect. 4. Finally, Sect. 5 summarizes the paper and provides
directions for future study.
c Springer International Publishing Switzerland 2016
C. Dichev and G. Agre (Eds.): AIMSA 2016, LNAI 9883, pp. 3–13, 2016.
DOI: 10.1007/978-3-319-44748-3 1
4
2
T. Doan and J. Kalita
Related Work
Two common approaches to deal with algorithm selection are the learning
curves approach and the dataset characteristics-based approach. While similarity between learning curves of two algorithms may indicate the likelihood
that the two algorithm discover common patterns in similar datasets [15] in the
learning curve approach, algorithm behavior is determined based on a dataset’s
specific characteristics [17] in the latter approach. Mapping dataset characteristics to algorithm behavior can be used in the meta-learning approach, which we
find to be well suited for solving algorithm selection.
Some data mining practitioners may select an algorithm that achieves acceptable accuracy with a relatively short run time. For example, a classifier of choice
for protein-protein interaction (PPI) should take run time into account as the
computational cost is high when working with large PPI networks [23]. As a
result, a combined measurement metric for algorithm performance (e.g., one
that combines accuracy and execution time) should be defined as a monotonic
measure of performance mp(.) such that mp(f1 ) > mp(f2 ) implies f1 is better f2
and vice versa. For example, the original ARR (Adjusted Ratio of Ratios) metric
proposed by [3] uses the ratio between accuracy and execution time but does not
guarantee monotonicity which has lead to others to propose a modified formula
[1]. However, the use of single metric may not be desirable because it does not
take into account the skew of data distribution and prior class distributions [4].
Model selection, on the other hand, focuses on hyper-parameter search to find
the optimal parameter settings for an algorithm’s best performance. For example,
AUTO-WEKA [21] searches for parameter values that are optimal for a given
algorithm for a given dataset. A variant version by [8] is a further improvement
by taking past knowledge into account. The optimal model is selected by finding
parameter settings for the same data mining algorithms and therefore model
selection can be treated as a compliment to algorithm selection.
Our meta-learning approach can be distinguished from similar work in two
ways: we use feature generation to obtain a fixed number of transformed features
for each original dataset before generating meta-data, and we also use our proposed combined metric to integrate execution time with accuracy measurement.
3
Proposed Approach
The two main components of our proposed work are a regression model and a
meta-data set (as training data). Regression has been used for predicting performance of data mining algorithms [2,11]. However, such works has either used
a single metric such as accuracy or does not use data characteristics. A metadata set is described in terms of features that may be used to characterize how
a certain dataset performs with a certain algorithm. For example, statistical
summaries have been used to generate new features for such meta-data. Due to
varying number of features in real world datasets, the use of averages of statistical summaries as used in current studies may not suitable as a meta-data
Algorithm Selection Using Performance and Run Time Behavior
5
features. To overcome this problem, we transform each dataset into a fixed feature format in order to obtain the same number of statistical summaries to be
used as features for a training meta-dataset.
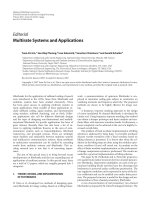
We illustrate our proposed model in Fig. 1 with three main layers. A upper
layer includes original datasets and corresponding transformed counterparts. The
mid-layer describes the meta-data set(training data) where each instance (details
in Table 4) includes three components. Two of these components are retrieved
from the original dataset while the third component is a set of features generated from a transformed dataset in the upper layer. The label on each instance
represents the performance of a particular algorithm in term of the proposed
metric. The last layer is our regression model where we produced a predicted
ranked list of algorithms sorted by performance for an unseen dataset.
Fig. 1. Outline of the proposed approach
Using the knowledge of past experiments using m data mining algorithms on
n known datasets, we can generate m × n training examples.
3.1
The Number of Features in Reduced Dataspace
The high dimensionality of datasets is a common problem in many data mining
problems (e.g., in image processing, computational linguistics, and bioinformatics). In our work, dimensionality reduction produces a reduced data space with
a fixed number of features to generate meta-features of training examples. Since
different datasets have different number of features, our suggestion is to experimentally search for the number of features for a data mining application that
does not cause a significant loss in performance. In our study, we want performance to be at least 80 % on the transformed dataset (although this number can
be a parameter) compared to the full feature dataset.
Table 1 illustrates the performance when the size of feature space varies. We
observe that the performances is the worst with one feature. With two features,
there is an improvement in performance. However, using a low number of features
6
T. Doan and J. Kalita
Table 1. Experiments of accuracy performance on reduced feature space
Dataset
acc
acc1 acc2 acc3 acc4 acc5
acc6 acc7 acc8 acc9 acc10 Features
leukemia
.72
.545 .590 .636 .636
.5
splice
.951 .5
.587 .766 .753
.747 .786 .705 .788 .773 .479
60
colon-cancer
.709 .631 .638 .631 .578
.631 .578 .684 .574 .631 .684
2000
digits
.643 .346 .595 .642 .602
.602 .602 .602 .602 .602 .602
usps
.829 .408 .615 .723 .726
.707 .708 .716 .7
ionosphere
.9
german-numer
.729 .49
.266 .528 .528 .726
.676 .633 .66
.5
.636 .590 .681 .595
7129
64
.705 .711
256
.566 .528 .584 .584 .518 .575
34
.613 .61
24
.633 .59
.673 .635
segment
.94
.342 .461 .810 .825
.822 .754 .772 .837 .834 .821
19
heart-statlog
.807 .230 .580 .469 .518
.456 .481 .530 .531 .456 .555
13
wbreast-cancer .963 .573 .536 .541 .551
.551 .521 .560 .522 .551 .517
10
vowel
.688 .294 .474 .484 .521
.521 .547 .531 .536 .542 .518
10
glass
.635 0461 .507 .516 .523
.508 .485 .408 .477 .523
diabetes
.743 .666 .673 .703 .656 0.67
live-disorder
.634 .567 .634 .557 .606
9
.633 .647 .656
8
.586 .548
6
fourclass
.832 .595 .61
Note: acc, feature: refers accuracy, features with original dataset
2
may not be enough to perform well on a learning task in general. In addition,
computing a relatively low number of features w.r.t the original dataset often
requires higher computation time to avoid the non-convergence problem and gets
lower performance [20]. Our experiments with datasets from biomedical, image
processing, and text domains show that the use of four features in the reduced
dataset works well.
The value of 4 is a good choice for the number of features as it satisfies
our objective to secure at least 80 % of the performance of algorithms on the
original datasets. We report the average of performances from all classification
experiments as we change the number of features in Table 2 to evaluate how we
choose the number dimension in our study. This choice is further evaluated with
lowest run time in our assessment (accuracy and run time) compared to three
or higher-than-4 dimensions.
Table 2. Average performance in different dimension space
No features
1
2
3
4
5
6
7
8
9
10
Avg accuracy .5312 .581 .617 .6463 .6085 .5901 .6153 .6144 .6239 .6373
We perform classification to collect labels (accuracy measurement) for training examples. All available classification algorithms (refer to Table 3) are run on
each of these reduced datasets.
Algorithm Selection Using Performance and Run Time Behavior
7
Table 3. Algorithms used in our experiments
IBk
ZeroR
OneR
LWL
JRip
LibSVM
Bagging
SMO
Stacking
decisionStump
LogitBoost
RandomTree
Logistic
MultiLayerPerceptron J48
3.2
NaiveBayes
DecisionTable
PART
RandomForests
RandomCommittee AdaBoost
Vote
KStar
Measurement Metric
One problem in data mining is the use of a variety of measurement metrics that
leads to different comparisons. We will use the metric called SAR proposed by [4]
instead of accuracy. SAR is defined as SAR = [Accuracy+AUC+(1−RMSE)]/3.
Inspired also by the A3R metric in [1], we develop a metric that we call
the Adjusted Combined metric Ratio as a combined
√ metric between SAR and
execution time defined as follows ACR = SAR/(β rt + 1 + 1)) where β ∈ [0, 1],
rt denotes run time.
The proposed ACR metric guarantees a monotonic decrease for execution
time so that the longer run the time, the lower is the algorithm’s performance.
When time is ignored (when β = 0), the ACR formula becomes ACR = SAR
which is a more robust evaluation metric than accuracy.
Figure 2 illustrates the monotonically decreasing function ACR as run time
rt increases. When β > 0, our ACR formula reflects the idea of a penalization
factor β if the run time is high. The performance of each algorithm computed
using SAR and running time are recorded for each case as the performance
feature. The remaining features are computed from a set of 4 features in the
transformed dataset. This way, one instance of meta-data is generated from one
transformed dataset. We record the result of running each algorithm on a dataset
as a triple < primary dataset, algorithm, perf ormance > where the primary
dataset is described in terms of its extracted characteristics or its meta-data, the
algorithm represented simply by its name (in Weka), and computed performance
on the dataset after feature reduction using the pre-determined β.
3.3
Meta-Features
We use a total of 30 meta-features for the training data, as given in Table 4. Each
row of training data corresponds to meta-data obtained from a real dataset.
Let LCoef ab be a feature that measures the correlation coefficient between
new transformed features a and b generated by a specific dimensionality reduction method (any 2 out of 3 features generated with PCA, similar to KPCA in
each transformed dataset). We have 6 such features: pcaLCoef 12 , pcaLCoef 13 ,
8
T. Doan and J. Kalita
Table 4. Description of 30 meta-features
Feature
Description
ClassInt
Ratio of number of classes to instances
AttrClass
Ratio of number of features to number of classes
BestInfo
Most informative feature in original data
pcaST D1,2,3
Standard deviation for feature generated with PCA
kpcaST D1,2,3
Standard deviation for feature generated with KPCA
pcaLCoef
ab
Pearson linear coefficient
pcaSkew1,2,3
Measure of asymmetry of the probability distribution
pcaKurtosis
Quantify shape of distribution
1,2,3
kpcaLCoef ab
Pearson linear coefficient
kpcaSkew
Measure of asymmetry of the probability distribution
1,2,3
kpcaKurtosis1,2,3 Quantify shape of distribution
nCEntropy
Normalized class entropy
entroClass
Class entropy for target attribute
TotalCorr
Amount of information shared among variables
Performance
ACR metric generated for each β setting
Note: the details of the above features explained below
Fig. 2. Different β value plots for ACR measures
pcaLCoef 23 , kpcaLCoef 12 , kpcaLCoef 13 , and kpcaLCoef 23 . Each standard
deviation value for the six new features is computed resulting in 6 standard deviation features (3 pcaSTD features and 3 kpcaSTD features). Similarly, 6 skewness
and 6 kurtosis features are calculated for the 6 new transformed features.
4
Experimental Setup
We use datasets in Table 5 to generate transformed datasets and produce training
data. We choose the best regression model among 6 candidates in Table 6 as our
regression model. We introduce a parameter β to control the trade-off between the
Algorithm Selection Using Performance and Run Time Behavior
9
Table 5. Datasets used
Arrhythmia
ionososphere
prnn-virus 3
bankrupt
japaneseVowels
RedWhiteWine
breastCancer
letter
segment
breastW
labor
sensorDiscrimination
cpu
liver disorder
solar flare
credit-a
lung cancer
sonar
cylinderBands
lymph
spambase
dermatology
sick
specfull
diabetes
molecularPromoter splice
glass
monk-problem 1
spong
haberman
monk-problem 2
synthesis control
heart-cleveland monk-problem 3
thyriod disease
heart-hungary
mushroom
tic-tac-toe
heart-stalog
page-blocks
vote
hepatitis
pen digits
vowels
horse-colic
post operation
wine
hypotheriod
primary tumor
SAR metric (instead of Accuracy) and time. This metric is designed to measure
the performance of a single algorithm on a particular dataset whereas A3R and
ARR measure the performance of two algorithms on the same dataset. Figure 2
gives the ACR plots for 5 different values of β. For example, with β = 0, the user
emphasizes the SAR metric (given as horizontal line) and accepts whatever the run
time is. On the other hand, when β = 1, the user trades the SAR measurement
for time. In this case, SAR is penalized more than half of its actual value.
Computed values of the proposed metric (ACR) are used as a performance
(response) measurement corresponding to each training example. The generated
meta-data are used as training examples in experiments with the 6 regression
models 6 to select the best regression model to produce a ranked list of algorithms
predicted performance.
To evaluate the performances among candidate regression algorithms in producing the final ranked list of algorithms, we use the RMSE metric and report
the results in Table 6. This result is further assessed with Spearman’s rank correlation test [13] to measure how close two ranks are, one predicted and the
other based on actual performance. Our experiments (see Table 6) indicate that
tree models, particularly CUBIST [18] obtain low RMSE compared to other
non-linear regression models such as SVR [19], LARS [7] and MARS [10].
With the predicted performance of the ACR metric, our selected model
(CUBIST) generates a ranked list of applicable algorithms. Note that we use β = 0
in the ACR formula to indicate the choice of performance based on SAR only.
10
T. Doan and J. Kalita
Table 6. RMSEs by multiple regression models
Tree models
RMSE
Model tree
0.9308
Conditional D.T 0.9166
Cubist
4.1
Other models RMSE
SVR
0.9714
LARS
0.9668
0.9025 MARS
0.9626
Experiment on Movie Dataset
In the section, we validate our proposed approach with a movie review dataset
using algorithms in Table 3. Our goal is to show how a classifier algorithm can
be picked by varying the importance of SAR (or Accuracy) vs. time. Our initial
hunch is that Naive Bayes should be a highly recommended candidate because of
both high accuracy and low run time [6], in particular for its ability to deal with
non-numeric features. Naive Bayes was also used by [14] on the same dataset.
Using top 5 algorithms from the ranked result list, we compute and compare
results with those obtained by Naive Bayes classification. This collection of
50,000 movie reviews has at most 30 reviews for each movie [16] where a high
score indicates a positive review. Each file is named < counter > < score > .txt
where the score is a value in the range (0..10). This “Large Movie Review Data
Set” is present many challenges including high dimensionality with text features.
We perform the pre-processing steps including removal of punctuation, numbers and stop words before tokenization. Each token is considered a feature.
There is a total of 117,473 features and 25,000 rows of reviews. The document term matrix (117,473 × 25000 = 2,936,825,000) has only 2,493,414 non-zero
entries or only 2,493,414/2,936,825,000 = 0.000849 fraction of the entries is nonzero. After pre-processing the movie sentiment dataset, we obtain a meta-data
instance for this dataset and apply the Cubist regression model. We use 3 different values of β to compute corresponding ACR to obtain three sets of labels
for meta-data (β = 0, the higher SAR the better), a trade-off of SAR for time
(β = 0.5 and β = 0.75), and in favor of time (β = 1, the shorter the better).
We note that when β > 0, we take only run time into consideration (see Fig. 2)
whereas using β = 0, we emphasize the SAR performance metric (as ACR equals
SAR). We provide a short list of 5 top performers with 3 different values of β in
Table 7.
4.2
Discussion
Our initial thought was that Naive Bayes was likely to be a good algorithm
because of both high accuracy and low run time [6,14] particularly for its ability
to deal with non-numeric features. We experiment with this algorithm of choice
and compare with the Cubist method on the Movie Sentiment dataset [16] and
report in Table 8.
As we see in Table 7, the list of top 5 algorithms changes significantly between
β = 0 and β = 1 due to the trade-off between time and SAR. Two high performing
Algorithm Selection Using Performance and Run Time Behavior
11
Table 7. Top 5 classifiers with different β
β=0
β = 0.5
β=1
Logistic
Random Tree
NaiveBayes
Random Forests NaiveBayes
LWL
NaiveBayes
LWL
Logistic
SVM
Logistic
RandomCommittee
Bagging
Random Committee RandomForest
classifiers, viz., Random Forests and SVM suffer from high computational time.
When we prefer low run time, two other algorithms, LWL [9], and Random Committee [12] move into the top 5 ranked list. If we consider a compromise between
SAR and time, we can use β = 0.5 which places Random Tree [5] and Naive Bayes
on top of the ranked list and moves Random Forests and SVM down to 6th and 7th
places in the final ranked list. It also shows that Naive Bayes is in 3rd place when
we ignore run time. Given the fact that Naive Bayes is fast, if we are in favor of
low execution time, we can increase β. The result shows that Naive Bayes classifier
moves into 2nd place, or 1st place with β = 0.5, or β = 1, respectively.
Table 8 shows the performance using accuracy, AUC and RMSE with the
SAR metric and run time for the top 5 algorithms. The lower AUC and higher
RMSE of SVM compared to Naive Bayes explain the rank of SVM. Otherwise,
SAR can be a good indicator for the corresponding accuracy.
We also note that our ranked results obtained with the combined SAR metric
(with β = 0) are different from [3]. For instance, Brazdil et al. [3] rank Random
Forests first but we rank it second due to lower AUC of this algorithm’s performance on abalone. SVM in both methods ranks fourth but we are different in
first place.
Table 8. Accuracy and SAR Performance on validation task
5
Algorithm
Accuracy AUC RMSE SAR Time
Logistic
0.856
0.93
0.325
0.820 171.88
Rand.Forest 0.838
0.916 0.393
0.787 237.7
NaiveBayes
0.816
0.9
0.779 10.03
SVM
0.848
0.848 0.389
0.769 529.16
Bagging
0.778
0.856 0.391
0.748 1170.3
0.388
Conclusion and Future Work
In this study, we demonstrate an alternative way to select suitable classification
algorithms for a new dataset using the meta-learning approach. As the use of
12
T. Doan and J. Kalita
ensemble methods in real world applications becomes widespread, research on
algorithm selection becomes more interesting but also challenging. We see the
ensemble model as a good candidate to tackle the problem of big data when
a single data mining algorithm may not be able to perform well because of
limited computer resources. We want to expand this work to be able to provide
performance values as well as estimated run time in the outcome.
References
1. Abdulrahman, M., Brazdil, P.: Measures for combining accuracy and time for metalearning. In: ECAI, p. 49 (2014)
2. Bensusan, H., Kalousis, A.: Estimating the predictive accuracy of a classifier. In:
Flach, P.A., De Raedt, L. (eds.) ECML 2001. LNCS (LNAI), vol. 2167, pp. 25–36.
Springer, Heidelberg (2001)
3. Brazdil, P.B., Soares, C., Da Costa, J.P.: Ranking learning algorithms: using IBL
and meta-learning on accuracy and time results. Mach. Learn. 50(3), 251–277
(2003)
4. Caruana, R., Niculescu-Mizil, A.: Data mining in metric space: an empirical analysis of supervised learning performance criteria. In: Proceedings of the Tenth ACM
SIGKDD. ACM (2004)
5. Cutler, A., Zhao, G.: Fast classification using perfect random trees. Utah State
University (1999)
6. Dinu, L.P., Iuga, I.: The naive bayes classifier in opinion mining: in search of the
best feature set. In: Gelbukh, A. (ed.) CICLing 2012, Part I. LNCS, vol. 7181, pp.
556–567. Springer, Heidelberg (2012)
7. Efron, B., Hastie, T., Johnstone, I., Tibshirani, R., et al.: Least angle regression.
Ann. Stat. 32(2), 407–499 (2004)
8. Feurer, M., Springenberg, J.T., Hutter, F.: Using meta-learning to initialize
bayesian optimization of hyperparameters. In: ECAI Workshop (MetaSel) (2014)
9. Frank, E., Hall, M., Pfahringer, B.: Locally weighted naive bayes. In: Proceedings
of the Nineteenth Conference on Uncertainty in Artificial Intelligence, pp. 249–256.
Morgan Kaufmann Publishers Inc., Burlington (2002)
10. Friedman, J.: Multivariate adaptive regression splines. Ann. Stat. 19(1), 1–141
(1991)
11. Gama, J., Brazdil, P.: Characterization of classification algorithms. In: PintoFerreira, C., Mamede, N.J. (eds.) EPIA 1995. LNCS, vol. 990, pp. 189–200.
Springer, Heidelberg (1995)
12. Hall, M., Frank, E.: The WEKA data mining software: an update. ACM SIGKDD
Explor. Newslett. 11(1), 10–18 (2009)
13. Kuhn, M., Johnson, K.: Applied Predictive Modeling. Springer, Berlin (2013)
14. Le, Q.V., Mikolov, T.: Distributed representations of sentences and documents.
arXiv preprint (2014). arXiv:1405.4053
15. Leite, R., Brazdil, P., Vanschoren, J.: Selecting classification algorithms with active
testing. In: Perner, P. (ed.) MLDM 2012. LNCS, vol. 7376, pp. 117–131. Springer,
Heidelberg (2012)
16. Maas, A.L., Daly, R.E., Pham, P.T., Huang, D., Ng, A.Y., Potts, C.: Learning
word vectors for sentiment analysis. In: 49th ACL, pp. 142–150 (2011)
Algorithm Selection Using Performance and Run Time Behavior
13
17. Prudˆencio, R.B.C., de Souto, M.C.P., Ludermir, T.B.: Selecting machine learning
algorithms using the ranking meta-learning approach. In: Jankowski, N., Duch,
W., Gr¸abczewski, K. (eds.) Meta-Learning in Computational Intelligence. SCI,
vol. 358, pp. 225–243. Springer, Heidelberg (2011)
18. Quinlan, J.R.: Combining instance-based and model-based learning. In: Proceedings of the Tenth International Conference on Machine Learning (1993)
19. Smola, A.J., et al.: Regression estimation with support vector learning machines.
Master’s thesis, Technische Universit at M¨
unchen (1996)
20. Sorzano, C.O.S., Vargas, J., Montano, A.P.: A survey of dimensionality reduction
techniques. arXiv preprint (2014). arXiv:1403.2877
21. Thornton, C., Hutter, F., Hoos, H.H., Leyton-Brown, K.: Auto-WEKA: combined
selection and hyperparameter optimization of classification algorithms. In: 19th
SIGKDD. ACM (2013)
22. Wolpert, D., Macready, W.: No free lunch theorems for optimization. IEEE Trans.
Evol. Comput. 1(1), 67–82 (1997)
23. You, Z.H., Lei, Y.K., Zhu, L., Xia, J., Wang, B.: Prediction of protein-protein
interactions from amino acid sequences with ensemble extreme learning machines
and principal component analysis. BMC Bioinform. 14(8), 1 (2013)
A Weighted Feature Selection Method
for Instance-Based Classification
Gennady Agre1(&) and Anton Dzhondzhorov2
1
Institute of Information and Communication Technologies,
Bulgarian Academy of Sciences, Sofia, Bulgaria
2
Sofia University “St. Kliment Ohrisdski”, Sofia, Bulgaria
Abstract. The paper presents a new method for selecting features that is suited
for the instance-based classification. The selection is based on the ReliefF
estimation of the quality of features in the orthogonal feature space obtained
after PCA transformation, as well as on the interpretation of these weights as
values proportional to the amount of explained concept changes. The user sets a
threshold defining what percent of the whole concept variability the selected
features should explain and only the first “stronger” features, which combine
weights together exceed this threshold, are selected. During the classification
phase the selected features are used along with their weights. The experiment
results on 12 benchmark databases have shown the advantages of the proposed
method in comparison with traditional ReliefF.
Keywords: Feature selection
Á Feature weighting Á k-NN classification
1 Introduction
Feature selection problem has been widely investigated by the machine learning and
data mining community. The main goal is to select the smallest feature subset given a
certain generalization error, or alternatively to find the best feature subset that yields the
minimum generalization error [19]. Feature selection methods are usually classified in
three main groups: wrapper, filter, and embedded methods. Wrappers use a concrete
classifier as a black box for assessing feature subsets. Although these techniques may
achieve a good generalization, the computational cost of training the classifier a combinatorial number of times becomes prohibitive for high-dimensional datasets. The filter
methods select some features without involving any classifier relying only on general
characteristics of the training data. Therefore, they do not inherit any bias of a classifier.
In embedded methods the learning part and the feature selection part can not be separated - the structure of the class of functions under consideration plays a crucial role.
Although usually less computationally expensive than wrappers, embedded methods are
still much slower than filter approaches, and the selected features are dependent on the
learning machine. One of the most popular filter methods is ReliefF [10], which is based
on evaluating the quality of the features. The present paper describes an approach for
improving ReliefF as a feature selection method by its combination with PCA algorithm.
© Springer International Publishing Switzerland 2016
C. Dichev and G. Agre (Eds.): AIMSA 2016, LNAI 9883, pp. 14–25, 2016.
DOI: 10.1007/978-3-319-44748-3_2