ESTABLISHMENT A SUBCUTANEOUS TUMOR MODEL BY HepG2 CELL LINE IN MICE TO STUDY ANTI-TUMOR EFFECT OF LIPOSOME PACLITAXEL
Bạn đang xem bản rút gọn của tài liệu. Xem và tải ngay bản đầy đủ của tài liệu tại đây (8.28 MB, 20 trang )
UNIVERSITY OF MEDICINE AND PHARMACY AT HO CHI MINH CITY
Faculty of Pharmacy
ESTABLISHMENT A SUBCUTANEOUS TUMOR MODEL BY
HepG2 CELL LINE IN MICE TO STUDY ANTI-TUMOR EFFECT
OF LIPOSOME PACLITAXEL
Research Team:
Asso.Prof. Đỗ Thị Hồng Tươi
Dr. Trương Công Trị
MSc. Trần Thị Như Nguyện
Pharm. Trần Thị Phương Uyên
MSc. Nguyễn Bá Thọ
1
INTRODUCTION
Hepatocellular carcinoma (HCC): one of the leading causes of cancer deaths (ranked
3rd for men, 6th for women) (Ferlay, Bray, 2010)
- 2007, over 700.000 cases in the world
- 2008, over 725.000 (Southeast Asia: 75.000 new cases)
- Vietnam: high percentage of HCC patients, high cost of medications (imported)
Paclitaxel:
- Antiproliferation & death induction against human HCC (in vitro);
- Combination with DOX reduced HCC tumor size (in vivo)
- Poor solubility and permeability poor bioavailability
- Liposomal paclitaxel: enhance solubility, permeability and targeting specificity
Establish a model of HCC using HepG2 cell line in mice
Study the anti-tumor effect of liposome paclitaxel formulation
2
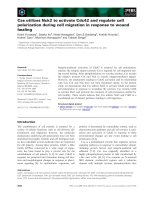
METHODS - RESULTS
In vivo model of HCC (xenograft model)
Culturing HepG2
cell line
s.c. injection
on nude/SCID mice
Treatment
Immunodeficiency
induced by CYP
Zhang et al
(2007)
Male BALB/c nude mice, s.c. injection After 10 days, tumors with diameter
of 0,1 ml (107 cells/ml)
from 3 - 5 mm
Hagiwara et al
(2007)
Male BALB/c nude mice, s.c. injection After 7 days, 100% mice had tumors
of 106 HepG2 cells/mouse
with diameter from 5-10 mm
Chen et al
(2011)
Kunming mice, s.c. injection of 10 6
HepG2 cells/mouse
16th day, 100% mice developed
tumors.
3
METHODS - RESULTS
Studying immunodeficiency-induced model on Swiss albino
CYP i.p. cyclophosphamid 100mg/kg; 0,1ml/10g
DOX i.p. doxorubicine 10mg/kg
i.p. saline
male
Swiss albino
8-10 week
32 ± 2 g
n=6
CYP
day 1
CYP
day 3
CYP
day 1
CYP
day 3
DOX
day 1
CYP
day 3
• Collect blood
from tail vein
every 1 – 2
days
CYP
day 5
• Count
leucocytes
(Neubauer
chamber)
Monitor mortality rate and ability to maintain immunodeficiency
4
METHODS - RESULTS
Studying immunodeficiency-induced model on Swiss albino
I.p. CYP day 1, 3, 5: weak, ruffled fur, slow movement, 2/6 blind. 1 dead on day 7.
Sharp decrease in leucocytes, lowest on day 6, followed by a slight recovery of
23% on day 21.
I.p. DOX & CYP: weak, ruffled fur, slow movement. 1 dead on day 5 and another
on day 6. Lowest number of leucocytes is recorded on day 5, followed by a rapid
recovery of 87% on day 21.
5
METHODS - RESULTS
Studying immunodeficiency induced model on Swiss albino
Ip CYP day 1, 3: weak, ruffled fur, normal movement, 0 dead. Total leucocytes
were lowest on day 5, then recovered by 33% on day 21.
Choose this protocol for the study of HCC induction
6
METHODS - RESULTS
Establish a model of HCC in SCID mice
CYP
i.p. 100mg/kg
Control
n= 6
(PBS, sc)
Pathology control
(iv, NaCl 0.9%)
n = 36
HCC-induced
n= 30
(HepG2, sc)
Day
1&3
5
Collect
tumors
Treatment
(5-FU, iv 20mg/kg)
12 =>16
19
Results (Mean ± SEM) analyzed by student’t test/Mann-Whitney
p < 0,05
7
METHODS - RESULTS
Establish a model of HCC in SCID mice
Day 12, visible tumors on 17/30 mice (56.7%)
Tumor size (mm3)
(Mean ± SEM)
Pathology
control (n = 7)
Pathology control
Treatment
(n = 6)
D12
9.67 ± 1.40
9.81 ± 1.60
D14
12.17 ± 2.52*
9.68 ± 1.63*
D16
15.84 ± 4.04**
7.15 ± 1.40**#
D18
17.83 ± 4.41**
4.08 ± 1.17**##
D19
17.46 ± 4.47
3.80 ± 1,10##
5-FU treatment
8
METHODS - RESULTS
Establish a model of HCC in SCID mice
d12
d14
d16
d18
Pathology control
Treatment
9
METHODS - RESULTS
Establish a model of HCC in SCID mice
10
METHODS - RESULTS
Establish a model of HCC in SCID mice
11
METHODS - RESULTS
Study the anti-tumor effect of liposome paclitaxel formulation
Ip CYP
Sc 106 HepG2 cells/mouse
Mice with sc tumors
Size mesuring
Pathology
Treatment
Positive control
NaCl 0,9%
0.1 ml/10 g
PXT-Monta 1.5
10 mg/kg
5-FU
20 mg/kg
Combination
•
•
5-FU 20 mg/kg
PXT-Monta 10 mg/kg
iv once a day, for 5 continuous days
Day 19: Tumors collecting, sample preparing, histology analyzing
Percentage of difference (%) = (Vafter – Vbefore)/Vbefore x 100
12
METHODS - RESULTS
Study the anti-tumor effect of liposome paclitaxel formulation
13
METHODS - RESULTS
Study the anti-tumor effect of liposome paclitaxel formulation
Mean percentage of size difference compare to day 12 ± SEM (%)
Groups
Day 14
Day 16
Day 18
Pathology control (n = 4)
5.9 ± 2.9
23.5 ± 6.8
44.6 ± 10.8
PTX-Monta (n = 3)
-0.8 ± 2.1
-8.7 ± 3.6
-17.8 ± 2.4
5-FU (n = 4)
-9.3 ± 2.2
-26.4 ± 4.4
-43.5 ± 1.5
5-FU + PTX (n = 3)
-14.4 ± 4.5
-33.4 ± 1.8
-53.1 ± 4.1
14
METHODS - RESULTS
Study the anti-tumor effect of liposome paclitaxel formulation
5-FU + PTX-Monta
PTX-Monta
5-FU
Pathology control
15
METHODS - RESULTS
Study the anti-tumor effect of liposome paclitaxel formulation
16
METHODS - RESULTS
Study the anti-tumor effect of liposome paclitaxel formulation
17
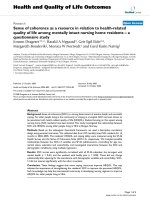
METHODS - RESULTS
Study the anti-tumor effect of liposome paclitaxel formulation
18
CONCLUSIONS
Evaluated and chose the suitable immunodeficiency-induced model of CYP 100
mg/kg, i.p. on day 1, 3.
Successfully
establish
a
model
of
HCC
in
male
immunodeficient
Swiss albino by s.c. injection of 106 human HepG2 cells per mouse.
In vivo antitumor effect
+ Liposomal PTX decreased tumor size less than 5-FU did.
+ Combination of liposomal PTX and 5-FU are more efficient in decreasing
tumor size than single therapies.
+ Histology: tumors in combination group are the most likely to have necrosis
and less likely to have cell abnormalities than 2 single therapy groups.
19
THANK YOU FOR YOUR ATTENTION
20