radar basics aaaaaaaaaaaaaaaaaaaaaaaaaaaaaaaaaaaaaaaaaaaaaa
Bạn đang xem bản rút gọn của tài liệu. Xem và tải ngay bản đầy đủ của tài liệu tại đây (3.13 MB, 26 trang )
Weather Radar Basics
RADAR: Radio Detection And Ranging
•Developed during World War II as a method to detect the
presence of ships and aircraft (the military considered weather
targets as noise)
•Since WW II, there have been many advances in radar
technology (e.g., Doppler techniques) and it’s used on land, sea,
and in space for both research and operational needs
Anatomy of a Weather Radar
Radome
Feedhorn
Antenna
Photo by D. Zrnic
Receiver
Transmitter
• Transmitter - generates the microwave signal of the correct phase and amplitude. For a
weather radar, the wavelength of the signal is ~ 10cm
• Antenna - the main purpose of the antenna (also called the “dish”) is to focus the
transmitted power into a small beam and also to listen and collect the returned signal
• Feedhorn - directs the signal from the transmitter onto the antenna (also directs the return
signal from the antenna to the receiver)
• Receiver - detects the signal returned from a target
• Radome - protects the antenna from high winds
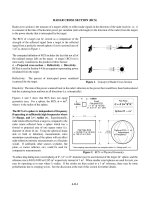
Weather Radar Scanning
For a radar to find a target of interest (e.g., a cloud), 3 pieces of
information are needed:
• Azimuth angle (direction
relative to north)
• Elevation angle (angle
above the ground)
Images on this p age made
availab le from the University of
Illinois W W 2010 Project
• Distance to the target of interest
Weather Radar Scanning
In meteorology, radars usually employ one of two scanning
techniques:
• Plan Position Indicator (PPI): The radar holds its elevation angle constant
but varies its azimuth angle. If the radar rotates through 360 degrees, the
scan is called a "surveillance scan". If the radar rotates through less than
360 degrees, the scan is called a "sector scan".
• Range Height Indicator (RHI): the radar holds its azimuth angle constant
but varies its elevation angle. The elevation angle normally is rotated from
near the horizon to near the zenith (the point in the sky directly overhead).
Images from the University of Illinois WW2010 Project
We are most concerned with the PPI scan. The Weather Service radars operate by
collecting a series of surveillance scans at increasing elevation angles. It takes the
radar ~ 5 minutes to collect the data, depending on how many elevation angles are
used. The radar then repeats the cycle.
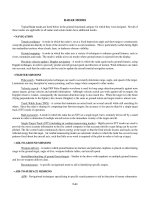
Applications of Weather Radar: National Weather Service
Radar is an important component in the arsenal of forecaster tools to
understand both the current state of the atmosphere as well as what might
happen in the near future. While satellite data gives a forecaster a sense of
the “big picture”, radar provides more detail on at smaller scales of weather.
NW S
radar
coverage
NOAA GOES Visible image 29 September 2004 20:15
UTC
NWS NEXRAD (KABX) Radar Reflectivity 29 September
2004 20:08 UTC
NWS Next Generation Weather Radar (NEXRAD) Sites
• The NWS currently
operates 158
NEXRAD sites
across the US
D. Zrnic
•Significant improvements over older weather radar systems:
• Ability to see motion of air (precipitation) using Doppler effect
• Increased sensitivity and resolution allows observation of cold
fronts, dry lines, and thunderstorm gust fronts
Weather Service forecasters use radar to help
determine:
• the movement and trend of thunderstorms
• variability and concentration of precipitation
There are two important aspects of radar that we’re concerned
with:
• Amount of energy scattered back from a target to the radar
estimate the intensity of storms and the amount of
precipitation
• Velocity of a target relative to the radar
estimate air motions and circulations within clouds
How Does the Radar Sense a Target in the
Atmosphere?
• Radars operate by sending out energy from a
source and “listening” to the amount that is
reflected (scattered) from targets
•Targets can be trees, cloud, bumblebees or
anything else the radar pulse intercepts
•Weather radars utilize frequency of ~ 3000 MHz
(10 cm wavelength) - radio waves
•The radar transmits short pulses of these radio
waves at rate of ~ 1000 pulses/s
•Each pulse is very short, lasting only about
1/1,000,000 s
Image from The USA TODAY Weather Book b y
Jack Williams
• After each pulse, there is a short
period for radar to “listen” to the
scattered signal from the target of
interest
• The scattered signal is a result of
energy from the transmitted pulse
interacting with the target (snow, rain,
hail, etc)
• A small portion of the transmitted
power is returned to the radar (the
echo), received by the antenna, and
analyzed by the radar signal
processor. Once that’s done,
precipitation rates can be determined
(we’ll talk about this in more detail
later)
Image from the University of Illinois WW2010 Project
Image from the University of Illinois WW2010 Project
Detecting Targets (continued)
The return signal received by the radar is related to the
diameter of the particles in our target echo: the bigger the
particles the bigger the amount of return signal.
It turns out that the target echo is related to the diameters of
the precipitation particles in a very non-linear way: Pr ~∑Di6
• Increase particle diameter by factor of 2 ⇒ Pr increases
by factor of 64
• Increase particle diameter by factor of 3 ⇒ Pr increases
by factor of 729
Detecting Targets (continued)
• The term ∑Di6 has a special name in radar meteorology:
reflectivity factor (Z)
• Z can take on a tremendous range of values: 0.001 (fog)
- 50,000,000 (hail)
• To compress this into a more manageable range, define
another parameter: dBZ = 10log10(Z)
• dBZ values are what you typically see on radar displays
(e.g., on T.V.)
Try this:
What are the corresponding “dBZ” values of fog and hail?
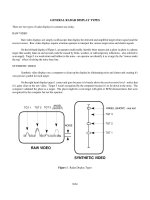
Radar Display Example
Squall line thunderstorm
Trailing stratiform region
Di
re
ct
io
n
of
m
ot
io
n
Convective line
dBZ
NWS NEXRAD (KLSX) Radar Reflectivity 10 June 2003 2305 UTC
Squall lines are made up of a number of individual thunderstorms. Although the lifetime of an
individual thunderstorm cell (identified as red areas in the radar echo pattern) may only be an
hour or so, new cells continually regenerate along the convective line and the whole squall line
system may last many hours or up to several days.
Questions to Consider
1. What do you notice about the echo pattern of the squall line?
2. Where are the largest particles (and likely the most intense
precipitation) concentrated?
3. What features in the radar echo display distinguish the
convective line from the trailing stratiform region?
4. Pick an averge dBZ value from the convective line and trailing
stratiform region and determine the corresponding Z values
Estimating Precipitation with Radar
• We saw earlier that the reflectivity factor (Z) is related
to the size of precipitation particles in the radar echo.
• If we assume that our radar echo has a known
distribution of precipitation particles (i.e., number of
drops of different size categories), we can relate the
reflectivity factor (Z) to the rainfall rate (R - mm/hr) in
our echo feature:
Z=A*RB (A and B are constants determined by the assumed drop
size distribution)
This kind of equation between reflectivity factor and rain rate is
called a “Z-R” relation
The NWS utilizes a single Z-R relation almost exclusively for
all NEXRAD radar data around the US:
Z=300*R1.4 → R=(Z/300)(1/1.4)
Now, let’s practice estimating rainfall from radar data:
1. Using our squall line example and the above NWS Z-R
relationship, estimate an average rain rate in the convective
line and stratiform regions
2. What assumption do we have to make in order to apply this
Z-R relation in different part of the squall line?
As you’ve probably noticed, the precipitation estimates from
radar data don’t always agree with rain gauges!
Meteorologists have been working on this problem for over 50
years now.
Why is it so difficult to compare rain gauge and radar
measurements?
•Besides assumptions in the Z-R relation, there are a number of other
complications:
•The radar samples precipitation in the cloud some distance above the
ground. Particles may evaporate or otherwise be modified before they hit
the surface.
•Clouds and precipitation frequently consist of a variety of particle types
(e.g., ice and rain). Each particle interacts with the radar's energy in its
own unique way.
Other factors complicating the comparison of radar and rain
gauge estimates of precipitation
• The region sampled by the radar increases with distance. The wider the
beam, the greater the likelihood of sampling a mixture of precipitation
types, or the greater the likelihood of sampled both inside and outside of
a cloud.
ice crystalsnowflake
ground clutter
hail
raindrop
wind
graupel
evaporation
Rain gauge
• Obstacles frequently block a portion of the radar beam, resulting in
an artificially high power return.
Given all the issues, why use radar to
measure precipitation?
• Radar is the only way to map
the spatial distribution of
precipitation over large areas
• Topography or other logistics
may prevent locating gauges
in many areas
NWS NEXRAD (KGLD) Storm Total Precipitation 16 May
2003 15:58 UTC
• Radar can be used as a
forecasting tool for flash
flooding and severe
thunderstorms
Measuring Air Motion with Radar
In addition to measuring the amount of signal returned from targets,
NEXRAD radar has the added capability of being able to measure a
frequency shift that is introduced into the reflected signal by the motion of
the precipitation particles. This frequency shift is then used to determine
wind speed (we assume that the particles are instantaneously moved
around by the wind).
• The amount of “shift” can be
determined by comparing
the frequency of the
transmit pulse with the
frequency of the reflected
pulse
• Particles moving toward the
radar are shifted to higher
frequency
Images from The USA TODAY Weather Book b y Jack Williams
• Particles moving away from
the radar are shifted to lower
frequency
How Much Frequency Shift Does the Wind
R
Produce?
The equation that determines how much frequency shift is
Phase shift due to target
produced by a moving target is:
ft = 2V/ λ = Doppler frequency shift of target (this
equation is derived on the next page)
How does ft compare to the frequency of the wave transmitted by the radar?
Questions to consider:
1.
2.
If the wind speed (V) = 10 m/s, what is the resulting frequency shift of the wind
(assume λ = 10 cm for a weather radar)?
How does this frequency shift compare to the frequency of the radar wave?
To figure this out, we need to determine the radar frequency:
fr = Vw/ λ, where Vw = c = the speed of light = 3 x 10⁸ m/s
Deriving the Frequency Shift of Moving
Target
Total distance traversed by pulse = 2R
Total distance in terms of λ = 2R/ λ
Total distance in radians = (2R/ λ)*2π = 4πR/ λ
Assume radar emits wave with phase = Ψ0
Return wave phase to radar = ΨR = Ψ0 + 4πR/ λ
Frequency shift (ω ) = Δ ΨR / Δt = (4π/ λ)* ΔR/ Δt
Setting ΔR/ Δt = V (velocity of target)
and recalling that Δ ΨR / Δt = ω = 2πf
ft = 2V/ λ = Doppler frequency shift of target
Examples of Air Motions Detected with Doppler Radar
• The NWS utilizes the Doppler capability of the NEXRAD radars to detect
storm circulations (e.g., tornados and hurricane spiral bands) as well as
to identify air flow boundaries created by storms (e.g., outflows and
microbursts).
• In cases when only one radar is available, the air motion that is detected
is relative to the location of the radar: radar meteorologists call this radial
velocity
• flow toward the radar is called “inbound” and flow away from the radar is
called “outbound”.
• By convention, velocities toward the radar (inbound) are negative and
velocities away from the radar (outbound) are positive.
• We’ll consider two examples for the purposes of our discussion:
tornados and microbursts
Example of a tornado observed by the CSU-CHILL radar
The image on the left (a) shows the velocity signature seen on the CHILL radar display. The white arcs
across the image represent “range rings” and show the distance from the radar to the echo of interest. The
tornado is located at the “T”, marking the boundary of the outbound and inbound velocities. Note that in this
case, the inbound velocities are so large that they are “folded” to positive values.
Because another radar was also sampling this storm, the velocities from each radar could be combined to
reconstruct the actual wind direction and speed relative to the ground. The image on the right (b) shows the
actual wind vectors in the vicinity of the tornado
(b) Velocity relative to ground (m/s)
(a) Velocity relative to CHILL radar (m/s)
T
Radial velocity signature observed from the CSU-CHILL on 29 August 2002
01:36 UTC. Negative (blue-green colors) represent flow toward the radar.
Radial velocity vectors corresponding to (a). Color contours
represent wind speed in m/s. Reflectivity contours are indicated by
the solid lines.
Microbursts
Microbursts are formed in regions where thunderstorm downdrafts are
concentrated in a very small area (less than ~4 km in width). Microbursts
can be “wet” or “dry” depending on the humidity of the air surrounding the
thunderstorm. Dry microbursts are quite common in arid portions of the
western U.S.
Images from the University of Illinois WW2010 Project