Chuong 4 3 LAP BAN DO HIEN TRANG SDD
Bạn đang xem bản rút gọn của tài liệu. Xem và tải ngay bản đầy đủ của tài liệu tại đây (3.55 MB, 105 trang )
BÀI 3:
LẬP BẢN ĐỒ LỚP PHỦ/BĐ
SỬ DỤNG ĐẤT
3.1 Hiển thị ảnh - DISPLAYING IMAGES
3.2 Tạo ảnh tổ hợp màu - CRREATING A COMPOSITE IMAGE
3.3 Tăng cường độ tương phản ảnh - IMAGE ENHANCEMENT
3.4 Phân lớp không kiểm định - UNSUPERVISED CLASSIFICATION
3.5 Phân lớp có kiểm định - SUPERVISED CLASSIFICATION
3.6 Đánh giá độ chính xác - ACCURACY ASSESSMENT
DUONG DANG KHOI
1
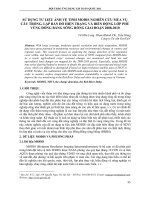
3.1 HIỂN THỊ ẢNH
- Ảnh Landsat được thu và hiển thị bằng thang
màu xám (grayscale), khi mở trong arcGIS được
liệt kê trong Table of Contents của ArcMap.
- Mỗi kênh hữu ích cho nhận biết một số đối
tượng:
DUONG DANG KHOI
2
3.1.1 Mở các tệp ảnh trong ArcMap
1. Khi giải nén thư mục tải về, ta có 7 tệp ảnh như
sau:
DUONG DANG KHOI
3
2. Mở ArcMap và mở một tệp trắng mới.
3. Chọn toàn bộ tệp ảnh đã giải nén.
4. Mở tất cả các file đã chọn như sau:
DUONG DANG KHOI
4
DUONG DANG KHOI
5
DUONG DANG KHOI
6
5. Kiểm tra các thông tin về file ảnh
DUONG DANG KHOI
7
DUONG DANG KHOI
8
3.2 TẠO ẢNH TỔ HỢP
(CREATING A COMPOSITE IMAGE)
- Ảnh Landsat thu thập và lưu dạng thang màu xám
(grayscale) và mỗi kênh được lưu trữ riêng.
- Bằng việc tạo ảnh tổ hợp, ta có thể hiển thị ảnh dạng
màu, hiển thị các ảnh theo định dạng màu RGB chp phep
ta quan sát thấy các đối tượng khác nhau trong ảnh, đặc
biệt là các nhóm đối tượng lớp phủ: urban areas, forests,
agriculture, water bodies.
DUONG DANG KHOI
9
- Mở ArcMap, mở a new map document, và mở toàn bộ 7 tệp ảnh Landsat
vào new map document.
- Thông qua kết hợp các ảnh, ta có thể hiển thị các kênh khác nhau sử dụng
khung màu RGB.
DUONG DANG KHOI
10
DUONG DANG KHOI
11
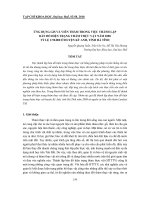
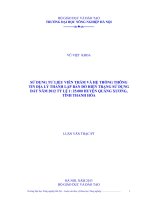
RGB:
4-3-2
HÀ NỘI
The standard "false color"
composite. Vegetation appears in
shades of red, urban areas are cyan
blue, and soils vary from dark to light
browns. Ice, snow and clouds are
white or light cyan. Coniferous trees
will appear darker red than
hardwoods. This is a very popular
band combination and is useful for
vegetation studies, monitoring
drainage and soil patterns and
various stages of crop
growth. Generally, deep red hues
indicate broad leaf and/or healthier
vegetation while lighter reds signify
grasslands or sparsely vegetated
areas. Densely populated urban
areas are shown in light blue. This
TM band combination gives results
similar to traditional color infrared
aerial photography.
DUONG DANG KHOI
12
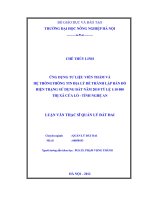
RGB:
7-4-2
This combination provides a "natural-like" rendition,
while also penetrating atmospheric particles and
smoke. Healthy vegetation will be a bright green and
can saturate in seasons of heavy growth, grasslands
will appear green, pink areas represent barren soil,
oranges and browns represent sparsely vegetated
areas. Dry vegetation will be orange and water will be
blue. Sands, soils and minerals are highlighted in a
multitude of colors. This band combination provides
striking imagery for desert regions. It is useful for
geological, agricultural and wetland studies. If there
were any fires in this image they would appear
red. This combination is used in the fire management
applications for post-fire analysis of burned and non
burned forested areas. Urban areas appear in varying
shades of magenta. Grasslands appear as light
green. The light-green spots inside the city indicate
grassy land cover - parks, cemeteries, golf
courses. Olive-green to bright-green hues normally
indicate forested areas with coniferous forest being
darker green than deciduous.
DUONG DANG KHOI
13
DUONG DANG KHOI
14
DUONG DANG KHOI
15
3.3 TĂNG CƯỜNG ẢNH
3.3.1 Radiometric Enhancement
Using ArcGIS as a Viewer for
Radiometric Enhancement
DUONG DANG KHOI
16
Transparency displays the image so you can see the
image below it. If the image below is an aerial photo,
you would be able to see and associate the various
brightness values to specific objects.
Background, by placing a checkmark in the box next to
Background you eliminate the no data value in the
display.
DUONG DANG KHOI
17
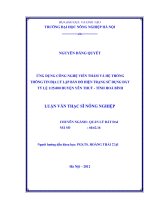
Histograms:
- Histograms plot the frequency values of the digital
numbers (DNs) (x-axis) against the number of pixels with
that value (y-axis).
- The first area where ArcMap displays histograms is in
Layer Properties/Symbology tab.
DUONG DANG KHOI
18
Percent Clip is the default; this method eliminates the minimum and
maximum values ends of the histogram based on a percent (the default is 2.00).
DUONG DANG KHOI
19
3.3.2 Spatial Enhancement/Spatial Filtering
- Tăng cường ảnh dạng radiometric enhancement hoạt
động dựa trên từng pixel, spatial enhancement làm việc
với nhiều pixel lân cân (deals largely with spatial
frequency and modifies pixel values based on the values
of its neighbor pixels).
- Tăng cường không ảnh (spatial enhancement) của
ArcGIS là bộ công cụ Image Analysis và Spatial Analyst.
DUONG DANG KHOI
20
a. Với Image Analysis
- Nearest neighbor – the pixel is assigned the value of
the cell closest to it.
DUONG DANG KHOI
21
- Cubic convolution creates a sharper-looking image.
- Bilinear interpolation creates a smooth-looking result.
- Majority - the pixel is assigned the most common
value within a specific filter window, smoothing the
image
DUONG DANG KHOI
22
b. Với Spatial Analyst Tools
DUONG DANG KHOI
23
Sử dụng Filter
và Focal
Statistics
DUONG DANG KHOI
24
Filter can be low pass and high pass. Low
passsmoothes and high pass enhances edges
DUONG DANG KHOI
25