The Use of Diuretics in Acute Kidney
Bạn đang xem bản rút gọn của tài liệu. Xem và tải ngay bản đầy đủ của tài liệu tại đây (2.23 MB, 39 trang )
The Use of
Diuretics in
Acute Kidney
Sean M Bagshaw, MD, MSc
Division of Critical Care Medicine
University of Alberta
Disclosure
1.Consulting:
1.Alere, Baxter, Gambro,
Spectral Diagnostics, Otsuka
2.Speaking:
1.Alere, Gambro, Otsuka
Background ~ Loop Diuretics
1.“Established AKI” in critical
illness
1.Few (if any) interventions
2.Supportive
2.Many interventions require
evidence:
1.Better quality (i.e. randomized
trials)
2.More applicable
Background ~ Loop Diuretics
Furosemide
• Act in TAL LOH
• Inhibit Na-K-Cl
carrier
• Compete with Cl site
• Reduce net reabsorption
– Na, Cl, K, Mg, Ca
– H20
• Action dependent on
delivery to site of
action:
Tubular
Lumen
Peritubular
Capillary
Rationale for Loop Diuretics
1.Direct renal vasodilator
3.Attenuate medullary hypoxia by
inhibiting Na+/K+/2Cl- pump to
reduce tubular O2 demand
5.Attenuate ischemic/reperfusioninduced apoptosis and associated
gene transcription
7.Mitigate fluid overload/accumulation
Kramer et al KI 1980; Aravindan et al Ren Fail 2007; Aravindan et al Ren Fail 2006; Grams et al CJASN 2011
“Unload” the Stressed Kidney?
1.Acute renal failure = “acute renal
success”
2.↓ in GFR (mediated by TGF) = ↓
reabsorptive work
1.Preserve renal O2 supply/demand +
medullary oxygenation
2.Mitigate ischemic/hypoxic injury
3.If protective - why do we apply
strategies to ↑ GFR?
Thurau et al Am J Med 1976
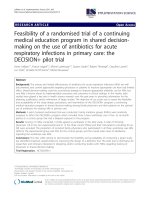
Variable
Control
Furosemide p-value
Cardiac output (L/min)
Mean arterial pressure
(mmHg)
Renal plasma flow (mL/
min)
GFR (mL/min)
5.6
80.2
802
89.1
6.1
80.6
779
78.5
<0.001
NS
NS
<0.001
Na reabsorption (mmol/
min)
FeNa (%)
Urine flow (mL/min)
RVO2 consumption (mL/
min)
O2 extraction (renal) (%)
12.0
1.8
2.4
11.1
10.5
7.7
29.4
23.3
7.9
8.5
<0.001
<0.001
<0.001
<0.001
<0.05
Sward et al ICM 2005
Per mmol Na reabsorbed: 1.9 mL O2 in AKI vs. 0.82 mL O2 in Control
(2.4 x higher)
Redfors et al CCM 2010
Per mmol Na reabsorbed: 1.9 mL O2 in AKI vs. 0.82 mL O2 in Control
(2.4 x higher)
Redfors et al CCM 2010
•
Secondary retrospective analysis from
the Project to Improve Care in Acute
Renal Disease (PICARD) database:
•
Population: 552 (64%) critically ill patients
with AKI (defined as BUN>40 mg/dL,
sCr>2 mg/dL or sustained rise >1 mg/dL
above baseline)
•
Intervention/Exposure: Diuretic use at
any time in 7 days following nephrology
consultation
•
Outcome: Death, non-recovery,
Mehta et al JAMA 2002
Diuretics were used in 59%
(n=326)
Diuretic Given
on Day 1
Furosemide
Bumetanide
Metolazone
Hydrodiuril
Loop +
Thiazide
n (%)
203
106
106
13
105
(62)
(58)
(33)
(4)
(32)
Dose
(med
th])
[10-90
80 (20-320)
10 (2-29)
10 (5-20)
-
Diuretic
(n=226)
No
Diuretic
(n=326)
p
53.8
(18.0)
30
(13)
<0.01
History of CHF (n, %)
58.1
(17.1)
87
(27)
Nephrotoxic (n, %)
61 (19)
28 (12)
0.05
143 (64)
0.01
Variable
Age (yr)
Respiratory Failure (n, %) 241 (74)
<0.01
Cardiac Failure (n, %)
148 (45)
75 (33)
<0.01
BUN (mg/dL)
61.6
(34.6)
3.6
(1.9)
72.3
(43.4)
4.1
(3.3)
<0.01
sCr (mg/dl)
<0.01
Mehta et al JAMA 2002
Variable
In-Hospital
Mortality
Non-Recovery
Composite
Composite
(Ever/Never,
n=416)
Propensity
Crude OR
-Adjusted
(95% CI)
OR
(95% CI)
1.37
1.65
1.68
(0.97-1.92 (1.05-2.58) (1.06-2.64)
)
1.53
1.70
1.79
Adjusted
OR
(95% CI)
(1.08-2.15 (1.14-2.53) (1.19-2.68)
)
1.48
1.74
1.77
(1.02-2.12 (1.12-2.68) (1.14-2.76)
)
2.01
3.15
3.12
(1.26-3.20 (1.74-5.62) (1.73-5.62)
)
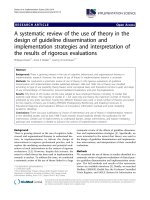
Furosemide dose-equivalent (mg/mL urine output/
d) as surrogate for “diuretic responsiveness” –
median 0.34 mg/mL
DE (dark circle) > 1.0 mg/mL – OR 2.94
(1.6-5.4)
DE (triangle) < 1.0 mg/mL
– OR 1.15 (0.8-1.7)
Mehta et al JAMA 2002
Mehta et al JAMA 2002
“The risk was borne
largely by patients who
were relatively
unresponsive to
diuretics”…
and this
Mehta et al JAMA 2002
1. Secondary
analysis of the Beginning
and Ending Support Therapy (BEST)
for the Kidney database:
1. Population:
1,731 critically ill patients with
AKI (defined by: need for RRT; BUN>86 mg/
dL, K>6.5 mmol/L; oliguria <200mL/12hr;
anuria)
2. Intervention/Exposure:
study enrolment
3. Outcome:
Diuretic use after
In-hospital death
Diuretic Use
Any diuretic use
Furosemide
Other loop diuretic
Mannitol
Metolazone
n (%)
1,117 (60.8)
1,098 (98.3)
29 (2.6)
22 (2.0)
19 (1.7)
Spirolactone
18 (1.6)
Thiazides
14 (1.3)
Other
14 (1.3)
Variable
Diuretic No Diuretic
(n=1,117)
(n=626)
Length of ICU stay
11 (5-22)
9 (4-20)
Length of Hospital
stay
ICU Mortality (%)
23 (12-45)
21 (9-44)
53.4
48.2
62.4
57.1
32.7
38.2
Hospital Mortality
(%)*
Discharge Dialysis
Mehta et al JAMA 2002
In-Hospital Mortality
OR (95% CI)
Model 1 (Mehta et al)
1.21
(0.96-1.50)
1.22
(0.91-1.60)
1.22
(0.92-1.60)
Model 2 (Propensity)
Model 3 (Multicollinearity)
Uchino et al CCM 2004
PICARD/BEST Studies
1.Caveats to consider to these
studies:
1. Observational → Confounding
2. Selection/information bias
3. Severe/advanced AKI at inclusion
(sCr>3.5)*
4. No data on specifics of fluid
resuscitation
5. No data on fluid overload/
accumulation
6. No data on timing of diuretic use
Bagshaw et al Crit Care Resusc 2007
Mortality
Time to Normalize Creatinine/Urea
Time to Normalize SCr/Urea