MICHAEL s JENKINS the geometry of stock market profits a GUIDE TO PROFESSIONAL TRADING FOR a
Bạn đang xem bản rút gọn của tài liệu. Xem và tải ngay bản đầy đủ của tài liệu tại đây (23.14 MB, 160 trang )
~~
Table
Biographical
or Contents
Sketch
5
Acknowledgments
6
Preface
7
Chapter 1
- lntroduction
Chapter 2
- Why
Chapter 3
-
to Cycles
Technical Analysis
15
18
Charts
25
Chapter 4- Theory of Geometry
30
Chapter 5
- The
Chapter 6
- Proportion
Chapter 7
- Trading
Basics
65
Chapter 8
- lmpulse
Waves
76
Chapter 9 - Trading Options
82
Chapter lO - Cycles
97
Hourly Chart
48
and Harmony
Chapter 11- What is a Professional?
Chapter 12
- Professional
Chapter 13
- Common
Trading
60
108
113
Sense Trading Rules
117
Chapter 14- Ten Trading Tips to make you Rich
124
Chapter 15- Comments on Fundamentals and Economics
147
Epilogue
149
Appendix
- Trader's Check List
151
Trader's Daily Worksheet
153
Exhibits
154
13
~
~==~C~i-
,:_1
~
--
T
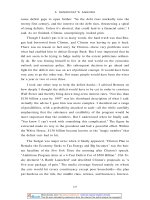
Chapter#1
Introduction to Cycles
"With ali oJ these(cyclical)findings, why is it so hard
Jor man to believethat perhapshis buying and selling oJstocks
and bondsmay not be rational behaviorafter ali?"
Sincethebeginningsofrecordedhistory,mankindhasdebatedtheagelessphilosophicalquestionsof
destinyandfatalism,andman'ssupposedfree will to createhis own individuallife cycle. Natural
catastrophes
andlargescalewarfarehaveoften beenthe philosophicalcatalystsin fonning this debate
of whethermanactuallyhasfree will in determininghis destiny.
In thenaturalrealm,animallife waslong knownto exhibit life cyclesof consistentregularity,and
fishennanandfur trappersoften recountedtheyearsof abundanceor scarcityin their harvests.Cycles
of draughtsandfaminesafe well known to ali farmersandworkersof the landandweatherprediction
hasbecomea moderoday scientificmarvel.Prior to the foundingof theFederalReserveSystemand
centralizedbankingin this country,financialboomsandbustswereregularrecurringphenomenon
far
aver a century.The Rothschildsof Europefar yearsmadeuseof the recurringeconomiccycle of 41
monthsto buy andgelI,andwereheld in aweby the lesscyclically educatedbecauseof their seemingly uncannyability to pick thehighsandlows of theeconomiccycle.
In the ancientworld, fascinationwith theheavenlybodiesat Ieastmadethe massesawareof possible
cyclical influencesin their Iives,althoughfatalismandsuperstitionpreventedanyreal seriousstudy
excepton a Iimited scale.Religiousbiasandpersecutionoften hinderedthe studyof cyclical detenninantsof humanbehaviorespeciallywhenrecurringcrop failuresanddroughtscould beof betteruseto
politicians within the religiousgoveroingbodies.Almost alI rulersboth secularandreligioushad
appointedsoothsayers
andastrologersto provideofficial explanationsfar cyclical eventsthat might
rouseup the masses.Evenin the moremoderoage,perhapsthegreatestmentalgiant thateverwalked
the earth,Sir IsaacNewtonwasthe official court astrologerandpersonallydefendedthepracticewith
greatzeal.
In the moderoagerigid political andacademicidealogiesconstantlypersecutecyclistsandfatalistsin
arderto maintaintheir power structuresevenin thefaceof moderoscientificevidenceof an overwhelmingmagnitude.Tacitacknowledgment
of thecyclical natureof theeconomyis theunderlying
principle of Keysenianeconomicplanning,wherebythepoliticiansdecideto spendmoremoneyin
badtimesto stimulatetheeconomywhenthenaturalconsumercycle is sluggish.It is a shamethatthe
15
I
~I
,::
politicians seemto think that everyday things afe bad enough to need their omniscient stimulation.
Wall Street, although one of the last bastions of real freedom and economic choice, has had a hard
time dealing with the rise of"cyclical investing methodologies" since thesedo not intellectually lend
themselvesto generating ever more salescommissions on a daily basis. Who wants, or needsa Wall
Street stock analyst if the cycles say stocks will decline for the next year or even more?
In the final analysis, the human being is primarily a rational being. At least he Thinks he is. Objective
observation of human behavior would seemto indicate, however, that he is largely emotional by
nature, and the more emotional he is the less it has to do with rationality.
Modem sciencehas discovered biological clocks, circadian rhythms, estrogen and endocrine rhythms,
sleep cycles, sunspot cycles, blood chemical cycles, cosmic rhythms and a multitude of others too
numerous to even mention. Most of theseafe what we would term extemal determinants,even though
they afe found often intemally, as opposedto rational thinking determinants.With ali ofthese findings,
why is it so hard for man to believe that perhapsbis buying and selling of stocks and bonds may not be
rational behavior after ali?
1:
ij
~
U
""
I
I
aver the years I bave come to the conclusion that there afe only four major motivating influences in the
world. These afe money, sex, power, and religion. The perfect example oralI ofthese is the V.S.
CongressoOften ali four will be excessively exhibited by individuai members of Congresso
The stock market of course has to do with money and I would hypothesize that the smartestminds in
the world that afe motivated by money either afe found on Wall Street or in Las Vegas.Why is it, that
many of thesegreat minds afe not so successfulin cracking the secretof stock price movements?I
firmly believe it has to do with rational minds trying to battle emotional problems. What people buy
and seti has very little to do with what they say they afe doing (rationalizing) but more with what they
feel. My work conclusively shows that thesefeelings afe CYCLICAL.
i
The intellectuals bave been attacking the problem with a rational understanding which is bound to fail.
The problem is akin to the millions of people who go on diets to lose weight. Billions of dollars bave
been made by selling books on diet fads, vitamins, and exercise, and knowledge about losing weight is
readily obtainable by everyone. But who actually loses weight and keeps it ofr? The answer lies in
j
emotional behavior not rational knowledge.
r
j
l'
i
The solution to the stock market mystery is to use our rational mind to develop a rational plan to
control our emotions in buying and selling. CYCLES ARE TUE KEY. If one merely believes in
extemal cycles controlling our behavior, and usesa rational game plan to invest with that cycle, he
will become a successoNotice that it is not necessaryto prove that cycles even exist for this to work.
This is merely a mental construct that will conveniently allow us, as rational beings, with tremendous
perceptional blockages, to battle our emotions effectively when buying and selling.
It is not my purpose to tell you the CAUSE of cycles in this book. My approach is only to give you
techniques to discover cycle rhythms and pattems, so you can gain mastery over the most difficult part
r
"
16
I
i
~ I~_I
'li
!
,
-
l;'
~
~.
--~
of professionaltradingfar a living... pulling the frigger with a cool headandextremeconfidence.As
you go throughthis book,pleaserememberthatcyclesdo exist,andif we do not cloudour understanding with needlessrational"reasons"why suchandsucha stockmustgo up or down, we will be much
betterocr.I will feel that my efforts weresuccessfulif at the endof readingthis book andpracticing
thesetechniques,you throw awayyour newspapers
andanalyticalreportsthat serveasyour rational
crutchesfar your emotionalbehavior,andyou find yourselfslightly humbled,beingmerelyanemotional humancreatureandnot sosmartafterali.
;"f ';,';f::l.;ij !, !:
17
-
...
Chapter #2
Why TechnicalAnalysis?
"Ailiosses in the market afe entire attributable to
noI investing with the primary trend."
For manyyearsmarketobserversbave arguedoverthe meritsof variousapproaches
to investingin the
market. The two most widely acceptedschools existing afe the fundamental and the technical.
"
"
.ii:
The fondamenta. 8nnro8ch utilizes an analysis of broad economic factors, so called "fundamentals,"
in an effort to predict the earnings growth and industry trends for stocks, in the belief that a rising
earnings trend in a generalIy improving economic situation, to which the stock belongs, wilI sooneror
later result in a rising price for that stock. Practitioners of this fonn of investing wilI tell you that the
stock market cannot be predicted, except within a generaItrend of economic events. These fundamentalists usualIy detest technicians.
'J
I
"
Many of the most successfulstock investors of the past fifty years bave been fundamentalists, who
believed in a buy and hold strategy of investing in common stocks. This strategy worked welI as the
V.S. economy and the stock market grew secularly and dominated the world economic scene.I bave
'I
seriousdoubtsthat thenext fifty yearswilI showa continuationof this sameAmericanseculargrowth.
':'
i,
':t
In retrospect those buy and hold players may bave been simply lucky that the long tenn trend was up.
The approach I favor to investing in the market, and what I believe to be the only valid intelIectualIy
~
I
,
sound method, is the technical approach.
i
The technical 8nnroaches' basic philosophy is that alI economic, fundamental news of any significance is always reflected in the price and volume characteristics of a stock long before the economic
improvement or deterioration is known to the generai public.
IntelIectualIy this has to be, since at the most basic leveI of the company, the chainnan of the board and
.-
members of the board of directors, ali know the outlook for the industry and their stock in particular,
long beforeobjectivepublic evidenceis available.Thesepeopleafe lifetime specialistsin their field
1.
:
and must bave infonnation far better than any WalI Street analyst. Therefore, when a significant economic event occurs, these insiders know immediately whether their stock is relatively cheap or dear,
and buy and sell it accordingly to the utmost available amount of their resources.It is their buying and
selling that leaves its tell tale tracks on the ticker tape for the technical analyst to spot and to evaluate.
No stock makes any significant rise or fall overnight, only through the day after day accumulation or
distribution of sharesin the open market.
:
18
':
~~---
--
~
~
Assumingfar the moment,thateventheboardof directorsof a companyafecompletelyunawareof a
fortuitouseventin thecompany,andanoutsidefundamentalanalysthascorrectlyevaluatedthesituation, the technicalapproachis stili the only valid intellectualapproachfar investingfar the following
reasons:
- It is buying andselling of a stockwhich makesit go
up or down andgivesit anyeconomicvaluefar the
investor.Earningsmayskyrocket,a companymaystrike
oil or gold, buy if someone,somewh~ith
money,
doesnot bid up theprice of the stock,thensuch
fundamentaldevelopmentsafeof little worth to the
capitalgainsstockinvestor.
-The technicalapproachwill alwaysrevealthe direction
of a stocks'movementtram thevery first instantof its
move,andthe abletechnicianwill alwaysbe long a rising
stockandshorta falling stock,retore thereasonfar its
rise of fatI becomesapparent.
The secretto stockmarketinvestingwasoncestatedby Will Rogerwhenhe said, "One shouldbuy
good stocksthat go up and if they don't go up, don't buy them."
Although this quoteis somewhatfacetious,in logic, it is exactlywhat thetechnicalapproachis ali
about,identifying stocksthat afegoing up or onesthat afegoingdown. AlIlosses in themarketafe
entirely attributableto not investingwith theprimary trend. This shouldbe our only goal asspeculators or investors--identifyingtheprimarytrend.
Now Jetus review the basiccycle of a stock'srise andfallo At the end of a BearMarket or economic
recession,stockssell at very cheap,low levelssincemostpeoplehavesold out andno longeranticipateanyfavorablenewstram thecompany.If thecompanyis not goingbankrupt,but continuesin
businesstherewill comea point whenthedaily volumeof transactionswill dry up to practically
nothing,at a price low enoughthat alI reasonablelong term investorsthink is fair value,andat a level
that theinsidersconsidercheap,relativeto the futureoutlook of thecompany.
Executiveswho plan to spendtheir whole working lives in a particularventure,usuallyknow when
conditionsafe at rock bottomandcanonly improve. It is at this point that the processknownas
"accumulation" startsto takepIace. Day afterday the insiders,their relatives,their familiesanda
few outsideanalystsstartto buy the stock.
At first, the stockwill only movean eighthor so,asthereafe usuallymany sellersuntil aroundat
slightly higherprices. But after a period of weeks,evenmonths,mostof the overheadsupplyof
stockfar salehasbeenaccumulatedby theselong term insiders.
19
r
~
This class of investor is very long tenn by nature, thinking in tenns of the industry economic cycle.
They do not plan on selling the stock bought today for a few dolIars more when it wilI be higher next
week or next month, but rather several years down the road, at retirement, or when the economic cycle
seemsto have peaked and the stock has very likely doubled or tripled.
Since these long tenn investors have accumulated the available supply of stock for sale, effectively
taking it off the market for several years, only new selIerscoming into the market wilI be able to make
the stock decline in price.
As this process of accumulation ages,the price of the stock, which at first creepshigher with small
gains, then begins to fluctuate much more violently, and finalIy, literalIy explodes upwards from the
day after day buying when fewer and fewer sharesafe available for sale.
Near the top of the cycle, after the stock has been rising for quite some time, the stock becomesvery
thin and a very small amount of buying can greatly move the price of the stock upwards. This is a
natural, psychological phenomena.At that point, alI holders of the stock have a profit on their position,
and psychologicalIy feel that they have been right alI along and that the stock wilI go higher.
NaturalIy, feeling this way, they do not want to sell the stock now, even more than before. Soon the
natural forces of greed take hold and these investors, who feel that they afe "so right", increasetheir
buying to include bank borrowing and margin purchases.At the top ofthe cycle this reachesan extreme, and the originai insiders decide to sell some of their holdings.
I
I
Thisat first merelycheckstheriseof thestockbutdoesnotsendit down.Onlylaterwhenthemargin
interest expensespile up and the stock stops moving do others start to sell and the "distribution
phase" now begins.
Often the insiders wilI not only sell their own holdings, but since they feel the economic cycle for that
company is near a peak, they wilI sell more company stock to the public in an effort to capitalize on
easy money financing for the future. As soon as the stock becomes"waterlogged," it begins to go
down and each successivelower break brings in more selling.
As in the Bible, the phrase "Iike begets like" applies equalIy welI to the market, as buying wilI attract
more buying and selling wilI attract more selling. (Specialists on the floor of the exchangeknow this
welI and raise and lower their quotes alI day long according to this principle). On the way down, the
stock also becomesthin, as the generaI consensusis reached where most people have become bearish
sellers and the buyers afe price cautious.
Near the lows, the volume increasesuntil the price reachesa value leveI that the originaI insiders feel
representstrue value, and then step in and buy alI the stock being soldoAfter this, the volume dries up
and the stock goes donnant, awaiting the next anticipated uptum in the economic cycle.
l
20
I
~
I
t
""","""J.IP
I
~
~
r
It is the tools of technical anal}:sis which identify the various phasesof the accumulation, distribution
lire cycle and allows the speculator to capitalize on thesemovements. Remember we afe talking
cycles bere, and our emphasis will be on identifying where we afe in the cycle, so that we can determine the main trend and invest accordingly.
It should be noted however, that the averagetime far the accumulation, distribution cycle can be as
short as a year or in some casesextend upwards or downwards to ten years and in some caseseven
thirty years.
In those situations it is accomplished within the frame work of what we cali a "0011 Market" far the
accumulation phase,and a "Oear Market" far the distribution phase.Most Bull Markets this century
bave
lasted3 to 5years with BearMarkets 1 1/4to 3 years.It is to be emphasizedthat the Bull or
Bear Market characterization applies to DsvcholoRicai orocessesor emotional c!cles and not just
periods of time when prices rise and fallo It is these psychological processesthat help us identify what
cycle realIy is operating. There afe many elements of each cycle and they afe not of utmost importance
in a work as technical as this but bere afe a few.
In the "0011 Market" expect to find easycredit, increasing margin buying, increasing public participation and rapid and easy upward price movement. Bad news is ignored and corrections against the
primary trend seldom last more than six weeks. The economic backdrop is coming out of a recession
with strong economic growth, and the economy is throwing off lots of excesscash flow tram business
profits to fuel the ever higher price movements. People afe stilI used to the past, tough economic times,
and this usualIy creates the "wall of worry" of stock prices.
In the "Oear Market" phasewe find that confidence is stilI high tram the Bull Market excessesand
the attitude of "boy the dip" is prevalent. Economic statistics deteriorate, but most analysts calI far a
reversal any day now. Margin is being liquidated, credit is tight, rallies afe short lived but very
powerful, and the economy is "socking" cashout of the system to finance inventories, debt etc.
In cycle analysis, we must remember to try and get a "reel" far the cycle, and the above generai
characteristics, although somewhat subjective, wiII at least point us in the right direction. In final
analysis, only one consideration is of importance--if the stock goes up or down.
If one were to describe in simple terrns how a rising stock behaves,one would seethat in arder to
maintain an uptrend, a stock must aver time, reach higher price levels both on each ralIy and on each
subsequentdecline. Each low far the correction would be higher than the previous correction low.
This is referred to as making "higher tops and higher bottoms." The same is true in reversefar
declining stock patterns. For a stock to show a down trend it would make a series of lower lows and
lower highs.
In evaluating the strength and duration of a move, one must keep bis investing horizon in perspective.
- LoDa term
investors
- wiII only be concernedwith correctionlows
that hold above long term prior lows, such as the prior year's low,
21
J
the prior quarter's low or the previous month's low.
i
.li
- Short term investors - will pay close attention to the prior weeks'
lows, to watch far violations.
- AKKressive dav traders - will watch each daily high and low but
usualiy the past three days' trading range is most important.
In analyzing this, pleasekeep in mind the natural rhythm of the movement. Price patternsrepresentthe
aver abundanceof either buyers or sellers on a daily, weekly, monthly, etc. basis, and these forces
react on a ticker tape much like the natural torce of the tide at the beach.The following analogy should
"
l'
be studied until it is firmly understood.
The first lime beach visitar is not usually aware of the tide but only
noticestheboundaryline of thewavespoundingon theshore.Aftera
while, he would notice that some waves are more powerful than others
and subsequent reach further inland.
";,
-,~
'B(
"',
~-,,-",
c-'.,!:;i;""
c':,
?,:~~
~,~::1~
.~~
."",;"
,,'"
,,',
.
',"...
he gets a chair and sits just past the waters edge, he would notice aver
the next few hours that the generalline of demarcation between the shore
and water, moves inland or recedesfurther out towards the sea.
If
If our first lime beach visitar is observant enough to lime the ri,\'ing tide
patterns, he would see the ever increasing inlandpenetration ofwater: He
may now become alarmed, thinking that eventually the tide win swallow
up the beach, threaten the local beach houses and eventually the town.
r
Our nervous beach visitar may now try to measure the rate of advance
between each thrust ofthe waves, by marking the extreme penetration with
perhaps a rock or ,\'tick and thereby begin to calculate the lime when the
water win reach the adjoining houses.He would note, that eventually the
tide stops advancing, stays level at a certa in marker, and then starts to
withdraw. At first, this would seem like an anomaly which would grant
a short reprieve to the beachfront property owners, and our observer
would stilI assume that the next wave, or perhaps one or two after that,
~!i:'!
"'
would Jet go further inland.
~"
After spending more lime observing, our visitar would begin to see that the
tide i,\,leaving, and never having experienced that belare, may now
conclude ju,\'t the apposite, that the beach will be getting permanently
larger and larger:
This analogy with tides and stock market movements is very close, and has fascinated market technicians far generations.The wave patterns ofbuying and selling stock seemsto indicate a human psychological tide of emotion, that varies in amplitude and intensity, manifesting as greed and fear.
,.
i
ì
22
~
~r
This pattern of stock prices can then be analyzed to one's financial betterrnent, if ODeis only willing to
make the assumption that this analogy is true and invests accordingly, without inferring subconscious
fear, or intellectual bias in the processo
If this analogy holds, we should be able to benefit by making observations as to each wave thrust, how
high it goes and the resulting pullback. Then we anticipate the next thrust by buying on the receding
pullback and seeing our stock surge aheadalmost immediately, rewarding our scientific methodology
with a better rate of return aver time.
Whether or not this analogy is true is irrelevant, becauseno stock can go up without making higher
highs and higher lows, and such analysis will always keep ODeout of trouble, as it is lossesthat afe
the problem in investing. So deterrnining the main trend is the only thing.
It is the tools of technical analysis that help us to measurethesetrends. The long terrn fundamental
investor invests with the rising tide, but there is nothing to enhancebis position throughout the entire
movement and he must wait to sell at the end. The technical trader, on the other hand, can achieve
much greater results by selling at each extreme thrust, and reentering on each receding decline and
picking up a few extra dollars on each attempt.
I equate the fundamental approach to that of a blind man at the beach. He hearsthe tide and makes a
generai observation about its direction and movement, but he cannot spot each little thrust and recession and be able to time the next movement. A sharp-eyedscientist on the beach would be able to
measurequickly and get a senseof the rhythm of each internai movement, in addition to the rhythm of
the large crashesheard by the blind mano
Only now do we seethat the definition of the main trend of higher highs and higher lows far advancing
prices, and lower highs and lower lows far declining trends, will keep the observing technician
invested with the main trend of the market.
Like the analogy of the blind man at the beach and the scientific visitar with sight, investors cannot
possibly hope to accurately discern patterns of accumulation and distribution of stocks, unless ODehas
in bis possessiona chart or graph of the stocks' activity aver time.
Remember,it is the daily buying and selling, the price levels and volume fluctuations, that subtly
reveal the sophisticated operations of insiders and large institutional investors whose immense power
make the stocks rise and fallo
Investing without a record of the price and volume, is investing on hope, and ODewho invests solely
on hope is bound to be disappointed before too long. Most investors can readily obtain weekly charts
and subscription services at reasonableprices. However, far the casual investor who only trades rive
or six issues,he should be able to construct and maintain bis own charts within a few minutes each
day.
23
..,-.,."'
~
,
"
"W
'"
Although, I personally prefer charts becauseODecan easily discern simple patterns and thus project
future price movement, basedon the symmetrical patterns ofthe past, ODeneed not use pattern recognition to invest successfully. The basic necessity,is simply a log of each price swing high and the
preceding and subsequentprice lows, along with the daily volume. The investor then merely sells out
whenever a prior low is broken and remains long as long as those lows hold.
A breakout to a new high would indicate that a move up to even higher highs is likely. This method
has been used successfully far generations, and even the famous lesse Livermore used such a rudimentary log of price levels to keep track of the main trend.
A log is necessarybecausememory is short and often a stock can remain dormant within a trading
price range until most investor forget the stock. It is then very important to have a record of prior
highs and lows so as to know when the main trend will be resumed or reversed.
,
I
Ournextchapterwill discussthevariouschartsODe
shouldkeepandwhy.
j
I
:"
I
/
è','
!
:
:.';: .
:j:' j
l~!!~~; :i-
24
-,-
.
~
~
Chapter #3
Charts
...
"All buying and selling is reflected in the history
o/ prices volume and dates o/ such movement."
Basic Charts afe of several types:
1. Bar Chart - the normal chart, where each price is graphed with price on the vertical column and
time acrossthe bottom. Volume is usually indicated by verticallines along the basetime line.
2. Point and FiKure CharL~ - no time or volume is recorded. Point and figure charts presumethat only
price is important since that is what determines gaio or tosso
Point and figure charts record reversal in price, usually with a series of X 's, one on top of the
preceding, as long as the price of each high exceedsthe preceding high, and during declining
periods a series of vertical declining O's afe started.
The chart reader can instantly seeif the rising X's afe greater and more numerous than the declining
O's and then seeif the trend is rising or falling. Since thesepatterns say nothing about time, they can
often wear out the patience of investors who seethe stock in an up trend, since no low has been
broken, but the stock may trade sideways for years and stili appear to be in a rising trend.
It is therefore hard to compare relative performance of one issue versesanother, since the
investor 's primary interest is in rate of return over time annualized and not just absolute return.
A stock that goes up 50% in 50 years is not the sameas one that goes up 50% in 50 days, and yet the
point and figure charts could look the same.Point and figure charts afe good when making an
initial analysis in picking stocks as its history is easily summarized.
3. LoKarithmic CharL~ - charts drawn with prices over time but the vertical price scale part of the
chart is graded logarithmically. This means,that each grid up on the scale is not an equal dollar
price, but an equal percentagemove from the last baseprice.
These charts afe helpful in that a trendline drawn on such a chart connecting lows will show a
growth rate such as 20% a year compounded since each move up is an equal percentageof the
tastoIf the same slope trendline plotted on a long term logarithmic chart was drawn on a regolar
25
--
,.
nonnal chart with equal price increments, it would appear to be an upward parabolic growth curve.
Since we are investing for rate of retum, thesecharts afe excellent in comparing various stocks that
trade at different price levels. For example, to compare a $15 stock with an $80 one, trendlines
of the same slope will show the samerate of retum.
Investors can be easily deceived into thinking that an $80 stock going up $10 to $90 is better than a
$15 stock going up to $18. When in reality, the first is retuming a 12 1/2% yield and the second, a
20% yield. On a logarithmic chart the 20% retum would easily be seenas a steeperslope trendline.
4. H Ibrid Price Volume Char~ (Eoual Volume charts) - theseafe various charts that encompassthe
volume traded each day with the price movement so as to make a visible interpretation of volume
price relationships easier.
For example, volume chart users use a very fat bar on a day when volume is large, and a thin bar
when the volume is small. The height of the bar would be the same,the price range fluctuation
would be identical, only the volume would be different.
In theory, accumulation pattems show volume rising with prices rising and volumes falling as prices
easeinto the correction periodoOistribution pattems, selling or declining, show volume increasing
on down days with light volume on rally days.
,i
5. .Iaganese Candlestick Char~ - thesecharts have been around in the East for hundreds of years.
iJ'
Theytry to visuallyrelatetherelationship
of theo~eninghi~h,low,anddailyrangewith t?eclosing
.:t:c
L
l!
level. For many people, these colored bars afe easler to notlce when changesafe developmg. The
pattems can be quite complex and I would recommend that you get a good book on the subject if you
afe just leaming. However, your effort will prove to be quite rewarding.
~
I usually recommend that traders use nonnal charts with price, time, and volume since other charts
can be derived from the infonnation therein. Serious studentscan reconstruct the pattems on one
chart into ali the other kinds of charts visually in their heads.
So now, with our preliminary starting point of the natural wave trend analogy and the belief that ali
buying and selling, regardlessof nature or reasonthereof, is reflected in the history of price, volume
and datesof such movement, and with our charts showing such history, we are now ready to develop
an objective, scientific analysis of stock prices to seehow money can be made with such knowledge
and losses avoided.
26
-
i
~..
~
~'
Chan Councsy of
Daily Graphs
l.Ds Angeles, Califomia
;.;.ti,-:,J::':."f'" ",.c,cc
""",.:"."",.:,..,
...cc
"""'-"T""
""-,""'SI2"2;;2"'2'~7"2'2"""2S2"
'o
,.,.,.I!;I.,.
C
JAPANESE CANDLESTICK
Apt
""
J",
...,
CHART
.
Aug
,.95
;lm!~~'
27"°17
Chan counesy of
Commodity Trend Servi ce
Palm Beach, Florida
27
~
i
~~!:i1
,-",
"\
-:
'j,
.
,
3103
2752
Dow
Weekly Data 12/12/14
2441
4% X 2 Point & Figure (VV-7 O)
Jones
- 1/26/90
(Log Scale)
Industrials
O/lS/a7
2722..2
1
2165
1920
1703
POINT AND FIGURE CHART
~;~g
1188
2/00/55
1/12/73
1054
.".1"
10"'70
~i~
r
r!!g~S
:~~
455
513
9/03/20
403
381.17
358
31"'
281
250
221
196
r
)i.
!
l
1-
..0.52
11/03/.0
r'~~
1~~
'r
~
67
-g
59
~
~
r
~
75
'
~~
./29/'S
1
3/10/37
§s
154
122
137
~~
r
212.SO
"
'
r
rs~~'
1
~
8
0/2'/21
~
l §f1~1r
!!g~~g~
.7760
r
!!g!!gS§
S/13/'0
,SI60
./2a/'2
.
so15"..
2/2'1')
., c"
'/OO/J"
~
12/0~r77S92
g~
63.90
"G
":3~/::
.292
r~~
,
47..~"
41
~
,
Ss
52
37
~§~
~~~a2
,
10..0
174
~l
r
r
-
G
-
G
n
"
,,"
-
G
~
G
G
--
G
Chart courtesy or
Ned Davis Research Inc"
Atlanta, Georgia
28
-
-
" SEMI -LOG ARITHMI
C CHART"
The chartedtrendsreflect relative,or percentagechanges.Thus,in this scale,the verticallinear
distancefar a 100%move is the sameany piaceon the chart irrespectiveof whetherthe rise is from
$5 to $10,$20 to $40 etc.This permitsan accuratecomparisonfrom onechartto anyother.
$
_.
$
600
400
200
aoo
600
400
goo
00
700
600
500
400
200
100
000
00
00
00
,f
I,
m
"
,
j
20
00
:
i
20
,
':
80
,
60
40
20
"
~
80
'-
,
I
70
:,
00
o
Chart COBrtesy or
Securities Research 03mpany
Wellesley Hills, Massachusetts
~
29