William j oneil how to make money in stocks
Bạn đang xem bản rút gọn của tài liệu. Xem và tải ngay bản đầy đủ của tài liệu tại đây (5 MB, 142 trang )
How to Make
Money in
Stocks
19A3265
How to Make
Money in
Stocks
A Winning System in Good Times or Bad
William J. O'Neil
Second Edition
McGraw-Hill, Inc.
New York San Francisco Washington, D.C. Auckland Bogota
Caracas Lisbon London Madrid Mexico City Milan
Montreal New Delhi San Jüan Singapore
Sydney Tokyo Toronto
Library of Congress Cataloging-in-Publication Data
O'Neil, William J.
How to inake money in Stocks : a winning System in good times or
bad / William J. O'Neil.—2nd ed.
p.
cm.
Includes index.
ISBN 0-07-048059-1 (hc)
1. Investments.
HG4521.0515
2. Stocks.
—ISBN 0-07-048017-6 (pb)
I. Title.
1995
332.63'22—dc20
94-28192
CIP
Copyright © 1995, 1991, 1988 by McGraw-Hill, Inc. All rights reserved.
Printed in the United States of America. Except äs permitted under the
United States Copyright Act of 1976, no part of this publication may be
reproduced or distributed in any form or by any means, or stored in a
data base or retrieval System, without the prior written permission of the
publisher.
1 2 3 4 5 6 7 8 9 0
1 2 3 4 5 6 7 8 9 0
DOC/DOC
DOC/DOC
909
909
7 6 5 4 (HC)
7 6 5 4 (PBK)
ISBN 0-07-048059-1 (hc)
ISBN 0-07-048017-6 (pbk)
The Sponsoring editorfor this book was Philip Ruppel, the editing Supervisor was Fred Bernardi, and the production Supervisor was Suzanne
Babeuf. It was set in Baskerville by McGraw-HiU's Professional Book
Group composition unit.
Printed and bound by R. R. Donnelley & Sons Company.
This book is printed on recycled, acid-free paper containing a
minimum of 50% recycled, de-inked über.
Success in a free country is simple.
Get a Job, get an education, and
learn to save and invest wisely.
Anyone can do it.
You can do it.
Contents
Preface
ix
Part l A Winning System: C-A-N S-L-I-M
Introduction: Learning from the Greatest Winners
1. C = Current Quarterly Earnings Per Share: How Much
Is Enough?
2
5
2. A = Annual Earnings Increases: Look for Meaningful
Growth
14
3. N = New Products, New Management, New Highs:
Buying at the Right Time
22
4. S = Supply and Demand: Small Capitalization Plus
Big Volume Demand
29
5. L = Leader or Laggard: Which Is Your Stock?
34
6. I = Institutional Sponsorship: A Little Goes a Long Way 40
7. M = Market Direction: How to Determine It
44
Part 2 Be Smart from the Start
8. Finding a Broker, Opening an Account, and What It
Costs to Buy Stocks
80
vj|j
Contents
9. When to Seil if Your Selection or Timing Might Be
Wrong
10. When to Seil and Take Your Profit
85
97
11. Should You Diversify, Invest for the Long Pull, Buy
on Margin, Seil Short?
109
12. Should You Buy Options, OTC Stocks,
New Issues...?
115
13. How You Could Make a Million Owning Mutual
Funds
131
Preface
Part 3 Invcsting likc a Professional
14. Models of the Greatest Stock Market Winners:
1953-1993
140
15. How to Read Charts like an Expert and Improve
Your Stock Selection and Timing
160
16. How to Make Money Reading the Daily Financial
News Pages
180
17. The Art of Tape Reading: Analyzing and Reacting to
News
207
18. How to Pick the Best Industry Groups, Subgroups,
and Market Sectors
218
19. Improving Management of Pension and Institutional
Portfolios
230
20. 18 Common Mistakes Most Investors Make
254
Index
259
From August 1982 to August 1987, the stock market staged a phänomenal 250% increase. Employees' pension funds made a fortune. Then in
one day in October 1987, the market dropped a record 24%. Sanity and
reality returned. That's the stock market.
During the last 50 years, we have had twelve bull (up) markets and
eleveii bear (down) markets. But guess what? The bull markets averaged
going up about 100% and the bear markets, on an average, declined
25% to 30%. Not only that, the typical bull market lasted 3 3/4 years
and the classic bear market lingered only nine months. Viewed with
perspective...that's a terrific deal.
But I will go you one better. Did you know that in the last 100 years
we have had more than 25 bear market slumps (natural, normal corrections of the previous bull market advance), and EVERY SINGLE TIME
THE MARKET RECOVERED AND ULTIMATELYSOARED INTO NEW
HIGH GROUND? That's fantastic.
What causes this continued long-term growth and upward progress?
It's one of the greatest success stories in the world—free people, in a
free country, with strong desires and the incentives to unceasingly
improve their circumstances. America just keeps growing.
The stock market does not go up due to greed. It goes up because of
businesses with new products, new Services, and new inventions...and
there are hundreds of them every year. The innovative entrepreneurial
companies with the best quality new products that serve people's needs
are always the top stock market winners.
So, why haven't more people taken advantage of these tremendous
Preface
Preface
XI
investment opportunities? It's that they don't understand the market,
tables and to grow and take share of market away from The Wall Steet
and when you don't understand something you are unsure, maybe even
afraid.
I am going to solve that problem for you. This book will explain the
market to you in simple terms everyone can understand. It will show
you how to select which Stocks to buy and exactly when you should buy
and when you should seil. There are two entire chapters on when to seil
and nail down your profits or cut short potential mistakes. You can
learn how to protect yourself against the big risks in good times or bad.
There are three things I feel absolutely certain about concerning the
next twenty-five years. Our government will continue to tax you äs much
äs it possibly can for äs long äs you live, your cost of living will go up
substantially, and the stock market and economy will be much higher.
You can't do a lot about the first two, but you can benefit materially
from the last one if you learn how to save and invest properly.
Don't be thrown off by the swarm of gloom and doomers. In the long
run, they have seldom made anyone any money or provided any real
happiness. I have also never met a successful pessimist.
There is one overpowering, overriding reason why there should be
other bull markets ahead—the enormous number of baby boomers.
Marriages will be up and couples will need housing, furniture, medical
care, clothing, and education for all the new children. This giant bulge
in future demand will not go away.
Everyone should own common stock! It's a great way to get an extra
income, financial independence, and security. It's a way you can "be in
business for yourself," and it can be safe and sound over the long
term...if you learn to correctly apply all the basic rules for making and
protecting your gains and minimizing losses. It could put your kids
through school, dramatically increase your Standard of living, and give
you freedom and safety in your old age.
I have spent 35 years analyzing how the U.S. economy works. William
O'Neil & Co., also built the first daily Computer data base on the stock
market in this country and used it to construct models of what the most
successful companies looked like just before they became big successes.
In 1970, we moved into the institutional stock research business. We
called our first service Datagraphs. Today we are regarded by some
institutional investors äs the leader in automation in securities analysis
and management. A daily chart service was also developed called Daily
Graphs to which thousands of individual investors subscribe.
In 1983, I designed and created the basic format for Investor's Daily,
a national business newspaper. It was the first paper to make significant
improvements in news available to public investors via daily stock price
Journal. A completely separate organization was then set up to directly
challenge the sacred 100-year-old east coast-based industry giant.
My prime objective in writing this book is to help everyone discover
how to get ahead by saving and investing.
I'm talking about ordinary people who have never owned Stocks;
those deeply concerned about Inflation and their dwindliiig dollar;
everyday individuals investing in a local savings account, a money market fund, or a mortgage; people who may have bought a little art, gold,
or silver.
This book will also help renters who dream of one day buying a hörne
or income property, and those investors who already enjoy home ownership. It is for amateur investors in the stock market, people considering
an IRA (Individual Retirement Account) or a mutual fund, retired persons, teachers of Investment courses, and students attempting to learn
about Investments. It should be used in schools, whether grade school,
junior high, high school, or College level. Young people growing up
should learn how the American economy and market really work and
how they can materially benefit from it.
Lastly, this book is for sophisticated professionals managing pension
and mutual funds, whose difficult Job it is to produce investment results
and stay ahead in a very complex and confusing game.
It is also for those who seek professional advice in the supervision of
state and public employee funds and educational and charitable investment portfolios, and for foreign investors who want to invest money in
the U.S.A., the land of unmatched personal freedorn and opportunity.
My deep appreciation and heartfelt thanks go out to those loyal hardworking souls who read, edited, worked on the graphics, criticized,
typed, and retyped the endless changes made to this work. Some of
those dedicated individuals are Anne Gerhard, Carolyn Hoffman,
Jeannie Kihm, Jim Lan, Stanley Liu, Diane Marin, Milton Perrin, Kathy
Russell, Lindee Shadrake, Kathy Sherman, Frank Spillers, and Susan
Warfei. And, of course, a great amount of valuable assistance and
numerous suggestions were provided by my wife Fay and Bill Sabin and
the excellent McGraw-Hill staff.
William J. O'Neu
How to Make
Money in
Stocks
PART l
A Winning
System:
C-A-N S-L-I-M
Introduction
Introduction:
Learning from the Greatest
Winners
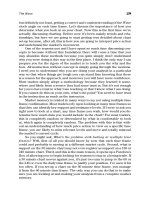
In the following chapters, I will show you exactly how to pick more big
winners in the stock market and how to substantially reduce your losses
and mistakes. I will examine and discuss other Investments, äs well.
In the past, most people who bought and sold Stocks either had
mediocre results or lost money because of their clear lack of knowledge.
But no one has to lose money.
This book will provide you with most of the investment understanding, skills, and methods you need to become a more successful Investor.
I believe that most people in this country and many others throughout the free world, young and old, regardless of profession, education,
background, or economic position, can and defmitely should own common stock. This book isn't written for an elite but for the millions of little guys and gals everywhere who want a chance to be better off.
YOU CAN
START SMALL
If you are a typical working man or woman or a
beginning Investor, it doesn't take a lot of
money to Start. You can begin with äs little äs
$500 to $1000 and add to it äs you earn and
save more money. I began with the purchase
of just five shares of Procter & Gamble when
I was only 21 and fresh out of school.
You live in a fantastic tinie of unlimited opportunity, an era of outstanding new ideas, emerging industries, and new frontiers. But you
have to read to learn how to recognize and take advantage of these
extraordinary Situation«.
The opportunities are out there for everyone. You are now witnessing
a New America. We lead the world in high technology, medical
advancements, Computer Software, military capabilities, and innovative
new entrepreneurial companies. The communist socialist System was
finally relegated to the ash heap of history under Ronald Reagan and
our System of freedom and opportunity serves äs a prime success model
for the majority of countries in the world.
It is not enough today to just work and earn a salary. To do the things
you want to do, to go the places you want to go, to have the things you
want to have in your life, you absolutely must save and invest intelligently. The second income from your Investments and the net profits you
can make will help you reach your goals and provide real security.
SECRET TIP #1
The first Step in learning to pick stock market
winners is for you to examine leading winners
of the past to learn all the characteristics of the
most successful Stocks. You will learn from this
observation what type of price patterns these
Stocks developed just before their spectacular
price advances.
Other key factors you will uncover include what kind of Company
quarterly-earnings reports were publicly known at the time, what the
annual earnings histories of these organizations had been in the prior
five years, what amount of stock trading volume was present, what
degree of relative price strength occurred in the price of the Stocks
before their enormous success, how many shares of common stock were
outstanding in the capitalization of each Company, how many of the
greatest winners had significant new products or new management, and
how many were tied to strong industry group moves caused by important changes occurring in an entire industry.
It is easy to conduct this type of practical, commonsense analysis of
past successful leaders. I have already completed such a comprehensive
study. In our historical analysis, we selected the greatest winning Stocks
in the stock market each year (in terms of percentage increase for the
year), spanning more than 40 years.
We call the study The Record Book of Greatest Stock Market Winners.
It covers the period from 1953 through 1993 and analyzes in detail over
500 of the biggest winning companies in recent stock market history:
super Stocks such äs Texas Instruments, whose price soared from $25 to
$250 from January 1958 through May 1960; Xerox, which escalated
from $160 to the equivalent of $1340 from March 1963 to June 1966;
A Winning System: C-A-N S-L-I-M
Syntex, which leaped from $100 to $570 in only six rnonths during the
last half of 1963; Dome Petroleum and Prime Computer, which respec-
tively advanced 1000% and 1595% in the 1978-1980 stock market;
Limited Stores, which wildly excited lucky shareowners with a 3500%
increase between 1982 and 1987; and Cisco Systems, which advanced
from a split-adjusted $1.88 to $40.75 between October 1990 and March
1994. Home Depot and Microsoft both increased more than 20 times
during the 1980s and early '90s. Home Depot was one of the all-time
great performers jumping twentyfold in less than 2 years from its initial
public offering in September of 1981 and then again climbing another
10 times from 1988 to 1992. All of these companies offered exciting
new products and concepts.
Would you like to know the common characteristics and secret rules
of success we discovered from this intensive study of all past glamorous
stock market leaders?
It's all in the next few chapters and in a simple easy-to-remember formula we have named C-A-N S-L-I-M. Write the formula down, and
repeat it several times so you won't forget it.
Each letter in the words C-A-N S-L-I-M Stands for one of the seven
chief characteristics of these great winning Stocks at their early developing stages, just before they made huge profits for their shareholders.
You can learn how to pick winners in the stock market, and you can
become part owner in the best companies in the world. So, let's get
started right now. Here's a sneak preview of C-A-N S-L-I-M.
C
A
N
S
L
I
M
=
=
=
=
=
=
=
Current Quarterly Earnings Per Share: How Much Is Enough?
Aimual Earnings Increases: Look for Meaiiingful Growth.
New Products, New Management, New Highs: Buying at the Right Time.
Supply and Demand: Small Capitalization Plus Volume Demand.
Leader or Laggard: Which Is Your Stock?
Institutional Sponsorship: A Little Goes a Long Way.
Market Direction: How to Determine It?
Please begin immediately with Chapter 1.
l
C = Current Quarterly Earnings
Per Share:
How Much Is Enough?
M/A-Com Inc.
Humana Inc.
Kirby Exploration Co.
What did shares of the above-mentioned microwave component manufacturer, hospital operator, and oil Service Company have in common?
From 1977 to 1981, they all posted price run-ups surpassing 900%.
In scrutinizing these and other past stock market superstars, I've
found a number of other similarities äs well.
For example, tradiiig volume in these sensational winners swelled
substantially before their giant price moves began. The winning Stocks
also tended to shuffle around in price consolidation periods for a few
months before they broke out and soared. But one key variable stood
out from all the rest in importance: the profits of nearly every outstanding stock were booming.
The common Stocks you select for purchase should show a major percentage increase in the current quarterly earnings per share (the most
recently reported quarter) when compared to the prior year's same
quarter.
Earnings per share are calculated by dividing a company's total aftertax profits by the company's number of common shares outstanding.
The percentage increase in earnings per share is the single most important element in stock selection today.
The greater the percentage of increase, the better, äs long äs you
6
A Winning System: C-A-N S-L-I-M
aren't misled by comparing current earnings to nearly nonexistent
earnings for the year earlier quarter, like 1 cent a share.
Ten cents per share versus one cent may be a 900% increase, but it is
definitely distorted and not as meaningful as $1 versus $.50. The 100%
increase of $1 versus $.50 is not overstated by comparison to an unusually low number in the year ago quarter.
I am continually amazed at how many professional pension fund
managers, as well as individual investors, buy common stocks with the
current reported quarter's earnings flat (no change), or even worse,
down. There is absolutely no reason for a stock to go anywhere if the
current earnings are poor.
Even if the present quarter's earnings are up 5% to 10%, that is simply not enough of an improvement to fuel any significant upward price
movement in a stock. It is also easier for a corporation currently showing a mere increase of 7% or 8% to suddenly report lower earnings the
next quarter.
Seek Stocks Showing Big
Current Earnings Incrcascs
In our models of the 500 best performing Stocks in the 40 years from
1953 through 1993, three out of four of these securities showed earnings iricreases averaging rnore than 70% in the latest publicly reported
quarter before the Stocks began their major price advance. The one out
of four that didn't show solid current quarter increases did so in the
very next quarter, and those increases averaged 90%!
If the best Stocks had profit increases of this magnitude before they
advanced rapidly in price, why should you settle for mediocre or down
earnings?
Our study showed that among all big gainers between 1970 and 1982,
86% reported higher earnings in their most recently published quarter,
and 76% were up over 10%. The median earnings increase was 34%
and the rnean (average) was up 90%.
You may find that only about 2% of all Stocks listed for trading on the
New York or American stock exchanges will, at any one time, show
increases of this proportion in current quarterly net iiicome.
But, remember you want to find the exceptional Stocks rather than
the lackluster ones, so set your sights high and Start looking for the
superior Stocks, the small number of real leaders. They are there.
Success is built on dreanis and ideas; however, it helps to know exactly what you're looking for. Before you Start your search for tomorrow's
super stock market leader, let nie teil you about a few of the traps and
ni t falls.
C = Current Quarterly Earnings Per Share
Watch Out for Misleading
Reports of Earnings
Have you ever read a corporation's quarterly earnings report that stated,
"We had a terrible first three months. Prospects for our Company are turning down due to inefficiencies in the home office. Our competition just
came out with a better product, which will adversely affect our sales.
Furthermore, we are losing our shirt on the new midwestern Operation,
which was a real blunder on management's part."
No! Here's what you see. "Greatshakes Corporation reports record sales
of $7.2 million versus $6 million (+ 20%) for the quarter ended March
31." If you own their stock, this is wonderful news. You certainly are not
going to be disappointed. You think this is a fine Company (otherwise you
wouldn't own its stock), and the report confirms your thinking.
Is this record-breaking sales armouncement a good report? Let's sup-
pose the Company also had record earnings of $2.10 per share of stock for
the quarter. Is it even better now?
What if the $2.10 was versus $2 (+ 5%) per share in the same quarter
the previous year? Why were sales up 20% and earnings ahead only 5%?
Something might be wrong—rnaybe the company's profit margins are
crumbling. At any rate, if you own the stock, you should be concerned and
evaluate the Situation closely to see why the earnings increased only 5%.
Most investors are impressed with what they read, and companies love
to put their best foot forward. Even though this corporation may have had
all-time record sales, up 20%, it didn't mean much. You must be able to
see through slanted published presentations if you want the vital facts.
The key factor for the winning investor must always be how much the
current quarter's earnings are up in percentage terms from the same quarter the year before!
Let's say your Company discloses that sales climbed 10% and net income
advanced 12%. This sounds good, but you shouldn't be concerned with
the company's total net income. You don't own the whole organization.
You own shares of stock in the corporation. Perhaps the Company issued
additional shares or there was other dilution of the common stock. Just
because sales and total net income for the Company were up, the report
still may not be favorable. Maybe earnings per share of common stock
inched up only 2% or 3%.
Break Down Six or Nine
Month Earnings into Quarterly
Percentage Changes
Suppose your Company announces that earnings for the six months that
A Winning System: C-A-N S-L-I-M
8
earlier (+ 25%). Your "pet" stock inust be in great shape. You couldn't
ask for better results—or could you?
Beware. The Company reported earnings for six months. What did
the stock earn in the last quarter, the three months ended in June?
Maybe in the first quarter ended in March the stock earned $1.60 per
share versus $1 (+ 60%). What does this leave for the last quarter ended
June 30? Ninety cents versus one dollar. This is a terrible report, even
though the way it was presented to you sounded terrific.
If you own common stock in a Company whose earnings had been up
60% and they came out with a Statement of $.90 versus $1 (down 10%),
you had better wake up. The outfit might be deteriorating.
You can't always assume that because an earnings report appears to
be rosy, everything is fine. You have to look deeper and not accept the
reassuring manner of corporate news releases reported in your favorite
newspaper.
Many times, earnings declarations are published for the most recent
nine months. This teils you nothing, and all too ofteii it masks serious
weakness in the numbers that really count. The first quarter may have
been up 30%, the second quarter up 10%, and the last quarter off 10%.
By always breaking down the figures to show the quarter-by-quarter
earnings, you will be able to see a completely different picture and
trend.
Omit a Company's One-Time
Extraordinary Gains
The last important trap the winning Investor should sidestep is being
influenced by nonrecurring profits.
If an organization that manufactures Computers reports earnings for
the last quarter that include profits from the sale of real estate or a
plant, for example, that pari of the earnings should be subtracted from
the report. Those are one-time, nonrecurring earnings and are not representative of the true, ongoing profitability of corporate operations.
Ignore them.
Set a Minimum Level for
Current Earnings Increases
As a general guide for new or experienced investors, I would suggest
you not buy any stock that doesn't show earnings per share up at hast
18% or 20% in the most recent quarter versus the same quarter the
C = Current Quarterly Earnings Per Share
year before. Many successful money-makers use 25% or 30% äs their
minimum earnings parameter. And make sure you calculate the percentage change; don't guess or assume. You will be even safer if you
insist the last two quarters each show a significant percentage increase
in earnings from year-ago quarters.
During bull markets, I prefer to concentrate in equities (comrnon
Stocks) that show powerful current earnings leaping 40% or 50% up to
500%. Why not buy the very best merchandise available?
If you want to further sharpen your stock selection process, before
you buy, look ahead to the next quarter or two and check the earnings
that were reported for those same quarters the previous year. See if the
Company will be coming up against unusually large or small earnings
achieved a year ago.
In some instances, where the unusual year-earlier earnings are not
due to seasonal factors (the December quarter is always big for retailers,
for example), this procedure may help you anticipate a strong or poor
earnings report due ahead in the coming months.
Many individuals and institutions alike buy Stocks with earnings down
in the most recently reported quarter just because they like a Company
and think the stock's price is cheap. Usually they accept a story that
earnings will rebound strongly in the near future.
While this may be true in some cases (it frequently isn't), the main
point is that at any time in the market, you have the choice of investing
in at least 5000 or more Stocks. You don't have to accept promises of
something that may never occur when alternative investments are actually showing current earnings advancing strongly.
The Debate on Overemphasis
of Current Earnings
Recently it has been noted that Japanese firms concentrate more on
longer-term profits rather than on trying to maximize current earnings
per share.
This is a sound concept and one the better-managed organizations in
the United States (a minority of companies) also follow. That is how
well-managed entities create colossal quarterly earnings increases, by
spending several years on research, developing superior new products,
and cutting costs.
But don't be confused. You äs an individual Investor can afford to wait
until the point in time when a Company positively proves to you its
efforts have been successful and are starting to actually show real earninsrs increases.
C = Current Quarterly Earnings Per Share
10
A Winning System: C-A-N S-L-l-M
Requiring that current quarterly earnings be up a hefty amount is just
another smart way the intelligent Investor can reduce the risk of excessive mistakes in stock selection.
Many corporations have mediocre management that continually produces second-rate earnings results. I call them the "entrenched maintainers." These are the companies you want to avoid until someone has
the courage to change top management. Ironically, these are generally
the companies that strain to pump up their current earnings a dull 8%
or 10%. True growth companies with outstanding new products do not
have to maximize current results.
Look for Accelerating
Quarterly Earnings Growth
My studies of thousands of the most successful concerns in America
proved that virtually every corporate stock with an outstanding upward
price move showed accelerated quarterly earnings increases some time
in the previous ten quarters before the towering price advance began.
Therefore, what is crucial is not just that earnings are up or that a
certain price-to-earnings ratio (a stock's price divided by its last twelve
months' earnings per share) exists; it is the change and improvement
from the stock's prior percentage rate of earning increases that causes a
supreme price surge. Wall Street now calls these earnings surprises.
I once mentioned this concept of earnings acceleration to Peter
Vermilye, the former head of Citicorp's Trust Investment Division in
New York City. He liked the term and feit it was much more accurate
and relevant than the phrase "earnings momentum" sometimes used by
Investment professionals.
If a Company's earnings are up 15% a year and suddenly begin spurting 40% to 50% a year, it usually creates the basic conditions for important stock price improvement.
lengthy and unrewarding price consolidation period characterized by
prolonged sideways movement.
I prefer to see two quarters of material slowdown before turning negative on a company's earnings since the best of organizations can periodically have one slow quarter.
Consult Log Scale
Weekly Graphs
One reason that logarithmic scale graphs are of such great value in
security analysis is that acceleration or deceleration in the percentage
rate of quarterly earnings increases can be seen very clearly on a log
graph.
Log graphs show percentage changes accurately, since one inch anywhere on the price or earnings scale represents the same percentage
change. This is not true of arithmetically scaled charts.
For example, a 100% stock price increase from $10 to $20 a share
would show the same space change äs a 50% increase from $20 to $30 a
share on an arithmetically scaled chart. A log graph, however, would
show the 100% increase äs twice äs large äs the 50% increase.
The principle of earnings acceleration or deceleration is essential to
understand.
Fundamental security analysts who recommend Stocks because of an
absolute level of earnings expected for the following year could be looking at the wrong set of facts. A stock that earned $5 per share and
expects to report $6 the next year can mislead you unless you know the
previous trend in the percentage rate of earnings change.
Two Quarters of Major
Earnings Deceleration May
Mean Trouble
Likewise, when the rate of earnings growth Starts to slow and begins
meaningful deceleration (for instance, a 50% rate of increase suddenly
decreases to only 15% for a couple quarters), the security probably has
either topped out permanently, regardless of what analysts and Wall
o..„_. „,„., „„„ „r t v,p r^tf, Of nr)warc[ orogress will dwindle into a
11
Arithmetic price scale
12
A Winning System: C-A-N S-L-I-M
C = Current Quarterly Earnings Per Share
13
while the market and other equities in the same group advance. This
could give you an early clue of an approaching good or bad report. You
may also want to be aware and suspicious of stocks that have gone several
weeks beyond estimated reporting time without the release of an earnings announcement.
Where to Find Current
Corporate Earnings Reports
New quarterly corporate earnings statements are published every day in
the financial section of your local paper, in Investor's Business Daily, and
in The Wall Street Journal. Investor's Business Daily separates all new
earnings reports into companies with "up" earnings and those disclosing
"down" results so you can easily see who produced excellent gains.
To say the security is undervalued just because it is selling at a certain
price-earnings ratio or because it is in the low range of its historical P/E
ratio is also usually nonsense unless primary consideration has first
been given to whether the momentum and rate of change in earnings is
substantially increasing or decreasing.
Perhaps this partially explains who so few public or institutional
investors, such as banks and insurance companies, make worthwhile
money following the buy-and-sell recommendations of most securities analysts.
You, as a do-it-yourself investor, can take the latest quarterly earnings
per share, add them to the prior three quarters' earnings of a company,
and plot the amounts on a logarithmic scale graph. The plotting of the
most recent twelve-month earnings each quarter should, in the best
companies, put the earnings per share close to or already at new highs.
Check Other Key Stocks in
the Group
For added safety, it is wise to check the industry group of your stock.
You should be able to find at least one other noteworthy stock in the
industry also showing good current earnings. This acts as a confirming
factor. If you cannot find any other impressive stock in the group displaying strong earnings, the chances are greater that you have selected
the wrong investment.
Note the date when a company expects to report its next quarterly
earnings. One to four weeks prior to the report's release, a stock frequently displays unusual price strength or weakness, or simply "hesitates"
Which earnings report do you think is best?
Chart services published weekly also show earnings reported during
the prior week as well as the most recent earnings figures for every stock
they chart.
One last point to clarify: You should always compare a stock's percentage increase in earnings for the quarter ended December, to the
December quarter a year earlier. Never compare the December quarter
to the immediately prior September quarter.
You now have the first critical rule for improving your stock selection:
Current quarterly earnings per share should be up a major percentage
(at least 20% to 50% or more) over the same quarter last year. The best ones
might show earnings up 100% to 500%! A mediocre 8% or 10% isn't
enough! In picking winning stocks, it's the bottom line that counts.
A = Annual Earnings Increases
2
A = Annual Earnings Increases;
Look for Meaningful Growth
If you want to own part of a business in your home town, do you
choose a steadily growing, successful concern or one that is unsuccessful, not growing and highly cyclical?
Most of you would prefer a business that is showing profitable growth.
That's exactly what you should look for in common stocks. Each
year's annual earnings per share for the last five years should show an
increase over the prior year's earnings. You might accept one year
being down in the last five as long as the following year's earnings
quickly recover and move back to new high ground.
It is possible that a stock could earn $4 a share one year, $5 the next
year, $6 the next, and the following year—$2. If the next annual earnings statement were $2.50 versus the prior year's $2 (+ 25%), that would
not be a good report. The only reason it may seem attractive is that the
previous year ($2) was so depressed any improvement would look good.
In any case, the profit recovery is slow and is still substantially below the
company's peak earnings of $6:
Select Stocks with 25% to
50% Annual Growth Rates
Owning common stock is just the same as being a part owner in a business. And who wants to own part of an establishment showing no growth?
The annual compounded growth rate of earnings in the superior firms
you hand pick for purchasing stock in should be from 25% to 50%, or
even 100% or more, per year over the last 4 or 5 years.
Between 1970 and 1982, the average annual compounded earnings
15
growth rate of all outstanding performing stocks at their early emerging
stage was 24%. The median, or most common, growth rate was 21% per
year, and three out of four of the prominent winners revealed at least
some positive annual growth rate over the five years preceding the giant
increase in the value of the stock. One out of four were turnarounds.
A typical successful yearly earnings per share growth progression for a
company's latest five-year period might look something like $.70, $1.15,
$1.85, $2.80, $4.
The earnings estimate for the next year should also be up a healthy
percentage; the greater the percentage, the better. However, remember
estimates are opinions. Opinions may be wrong whereas actual reported
earnings are facts that are ordinarily more dependable.
What Is a Normal Stock
Market Cycle?
Most bull (up) market cycles last two to four years and are followed by a
recession or bear (down) market and eventually another bull market in
common stocks.
In the beginning phase of a new bull market, growth stocks are usually the first sector to lead the market and make new price highs. Heavy
basic industry groups such as steel, chemical, paper, rubber, and
machinery are commonly more laggard followers.
Young growth stocks will usually dominate for at least two bull market
cycles. Then the emphasis may change for the next cycle, or a short
period, to turnaround or cyclical stocks or newly improved sectors of
the market, such as consumer growth stocks, over-the-counter growth
issues, or defense stocks that sat on the sidelines in the previous cycle.
Last year's bloody bums become next year's heroes. Chrysler and
Ford were two such spirited turnaround plays in 1982. Cyclical and
turnaround opportunities led in the market waves of 1953—1955,
1963-1965, arid 1974-1975. Papers, aluminums, autos, chemicals, and
plastics returned to the fore in 1987. Yet, even in these periods, there
were some pretty dramatic young growth stocks available. Basic industry
stocks in the United States frequently represent older, more inefficient
industries, some of which are no longer internationally competitive and
growing. This is perhaps not the area of America's future excellence.
Cyclical stocks' price moves tend to be more short-lived when they do
occur, and these stocks are much more apt to suddenly falter and
encounter disappointing quarterly earnings reports. Even in the stretch
where you decide to buy strong turnaround situations, the annual compounded growth rate could, in many cases, be 5% to 10%.
A Winning System: C-A-N S-L-I-M
16
Requiring a company to show two consecutive quarters of sharp earnings recovery should put the earnings for the latest twelve months into,
or very near, new high ground. If the 12 months earnings line is shown
on a chart, the sharper the upswing the better. This will make it possible in many cases for even the "old dog" about-face stock to show some
annual growth rate for the prior five-year time period. Sometimes one
quarter of earnings turnaround will suffice if the earnings upswing is so
dramatic that it puts the 12 months ended earnings line into new highs.
Check the Stability of a
Company's Five-Year
Earnings Record
While the percentage rate of increase in earnings is most important, an
additional factor of value, which we helped pioneer in the measurement and use of, is the stability and consistency of the past five years'
earnings. We display the number differently than most statisticians do.
Our stability measurements are expressed on a scale from 1 to 99.
The lower the figure, the more stable the past earnings record. The figures are ca^ulated by plotting quarterly earnings for the last five years
and fitting a trend line around the plot points to determine the degree
of deviation from the basic earnings trend.
Growth stocks with good stability of earnings tend to show a stability
figure below 20 or 25. Equities with a stability rating over 30 are more
cyclical and a little less dependable in their growth. All other things
being equal, you may want to choose the security showing a greater
degree of consistency and stability in past earnings growth.
Earnings stability numbers are usually shown immediately after a
company's five-year growth rate, although most analysts and investment
services do not bother to make the calculation.
EARNINGS GROWTH RATE (STABILITY) RANK
1983-87
+ 31%
( 6)
1981-85
+ 19%
( «)
1979-83
+ 19%
(")
Earning* stability rank
If you primarily restrict your selections to ventures with proven
growth records, you avoid the hundreds of investments having erratic
earnings histories or a cyclical recovery in profits that may top out as
they approach earnings peaks of the prior cycle.
A = Annual Earnings Increases
17
How to Weed Out the Losers
in a Group
When you investigate a specific industry group, using the five-year
growth criteria will also help you weed out 80% of the stocks in an
industry. This is because the majority of companies in an industry have
lackluster growth rates or no growth.
When Xerox was having its super performance of 700% growth from
March 1963 to June 1966, its earnings growth rate averaged 32% per
year. Wal-Mart Stores, a discount retailer, sported an annual growth
rate from 1977 to 1990 of 43% and boomed in price an incredible
11,200%. Cisco Systems growth rate in October 1990 was an enormous
257% per year and Microsoft's was 99% in October 1986, both before
their long advances.
The fact that an investment possesses a good five-year growth record
doesn't necessarily cause it to be labeled a growth stock. Ironically, in
fact, some companies called growth stocks are producing a substantially
slower rate of growth than they did in several earlier market eras. These
should usually be. avoided. Their record is more like a fully matured or
nearly senile growth stock. Older and larger organizations frequently
show slow growth.
New Cycles Create New
Leaders
Each soaring new cycle in the stock market will catapult fresh leadership stocks to the attention of the market, some of which will begin to
be called growth stocks. The growth record in itself, however, is only a
starting point for would-be victorious investors, and it should be the
first of many earnings measurements you should check.
For example, companies with outstanding five-year growth records of
30% per year but whose current earnings in the last two quarters have
slowed significantly to + 15% and + 10% should be avoided in most
instances.
Insist on Both Annual and
Current Quarterly Earnings
Being Excellent
We prefer to see current quarterly earnings accelerating or at least maintaining the trend of several past quarters. A standout stock needs a
A Winning System: C-A-N S-L-I-M
18
sound growth record during recent years but also needs a strong current
earnings record in the last few quarters. It is the unique combination of
these two critical factors, rather than one or the other being outstanding,
that creates a superb stock, or at least one that has a higher chance of
true success.
Investor's Business Daily provides a relative earnings ranking (based
on the latest five-year annual earnings record and recent quarterly earnings reports) for all common stocks shown in the daily NYSE, AMEX,
and OTC stock price quotation tables.
More than 6000 stocks are compared against each other and ranked on
a scale from 1 to 99. An 80 earnings per share rank means a company's
current and five-year historical earnings record outclassed 80% of all
other companies.
The earnings record of a corporation is the most critical, fundamental
factor available for selecting potential winning stocks.
Arc Price-Earnings Ratios
Important?
Now that we've discussed the indispensable importance of a stock's current quarterly earnings record and annual earnings increases in the last
five years, you may be wondering about a stock's price-to-earnings
(P/E) ratio. How important is it in selecting stocks? Prepare yourself for
a bubble-bursting surprise.
P/E ratios have been used for years by analysts as their basic measurement tool in deciding if a stock is undervalued (has a low P/E) and
should be bought or is overvalued (has a high P/E) and should be sold.
Factual analysis of each cycle's winning stocks shows that P/E ratios
have very little to do with whether a stock should be bought or not. A
stock's P/E ratio is not normally an important cause of the most successful stock moves.
Our model book studies proved the percentage increase in earnings
per share was substantially more crucial than the P/E ratio as a cause of
impressive stock performance.
During the 33 years from 1953 through 1985 the average P/E for the
best performing stocks at their early emerging stage was 20 (the Dow
IFRANKLIN
RES
INC
3.494.000 SHARES
-97% ANNUAL EPS GROWTH
LAST QTR EPS -115%, PRIOR QTR EPS -150%
Profile of a standout stock
A = Annual Earnings Increases
19
Jones Industrial's P/E at the same time averaged 15). While advancing,
these stocks expanded their P/Es to approximately 45 (125% expansion
of P/E ratio).
Why You Missed Some
Fabulous Stocks!
While these figures are merely averages, they do strongly imply that if
you were not willing to pay an average of 20 to 30 times earnings for
growth stocks in the 40 years through 1993, you automatically eliminated most of the best investments available!
P/Es were higher on average from 1953 to 1970 and lower between
1970 and 1982. From 1974 through 1982, the average beginning P/E
was 15 and expanded to 31 at the stock's top. P/Es of winning stocks
during this period tended to be only slightly higher than the general
market's P/E at the beginning of a stock's price advance.
High P/Es were found to occur because of bull markets. With the
exception of cyclical stocks, low P/Es generally occurred because of bear
markets. Some OTC growth stocks may also display lower P/Es if the
stocks are not yet widely owned by institutional investors.
Don't buy a stock solely because the P/E ratio looks cheap. There
usually are good reasons why it is cheap, and there is no golden rule in
the marketplace that a stock which sells at eight or ten times earnings
cannot eventually sell at four or five times earnings. Many years ago,
when I was first beginning to study the market, I bought Northrop at
four times earnings and in disbelief watched the outfit decline to two
times earnings.
How Price-Earnings Ratios
Are Misused
Many Wall Street analysts inspect the historical high and low price-earnings ratios of a stock and feel intoxicating magic in the air when a security sells in the low end of its historical P/E range. Stocks are frequently
recommended by researchers when this occurs, or when the price starts
to drop, because then the P/E declines and the stock appears to be a
bargain.
Much of this kind of analysis is based on questionable personal opinions or theories handed down through the years by academicians and
some analysts. Many "green" newcomers to the stock market use the
20
A Winning System: C-A-N S-L-I-M
faulty method of selecting stock investments based chiefly 011 low P/E
ratios and go wrong more often than not.
This system of analysis often ignores far more basic trends. For example, the general market may have topped out, in which case all stocks are
headed lower and it is ridiculous to say "Electronic Gizmo" is undervalued because it was 22 times earnings and can now be bought for 15 times
earnings. The market break of 1987 hurt many value buyers.
The Wrong Way to Analyze
Companies in an Industry
Another common, poor use of price-earnings ratios by both amateurs
and professionals alike is to evaluate the stocks in an industry and conclude that the one selling at the cheapest P/E is always undervalued
and is therefore, the most attractive purchase. This is usually the company with the most ghastly earnings record, and that's precisely why it
sells at the lowest P/E.
The simple truth is that stocks at any one time usually sell near their
current value. So the stock which sells at 20 times earnings is there for
one set of reasons, and the stock that trades for 15 times earnings is
there for other reasons the market already has analyzed. The one selling for seven times is at seven times because its overall record is more
deficient. Everything sells for about what it is worth at the time.
If a company's price level and price-earnings ratio changes in the
near future, it is because conditions, events, psychology, and earnings
continue to improve or suddenly start to deteriorate as the weeks and
months pass.
Eventually a stock's P/E will reach its ultimate high point, but this
normally is because the general market averages are peaking and starting an important decline, or the stock definitely is beginning to lose its
earnings growth.
High P/E stocks can be more volatile, particularly if they are in the
high-tech area. The price of a high P/E stock can also get temporarily
ahead of itself, but so can the price of low P/E stocks.
Some High P/Es That Were
Cheap
It should be remembered that in a few captivating smaller-company
growth situations that have revolutionary new product breakthroughs,
high P/E ratios can actually be low. Xerox sold for 100 times earnings
A = Annual Earnings Increases
21
in 1960—before it advanced 3300% in price (from a split-adjusted price
of $5 to $170). Syntex sold for 45 times earnings in July 1963, before it
advanced 400%. Genentech was priced at 200 times earnings in the
over-the-counter market in early November 1985, and it bolted 300% in
the next five months. All had fantastic new products.
Don't Sell High P/E Stocks
Short
When the stock market was at rock bottom in June 1962, a big, heavyset
Beverly Hills investor barged into the office of a broker friend of mine
and in a loud voice shouted Xerox was drastically overpriced because it
was selling for 50 times earnings. He sold 2000 shares short at $88.
After he sold short this "obviously overpriced stock," it immediately
started advancing and ultimately reached a price equal to $1300 before
adjusting for stock splits. So much for amateur opinions about P/E
ratios being too high. Investors' personal opinions are generally wrong;
markets seldom are.
Some institutional research firms in recent years published services
and analyses based on the principle of relative P/E ratios for companies, compared to individual company earnings growth rates. Our
detailed research over many cycles has shown these types of studies to
be misleading and of little practical value.
The conclusion we have reached from years of in-depth research into
winning corporations is that the percentage increase and acceleration
in earnings per share is more important than the level of the stock's
P/E ratio. At any rate, it may be easier to spot emerging new trends
than to accurately assess correct valuation levels.
In summary: Concentrate on stocks with a proven record of significant annual earnings growth in the last five years. Don't accept excuses;
insist the annual earnings increases plus strong recent quarterly earnings improvements be there.
N = New Products, New Management, New Highs
3
N = New Products,
New Management,
New Highs:
Buying at the Right Time
23
6. Houston Oil & Gas, in 1972-1973, with a major new oil field ran up
968% in 61 weeks and later in 1976 picked up another 367%.
7. Computervision stock advanced 1235% in 1978-1980, with the
introduction of new Cad-Cam factory automation equipment.
8. Wang Labs Class B stock grew 1350% in 1978-1980, due to the creation of their new word-processing office machines.
9. Price Company stock shot up more than 15 times in 1982-1986
with the opening of a southern California chain of innovative
wholesale warehouse membership stores.
10. Amgen developed two successful new biotech drugs, Epogen and
Neupogen, and the stock raced ahead from 60% in 1990 to the
equivalent of 460% in January 1992.
11. Cisco Systems, another California company, created routers and
networking equipment that allowed company links with geographically dispersed local area computer networks. The stock advanced
over 2000% in 3V2 years.
It takes something new to produce a startling advance in the price of
a stock.
This something new can be an important new product or service, selling rapidly and causing earnings to accelerate above previous rates of
increase. It could also be new top management in a company during
the last couple of years. A new broom sweeps clean, or at least may
bring inspiring ideas and vigor to the ball game.
Or the new event could be substantial changes within the company's
industry. Industrywide shortages, price increases, or new technology
could affect almost all members of the industry group in a positive way.
In our study of greatest stock market winners from 1953 through
1993, we discovered more than 95% of these stunning successes in
American industry either had a major new product or service, new management, or an important change for the better in the conditions of
their particular industry.
New Products That Created
Super Successes
The Stock Market's Great
Paradox
1. Rexall's new Tupperware division, in 1958, helped push the company's stock to $50 a share, from $16.
2. Thiokol in 1957-1959 came out with new rocket fuels for missiles,
propelling its stock from $48 to the equivalent of $355.
3. Syntex, in 1963, marketed the oral contraceptive pill. In six months
the stock soared from $100 to $550.
4. McDonald's, in 1967-1971, with low-priced fast food franchising,
snowballed into an 1100% profit for stockholders.
5. Levitz Furniture stock increased 660% in 1970-1971, with the popularity of their giant warehouse discount furniture centers.
12. International Game Technology rose an astounding 1600% in
1991-1993 with new microprocessor-based gaming products.
There is another fascinating phenomenon we found in the early stage
of all winning stocks. We call it "the great paradox." Before I tell you
what this last new observation is, I want you to look at three typical
stocks shown on the next page. Which one looks like the best buy to
you? Which stock would you probably avoid?
Among the thousands of individual investors attending my investment
lectures in the 1970s, 1980s, and 1990s, 98% said they do not buy stocks
that are making new highs in price.
The staggering majority of individual investors, whether new or experienced, feel delightful comfort in buying stocks that are down substantially from their peaks.
N - New Products;' New Management, New Highs
25
I have provided extensive research for over 600 institutional investors
in the United States. It is my experience that most institutional money
managers are also bottom buyers—they, too, feel safer buying stocks
that look cheap because they're either down a lot in price or selling
Stock A
near their lows.
The hard-to-accept great paradox in the stock market is that what
seems too high and risky to the majority usually goes higher and what
seems low and cheap usually goes lower. Haven't you seen this happen
before?
In case you find this supposed "high-altitude" method a little difficult
to boldly act upon, let me cite another study we conducted. An analysis
was made of the daily newspapers' new-high and new-low stock lists during several good, as well as poor, market periods.
Our findings were simple. Stocks on the new-high list tended to go
higher, and those on the new-low list tended to go lower.
Put another way, a stock listed in the financial section's new-low list of
common stocks is usually a pretty poor prospect, whereas a stock making the new-high list the first time during a bull market and accompanied by a big increase in trading volume might be a red-hot prospect
worth checking into. Decisive investors should be out of a stock long
before it appears on the new-low list.
You may have guessed by now what the last intriguing new realization
is that I promised to disclose to you earlier. So here are the three stocks
you had to choose among on the previous page, Stock A, Stock B, and
Stock C. Which one did you pick? Stock A (Syntex Corp, see below) was
the right one to buy. The small arrow pointing down above the weekly
prices in July 1963 shows the same buy point at the end of Stock A in
July on the previous page. Stock B and Stock C both declined.
Stock B
Stock C
Stock A
ADJUSTED FOR
A 3:1 SPLIT
Which stock looks like the best buy?
+ 400% in >U month* from July 1963
A Winmng System: C-A-N S-L-I-M
26
N = New Products, New Management, New Highs
27
10% from the exact buy point off the base. Here is an example of the
proper time to have bought Reebok, at $29, in February 1986 before it
zoomed 260%. The second graph shows the correct time to have bought
Amgen at $60—in March 1990—before it jumped more than sixfold.
Stock B
- 42% in six months from August
392% increase in 13 months
Stock C
u.
- 21% in five months from March
When to Correctly Begin
Buying a Stock
A stock should be close to or actually making a new high in price after
undergoing a price correction and consolidation. The consolidation
(base-building period) in price could normally last anywhere from seven
or eight weeks up to fifteen months.
As the stock emerges from its price adjustment phase, slowly resumes
an uptrend, and is approaching new high ground, this is, believe it or
not, the correct time to consider buying. The stock should be bought
just as it's starting to break out of its price base.
You must avoid buying once the stock is extended more than 5% or
681% increase in 22 months
How Does a Stock Go from
$50 to $100?
As a final appeal to your trusty common sense and judgment, it should
be stated that if a security has traded between $40 and $50 a share over
many months and is now selling at $50 and is going to double in price,
it positively must first go through $51, $52, $53, $54, $55, and the like,
before it can reach $100.
Therefore, your job is to buy when a stock looks high to the majority
of conventional investors and to sell after it moves substantially higher
and finally begins to look attractive to some of those same investors.
28
A Winning System: C-A-N S-L-I-M
In conclusion: Search for corporations that have a key new product
or service, new management, or changes in conditions in their industry.
And most importantly, companies whose stocks are emerging from
price consolidation patterns and are close to, or actually touching, new
4
highs in price are usually your best buy candidates. There will always be
something new occurring in America every year. In 1993 alone, there
were nearly 1,000 initial public offerings. Dynamic, innovative new companies—a bundle of future, potential big winners.
S = Supply and Demand:
Small Capitalization
Plus Big Volume Demand
The law of supply and demand determines the price of almost everything in your daily life. When you go to the grocery store and buy fresh
lettuce, tomatoes, eggs, or beef, supply and demand affects the price.
The law of supply and demand even impacted the price of food and
consumer goods in former Communist, dictator-controlled countries
where these state-owned items were always in short supply and frequently
available only to the privileged class of higher officials in the bureaucracy
or in the black market to comrades who could pay exorbitant prices.
The stock market does not escape this basic price principle. The law
of supply and demand is more important than all the analyst opinions
on Wall Street.
Big Is Not Always Better
The price of a common stock with 300 million shares outstanding is
hard to budge up because of the large supply of stock available. A
tremendous volume of buying (demand) is needed to create a rousing
price increase.
On the other hand, if a company has only 2 or 3 million shares of
common stock outstanding, a reasonable amount of buying can push
the stock up rapidly because of the small available supply.
If you are choosing between two stocks to buy, one with 10 million
shares outstanding and the other with 60 million, the smaller one will
usually be the rip-roaring performer if other factors are equal.
30
A Winning System: C-A-N S-L-I-M
The total number of shares of common stock outstanding in a company's capital structure represents the potential amount of stock available for purchase.
The stock's "floating supply" is also frequently considered by market
professionals. It measures the number of common shares left for possi-
ble purchase after subtracting the quantity of stock that is closely held
by company management. Stocks that have a large percentage of ownership by top management are generally your best prospects.
There is another fundamental reason, besides supply and demand,
that companies with large capitalizations (number of shares outstand-
ing) as a rule produce dreadful price appreciation results in the stock
market. The companies themselves are simply too big and sluggish.
Pick Entrepreneurial
Managements Rather Than
Caretakers
Giant size may create seeming power and influence, but size in corporations can also produce lack of imagination from older, more conservative "caretaker managements" less willing to innovate, take risks, and
keep up with the times.
In most cases, top management of large companies does not own a
meaningful portion of the company's common stock. This is a serious
defect large companies should attempt to correct.
Also, too many layers of management separate the senior executive
from what's really going on out in the field at the customer level. And
in the real world, the ultimate boss in a company is the customer.
Times are changing at a quickening pace. A corporation with a fastselling, hot new product today will find sales slipping within three years
if it doesn't continue to have important new products coming to market.
Most of today's inventions and exciting new products and services are
created by hungry, innovative, small- and medium-sized young companies with entrepreneurial-type management. As a result, these organizations grow much faster and create most of the new jobs for all
Americans. This is where the great future growth of America lies. Many
of these companies will be in the services or technology industries.
If a mammoth-sized company occasionally creates an important new
product, it still may not materially help the company's stock because
the new product will probably only account for a small percentage of
the gigantic company's sales and earnings. The product is simply a little
drop in a bucket that's just too big.
S = Supply and Demand
31
Institutional Investors Have a
Big Cap Handicap
Many large institutional investors create a serious disadvantage for
themselves because they incorrectly believe that due to their size they
can only buy large capitalization companies. This automatically eliminates from consideration most of the true growth companies. It also
practically guarantees inadequate performance because these investors
may restrict their selections mainly to slowly decaying, inefficient, fully
matured companies. As an individual investor, you don't have this limitation.
If I were a large institutional investor, I would rather own 200 of the
most outstanding, small- to medium-sized growth companies than 50 to
100 old, overgrown, large-capitalization stocks that appear on everyone's "favorite fifty" list.
If you desire clear-cut factual evidence, the 40 year study of the greatest stock market winners indicated more than 95% of the companies
had fewer than 25 million shares in their capitalization when they had
their greatest period of earnings improvement and stock market performance. The average capitalization of top-performing listed stocks from
1970 through 1982 was 11.8 million shares. The median stock exhibited
4.6 million shares outstanding before advancing rapidly in price.
Foolish Stock Splits Can Hurt
Corporate management at times makes the mistake of excessively splitting its company's stock. This is sometimes done based upon questionable advice from the company's Wall Street investment bankers.
In rny opinion, it is usually better for a company to split its shares 2-'
for-1 or 3-for-2, rather than 3-for-l or 5-for-l. (When a stock splits 2-for1, you get two shares for each one previously held, but the new shares
sell for half the price.)
Overabundant stock splits create a substantially larger supply and may
put a company in the more lethargic performance, or "big cap," status
sooner.
It is particularly foolish for a company whose stock has gone up in
price for a year or two to have an extravagant stock split near the end of
a bull market or in the early stage of a bear market. Yet this is exactly
what most corporations do.
They think the stock will attract more buyers if it sells for a cheaper
price per share. This may occur, but may have the opposite result the
32
A Winning System: C-A-N S-L-l-M
company wants, particularly if it's the second split in the last couple of
years. Knowledgeable professionals and a few shrewd traders will probably use the oversized split as an opportunity to sell into the obvious
"good news" and excitement, and take their profits.
Many times a stock's price will top around the second or third time it
splits. However, in the year preceding great price advances of the leading stocks, in performance, only 18% had splits.
Large holders who are thinking of selling might feel it easier to sell
some of their 100,000 shares before the split takes effect than to have to
sell 300,000 shares after a 3-for-l split. And smart short sellers (a rather
infinitesimal group) pick on stocks that are beginning to falter after
enormous price runups—three-, five-, and ten-fold increases—and
which are heavily owned by funds. The funds could, after an unreasonable stock split, find the number of their shares tripled, thereby dramatically increasing the potential number of shares for sale.
Look for Companies Buying
Their Own Stock in the
Open Market
One fairly positive sign, particularly in small- to medium-sized companies, is for the concern to be acquiring its own stock in the open marketplace over a consistent period of time. This reduces the number of shares
of common stock in the capital structure and implies the corporation
expects improved sales and earnings in the future.
Total company earnings will, as a result, usually be divided among a
smaller number of shares, which will automatically increase the earnings per share. And as we've discussed, the percentage increase in earnings per share is one of the principal driving forces behind outstanding
stocks.
Tandy Corp., Teledyne, and Metromedia are three organizations that
successfully repurchased their own stock during the era from the mid-
1970s to the early 1980s. All three companies produced notable results
in their earnings-per-share growth and in the price advance of their
stock.
Tandy (split-adjusted) stock increased from $234 to $60 between 1973
and 1983. Teledyne stock zoomed from $8 to $190 in the thirteen years
prior to June 1984, and Metromedia's stock price soared to $560 from
$30 in the six years beginning in 1977. Teledyne shrunk its capitalization from 88 million shares in 1971 to 15 million shares and increased
its earnings from $0.61 a share to nearly $20 per share with eight different huvbacks.
S = Supply and Demand
33
Low Corporate Debt to Equity
Is Usually Better
Alter you have picked a stock with a small or reasonable number of
shares in its capitalization, it pays to check the percentage of the
firm's total capitalization represented by long-term debt or bonds.
Usually the lower the debt ratio, the safer and better the company.
Earnings per share of companies with high debt-to-equity ratios can
be clobbered in difficult periods of high interest rates. These highly
leveraged companies generally are deemed to be of poorer quality and
higher risk.
A corporation that has been reducing its debt as a percent of equity
over the last two or three years is well worth considering. If nothing
else, the company's interest expense will be materially reduced and
should result in increased earnings per share.
The presence of convertible bonds in a concern's capital structure
could dilute corporate earnings if and when the bonds are converted
into shares of common stock.
It should be understood that smaller capitalization stocks are less liquid, are substantially more volatile, and will tend to go up and down
faster; therefore, they involve additional risk as well as greater opportunity. There are, however, definite ways of minimizing your risks, which
will be discussed in Chapter 9.
Lower-priced stocks with thin (small) capitalization and no institutional sponsorship or ownership should be avoided, since they have
poor liquidity and a lower-grade following.
A stock's daily trading volume is our best measure of its supply and
demand. Trading volume should dry up on corrections and increase
significantly on rallies. As a stock's price breaks out of a sound and
proper base structure, its volume should increase at least 50% above
normal. In many cases, it can increase 100% or more.
In summary, remember: stocks with a small or reasonable number of
shares outstanding will, other things being equal, usually outperform
older, large capitalization companies.