Electrical-design-of-long-distance-HV-transmission-systems
Bạn đang xem bản rút gọn của tài liệu. Xem và tải ngay bản đầy đủ của tài liệu tại đây (1.34 MB, 84 trang )
CONTENTS
NOTATION...........................................................................................................................
1
vii
ELECTRICITY TRANSMISSION SYSTEM OVERVIEW.........................................
1
1.1 Introduction.............................................................................................................
1.2 North American Transmission Grid........................................................................
1.3 Reliability and Congestion Issues...........................................................................
1.3.1 Transmission Constraints and Their Effects
on Operations and Reliability .....................................................................
1.3.2 Thermal Constraints....................................................................................
1.3.3 Voltage Constraints.....................................................................................
1.3.4 System Operating Constraints.....................................................................
1.4 Alternatives to Transmission Line Expansion ........................................................
1.4.1 Permit Higher Line Operating Temperatures .............................................
1.4.2 Improve Transmission Line Real-Time Monitoring...................................
1.4.3 Uprate Substation Equipment .....................................................................
1.4.4 Reconductor Existing Transmission Lines .................................................
1.4.5 Install Phase-Shifting Transformers ...........................................................
1.4.6 Install Capacitors for Reactive Power Support ...........................................
1.4.7 High-Temperature Superconducting Technologies ....................................
1.5 Transmission Line Design Specifications...............................................................
1.5.1 Overall Descriptive Specification ...............................................................
1.5.2 Tower Specifications ..................................................................................
1.5.3 Minimum Clearances ..................................................................................
1.5.4 Insulators.....................................................................................................
1.5.5 Lightning Protection ...................................................................................
1.5.6 Conductor Motion Suppression ..................................................................
1.6 Transmission Line Components .............................................................................
1.6.1 Towers.........................................................................................................
1.6.2 Conductors ..................................................................................................
1.6.3 Substations ..................................................................................................
1.6.4 ROWs..........................................................................................................
1.6.5 Multiple Lines.............................................................................................
1.6.6 Access Roads ..............................................................................................
1.7 Construction, Operation, and Maintenance ............................................................
1.7.1 Construction Phase......................................................................................
1.7.2 Operation and Maintenance Phase..............................................................
1.8 Design Features as Mitigation ................................................................................
1.8.1 Route Selection ...........................................................................................
1.8.2 ROW Design...............................................................................................
1.8.3 Transmission Line Design ..........................................................................
1.9 Best Management Practices ....................................................................................
1.9.1 Preconstruction BMPs ................................................................................
1.9.2 Construction BMPs.....................................................................................
1
3
6
iii
6
6
7
7
8
9
10
10
10
10
10
11
11
11
12
12
12
13
13
13
13
17
17
18
19
20
22
22
30
32
32
33
34
35
35
36
CONTENTS (Cont.)
1.9.3
2
Postconstruction BMPs...............................................................................
37
HIGH-VOLTAGE DIRECT CURRENT TRANSMISSION LINES............................
39
2.1
2.2
2.3
2.4
Background .............................................................................................................
Advantages of HVDC over HVAC Transmission ..................................................
Disadvantages of HVDC Transmission ..................................................................
HVDC Technologies...............................................................................................
2.4.1 Rectifying and Inverting Components ........................................................
2.4.2 AC Network Interconnections ....................................................................
2.4.3 Polarity and Earth Return............................................................................
2.4.4 Polarity and Corona Discharge ...................................................................
2.4.5 Transmission Lines and Cables ..................................................................
Design, Construction, Operation, and Maintenance Considerations ......................
HCDV Costs ...........................................................................................................
System Configurations............................................................................................
HVDC Applications................................................................................................
2.8.1 Applications Favoring HVDC Transmission Systems ...............................
2.8.2 Renewable Energy Applications.................................................................
Environmental Impacts of HVDC Transmission Systems......................................
2.9.1 Effects of Electric Fields.............................................................................
2.9.2 Effects of Magnetic Fields ..........................................................................
2.9.3 Radio Interference.......................................................................................
2.9.4 Audible Noise .............................................................................................
2.9.5 Ground Currents and Corrosion Effects .....................................................
2.9.6 Land Use Impacts .......................................................................................
2.9.7 Visual Impacts ............................................................................................
Summary.................................................................................................................
39
40
42
43
43
44
44
46
46
46
47
47
48
48
50
51
51
52
53
53
53
54
55
56
BELOWGROUND TRANSMISSION LINES..............................................................
57
3.1 Environmental Impacts of Belowground Transmission Lines................................
3.1.1 Land Use .....................................................................................................
3.1.2 Geology and Soils .......................................................................................
3.1.3 Water Resources .........................................................................................
3.1.4 Ecological Resources ..................................................................................
3.1.5 Visual Impacts ............................................................................................
3.1.6 Cultural Resources ......................................................................................
3.1.7 Air Quality ..................................................................................................
3.1.8 Noise and Traffic ........................................................................................
3.1.9 Socioeconomic Impacts ..............................................................................
3.1.10 Health and Safety........................................................................................
3.2 Underground Line Design Features as Mitigation..................................................
57
57
58
58
59
59
60
60
60
60
61
61
2.5
2.6
2.7
2.8
2.9
2.10
3
iv
CONTENTS (Cont.)
4
HIGH-TEMPERATURE SUPERCONDUCTOR TRANSMISSION LINES ..............
63
5
REFERENCES ...............................................................................................................
69
FIGURES
1.2-1
The History of Peak Transmission Line Voltage .....................................................
5
1.6-1
Lattice and Monopole Towers..................................................................................
14
1.6-2
Multiple Lines in a Power Corridor .........................................................................
15
1.6-3
Deviation Tower in a Residential Neighborhood.....................................................
16
1.6-4
Substation in the Vicinity of Manhattan, IL ............................................................
18
1.6-5
Wautoma Substation under Construction ................................................................
19
1.6-6
Commonly Used Terms in Road Design .................................................................
21
1.7-1
Clearing Vegetation for Expansion of Kangley-Echo Lake Substation ..................
24
1.7-2
Site Preparation for Construction of Substation ......................................................
25
1.7-3
Drilling Rock for Blasting to Set Tower Foundation Footings ...............................
26
1.7-4
Anchor Bolt Cage and Reinforcing for Tower Foundation Construction ................
26
1.7-5
Anchor Bolt Cage in Place .......................................................................................
27
1.7-6
Hole Being Drilled for Footing Leaves a Mound of Dirt, Rocks, and Clay ............
27
1.7-7
Helicopter Crane Being Connected to Tower Sections during Tower Assembly....
28
1.7-8
A Crane Being Used to Lower a Tower Section onto a Tower Base .......................
28
1.7-9
Substation under Construction .................................................................................
29
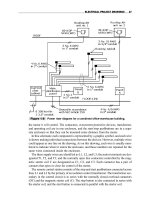
1.7-10 Fire Caused by Ground Fault ...................................................................................
32
v
TABLES
1.2-1
North American Electric Power Network by National Boundaries .........................
5
1.2-2
North American Electric Power Network Characteristics by Interconnection ........
6
1.6-1
Minimum ROW Widths ...........................................................................................
20
1.6-2
Access Road Types ..................................................................................................
21
1.7-1
Federal Explosives Storage Requirements ...............................................................
22
1.7-2
Corridor Length and Access Road Requirements for TEP Project ..........................
24
1.7-3
Hazardous Materials Typically Used for Transmission Line Construction .............
30
1.7.4
Number of Companies Reporting Various Inspection Frequencies .........................
31
vi
NOTATION
The following is a list of the acronyms, initialisms, and abbreviations (including units of
measure) used in this document. Acronyms and abbreviations used only in tables and figures are
defined in the respective tables and figures.
ACRONYMS, INITIALISMS, AND ABBREVIATIONS
AC
ACCR
ACSR
alternating current
aluminum conductor composite reinforced
aluminum conductor steel reinforced
BSCCO
BLM
BMP
BPA
BZO
bismuth strontium calcium copper oxide
Bureau of Land Management
best management practice
Bonneville Power Authority
barium zirconate
CD
cold dielectric
DC
DOE
DOT
direct current
U.S. Department of Energy
U.S. Department of Transportation
ERCOT
EIA
EIS
ELF
EMF
ESRI
Electric Reliability Council of Texas
Energy Information Administration
Environmental Impact Statement
extremely low frequency
electromagnetic field
Environmental Systems Research Institute, Inc.
GIS
geographical information system
HTS
HVAC
HVDC
high-temperature superconductor
high-voltage alternating current
high-voltage direct current
IEEE
IGBT
Institute of Electrical and Electronic Engineers, Inc.
insulated-gate bipolar transistor
LN2
LTS
LTT
liquid nitrogen
low-temperature superconductor
light-triggered thyristor
vii
NCEP
NHPA
National Commission on Energy Policy
National Historic Preservation Act
OPIT
OSHA
oxide powder in tube
Occupational Safety and Health Administration
RMS
ROW(s)
root mean square
right(s)-of-way
SDGE
SEC
San Diego Gas & Electric
sealing end compound
TEP
Tucson Electric Power
USFS
U.S. Forest Service
VSC
voltage sourced converter
WD
warm dielectric
YBCO
yttrium barium copper oxides
UNITS OF MEASURE
A
ampere(s)
cm
°C
centimeter
degree(s) Centigrade
dB
decibel(s)
Hz
hertz
K
kA
km
kV
Kelvin
kiloampere(s)
kilometer(s)
kilovolt(s)
lb
pound(s)
viii
m2
μT
m
MPa
MVA
MVAR
MW
square meter(s)
micro Tesla
meter(s)
megapascal(s)
megavolt ampere(s)
megavolt-ampere(s) reactive
megawatt(s)
T
Tesla
V
volt(s)
W
watt(s)
1
1 ELECTRICITY TRANSMISSION SYSTEM OVERVIEW
1.1 INTRODUCTION
Early on in the development of electric power, its proponents and developers recognized
the importance of economies of scale in power generation. If power could be distributed to a
broader customer base, larger, centralized generation facilities could be built providing power at
much lower costs. In turn, these lower costs would attract more customers, making even larger
scale production possible. However, several factors limit the practical scale of central generation.
Most obviously, the practical size of boilers, turbines, and other generating plant equipment is
limited by the ability to manufacture and transport this equipment to a plant site. Over the last
century, commercial power equipment has evolved such that practical generating station
capacities have increased from 5 megawatts (MW)1 to several thousand megawatts. In the
absence of other constraints, central plant size could continue to increase, at least in a modular
fashion, by adding more and more units of similar design at a given site. There are other
constraints, though, so that the practical size of central generating facilities may actually decline
in the future. These constraints include fuel and resource supply at a given site, limits imposed
by the natural environment for dissipating waste heat, transport and disposal of waste products,
community environmental standards, reliability and security concerns, and the economics of
power transmission.
As central power station size increased, the plant operators faced myriad challenges in
distributing power to customers. Photographs of commercial urban areas in the early years of the
twentieth century often reveal a labyrinth of overhead wires from competing suppliers of power
(and also of communications). This highly inefficient example of competitive markets was tamed
by a system of regulation granting a limited monopoly to selected firms in exchange for
providing reliable power service to a community. The development of the regulated industry
structure further encouraged centralization of power production and the need for larger
distribution networks. By 1910, Samuel Insull had begun rural electrification, so long-distance
distribution to rural and other remote customers was needed. In some cases, these developing
distribution systems were linked, connecting several generating stations and improving the
reliability of power supply.
Among the limiting factors to centralization is the increasing cost of distributing power.
This cost has both significant capital-investment and operating-cost components. The operating
cost is principally due to power lost through electrical resistance. As the line length increases, so
does the resistance loss. Electrical resistance converts electric power into thermal energy, which
is lost to the atmosphere. At least through the 1980s, utility engineers in the Midwest estimated
the power lost through transmission and distribution at 7% of the power leaving the generating
station (the bus bar power output). This common experience suggests that 7% line loss was the
optimum economic trade-off against the economies of scale inherent in the centralization of
power production.
1 In 1902, a 5-MW turbine was installed at the Fisk St. Station in Chicago.
2
To clearly describe power transmission facilities, it is necessary to draw a distinction
between transmission and distribution, both of which refer to the transport of electricity.
Distribution refers to supplying power to retail customers. Distribution lines normally run from
substations through a distribution line network. The key distinction between distribution and
transmission arises from the issue of resistive power loss and the fact that the power loss can be
reduced by increasing the operating voltage of a line. The final distribution of electrical power to
retail customers occurs over relatively short distances, while much longer distances are typically
associated with electrical transmission between power plants or between power generators and
the sometimes remote communities that they serve. Accordingly, one would expect to find high
operating voltages to be a characteristic of transmission lines. Actually, transmission line voltage
is normally 115,000 volts (115 kilovolts [kV]) or higher (EIA 2002). In contrast, primary
distribution lines generally reach distances of no more than a few miles, although in rural areas
they may extend more than 50 miles (Hayes 2005). These lines generally range from 2.4 to
25 kV with occasional installations up to 46 kV (Hayes 2005). In some cases, customers are
served directly at these high voltages, but most customers receive power by means of secondary
distribution lines that branch off the primary lines at voltages of 120 V or 240 V. These
low-voltage lines generally traverse only a few hundred yards.
This report focuses on transmission lines, which operate at voltages of 115 kV and
higher. Currently, the highest voltage lines comprising the North American power grid are at
765 kV. The grid is the network of transmission lines that interconnect most large power plants
on the North American continent. One transmission line at this high voltage was built near
Chicago as part of the interconnection for three large nuclear power plants southwest of the city.
Lines at this voltage also serve markets in New York and New England, also very high demand
regions. The large power transfers along the West Coast are generally at 230 or 500 kV. Just as
there are practical limits to centralization of power production, there are practical limits to
increasing line voltage. As voltage increases, the height of the supporting towers, the size of the
insulators, the distance between conductors on a tower, and even the width of the right-of-way
(ROW) required increase. These design features safely isolate the electric power, which has an
increasing tendency to arc to ground as the voltage (or electrical potential) increases. In addition,
very high voltages (345 kV and above) are subject to corona losses. These losses are a result of
ionization of the atmosphere, and can amount to several megawatts of wasted power.
Furthermore, they are a local nuisance to radio transmission and can produce a noticeable hum.
Centralized power production has advantages of economies of scale and special resource
availability (for instance, hydro resources), but centralized power requires long-distance transfers
of power both to reach customers and to provide interconnections for reliability. Long distances
are most economically served at high voltages, which require large-scale equipment and impose
a substantial footprint on the corridors through which power passes. The most visible
components of the transmission system are the conductors that provide paths for the power and
the towers that keep these conductors at a safe distance from each other and from the ground and
the natural and built environment. Common elements that are generally less visible (or at least
more easily overlooked) include the maintained ROW along the path of the towers, access roads
needed for maintenance, and staging areas used for initial construction that may be restored after
construction is complete. Also visible but less common elements along the corridor may include
3
Fundamental Concepts of Electrical Power Transmission
Voltage, current, power, and electrical energy are some of the most frequently used terms when
discussing transmission line characteristics.
Voltage. The voltage of a transmission line determines the line’s ability to transmit electricity. This
electric force, or electric potential, is measured in volts (V), or more typically in kilovolts (kV);
1 kV = 1,000 V.
Current. The current through a transmission line is a measure of the amount of electricity that is
moving through a conductor. Current flow through a conductor is measured in amperes (amps).
Power. Power flowing through a power station is measured in watts (W), or more typically
megawatts (MW), where 1 MW = 1,000,000 W. Power (more accurately, complex power) in an
alternating-current system depends on the system voltage and current flow and is comprised of
two components: real power and reactive power. If a small circuit has no reactive components
(like these found in motors or computer power supplies) and is purely resistive (like those of an
incandescent light bulb or toaster), then all power transferred through the circuit is real power
(i.e., pure MW). Once a motor, for example, is added to a circuit, a reactive power component
(measured in megaVARs [MVAR], for megavolt-amps reactive) is introduced along with the real
power component. Both aspects of complex power are present and important in transmission system
operations, and the respective amount of each is related to the line’s power factor. Unfortunately,
real power is often used synonymously for complex power. This simplification neglects the effects
that reactive power can have on system stability and system operation.
Electrical energy. Energy is a measure of the ability to do work. The energy required by a load or
provided by a generator is the product of power and time, and is usually expressed in kilowatt hours
(kWh).
switching stations or substations, where lines of similar or different voltages meet to transfer
power.
1.2 NORTH AMERICAN TRANSMISSION GRID
The interconnection of generating stations that started in the early years of the electricity
industry continued as capacity grew, eventually evolving into what is known as the North
American Transmission Grid. As it stands, this grid was not intended for the long-term transfer
of large blocks of power. Historically, utilities planned capacity expansions so that they would be
self-sufficient. Imports through interconnections with other utilities were short-term solutions for
outages or other upset conditions. Most of the capacity of interties was reserved to maintain
reliability in the face of such unplanned events. The use of interties for long-term inter-utility
power transfers began to grow in the 1980s due to regional imbalances in generating capacity
and power demand. The favorable economics for nonutility generators also promoted this trend
for increased power transfers, or “wheeling.” As a result, some expansion in the transmission
infrastructure occurred, transmission line loading increased, and transmission lines were
4
typically operated with higher loadings than in the past. Persistent regional imbalances involving
fuel resource location, demand concentration, and environmental constraints are expected to
increase reliance on the transmission grid for routine power transfers. Regulatory changes that
allow purchasers to contract for power requirements with remote suppliers have been increasing
transmission demands for some years (EIA 2000). This increased transmission system usage has
lead to small transmission system transfer capability margins and has compromised the operating
reliability of our nation’s power grid. These factors are expected to require continued expansion
of the North American Transmission Grid (Incentives Research, Inc. 1995). Resolving these
transmission issues is not straightforward and is further compounded by complex siting and
regulatory issues that are not easily overcome (NCEP 2006).
The North American electric system includes power generation, storage, transmission,
and distribution facilities in Canada, the United States, and northern Mexico (Baja Norte). The
first commercial power station was opened in 1879 in San Francisco, one year after the founding
of the Edison Electric Light Company in the United States and American Electric and
Illuminating in Montreal. In 1901, the first transmission line between the United States and
Canada was opened at Niagara Falls. In 1905, work began on the Great Southern Grid. By 1914,
that grid provided electricity transmission in North and South Carolina, Georgia, and Tennessee.
In 1922, the Connecticut Valley Power Exchange pioneered utility interconnections. The first
regional power pool, the Pennsylvania−New Jersey−Maryland Interconnection, was opened in
1927. As the extent of utility interconnections increased, so did the highest voltages employed
for transmission. Figure 1.2-1 summarizes the history of peak transmission voltages according to
their year of introduction.
The single most important parameter defining an electric power system is the peak
electrical demand. This peak demand determines the necessary reliable generating capacity and
the minimum capacity of the transmission and distribution systems. The peak demand is the
instantaneous demand that occurs during a specified time period. Normally, peak demand is
specified separately for the summer and winter seasons. Some regions have a higher summer
peak demand, while others have a higher winter peak demand. The peak summer demand on the
entire North American system was approximately 817,000 MW in 2004. The peak winter
demand was 716,000 MW. At the time, there was approximately 20% excess generating
capacity, for a total of 990,000 MW in 2004. The bulk transmission system operating between
115 and 765 kV delivers this power to distribution systems, with more than 207,200 miles of
transmission lines operating at voltages higher than 230 kV. The distribution of demand,
capacity, and circuit miles by national boundaries is summarized in Table 1.2-1.
For the power system, interconnection boundaries within the North American electric
system are more important than the political boundaries. These interconnection boundaries
separate the system into the Eastern, Western, and Electric Reliability Council of Texas
(ERCOT) Interconnections. The ERCOT Interconnection is limited to Texas and covers most of
that state. The Rocky Mountains separate the Eastern Interconnection from the Western
Interconnection. The Western Interconnection serves 12 western states and 2 western provinces.
Within each interconnection, all electric utilities are interconnected and operate synchronously;
that is, the generators are operated such that the peak voltage from all generators occurs
simultaneously. Voltage from alternating current (AC) generators varies sinusoidally reaching a
5
FIGURE 1.2-1 The History of Peak Transmission Line Voltage
(Source: Data from EIA 2000)
TABLE 1.2-1 North American Electric Power
Network by National Boundaries
Summer peak, MW
Winter peak, MW
Capacity, MW
Circuit miles >230 kV
48 States
Canada
Baja Norte
745,000
622,000
893,000
160,000
70,000
92,000
95,000
46,600
2,000
2,000
2,000
600
Source: Johnson (2004).
peak or minimum 60 times per second. If generators were not “in phase,” the voltage from one
would cancel some of the voltage from others. The distribution of demand, capacity, and circuit
miles by interconnection is provided in Table 1.2-2.
These three major interconnections are connected to one another by a few direct current
(DC) lines. The use of direct current avoids the need to synchronize the interconnections. On one
side of the DC tie, current from the interconnection is converted from AC to DC. On the other
side, it is converted from DC to AC such that it is in phase with the receiving interconnection.
The ERCOT Interconnection is linked to the Eastern Interconnection via two DC lines having a
total capacity of 800 MW. A total of eight ties with a capacity of 1,400 MW connect the Eastern
and Western Interconnections. The ERCOT and Western Interconnections are not linked.
6
TABLE 1.2-2 North American Electric Power
Network Characteristics by Interconnection
Interconnection
Summer peak, MW
Capacity, MW
Circuit miles > 230 kV
Eastern
610,000
725,000
130,000
Western
143,000
188,000
70,000
ERCOT
63,000
79,000
8,000
Source: Johnson (2004).
1.3 RELIABILITY AND CONGESTION ISSUES
1.3.1 Transmission Constraints and Their Effects on Operations and Reliability2
As the transmission system has expanded over the years, surplus capacity available on
transmission lines always seems to be consumed as the system grows or as transmission users
find more economical ways of meeting system demands. Expansion leads to more usage that
leads to more expansion. Transmission congestion results when a particular electricity
transmission path cannot accommodate increased power flow. Although the reasons for
congestion vary, the common consequence is that increased power flow on a particular
transmission path is not possible without risking system reliability. This section identifies some
of the common types of constraints and introduces some of the electrical phenomena associated
with these issues.
1.3.2 Thermal Constraints
Line sag caused by exceeding a transmission line’s thermal limit can result in a line fault,
which is an arc between the transmission line and nearby vegetation, structures, or ground. When
line faults occur, protective transmission line components remove the line from service to protect
terminal equipment from serious damage. Once the faulted line is removed from service, other
transmission lines in the system experience increased loads as they compensate for loss of the
faulted line. Overloading can then occur on these transmission lines, which might exceed thermal
operating constraints. If not controlled promptly, additional transmission line faults may occur.
To ensure reliable system operation, a thermal operating constraint (specified in real power, or
megawatts) is often placed on troublesome transmission lines to control the permissible power
transfer across the lines. This limit establishes an upper bound on a particular line’s transfer
capability. It is important to note that in some cases, the transfer limit set on a particular line may
2 This section is largely a summary of portions of the Energy Information Administration (EIA) publication
Upgrading Transmission Capacity for Wholesale Electric Power Trade (EIA 2002). The scope, organization,
and conclusions of the original document are reflected here.
7
actually minimize the overheating of a different transmission line. Transmission line additions
tend to alleviate the potential for exceeding transmission line capacity limits, at least until future
uses of the additional transfer capacity are discovered and new limiting factors are reached.
System operators understand that, as a short-term workaround, the thermal limit may be
exceeded in emergency situations. For this reason, transmission lines may also carry an
emergency rating subject to a length of time that permits a higher transfer limit as long as the
length of time the transfer is in effect does not exceed the specified period, for example, a
10-min emergency rating. In general, thermal constraints are more common in areas where the
transmission system is tightly interconnected (shorter lines), such as within the Eastern
Interconnection (Burgen 1986).
1.3.3 Voltage Constraints
Primarily as a result of transmission line reactance, the voltage at the receiving end of a
conductor will be less than the voltage applied on the sending end. Large voltage deviations
either above or below the nominal value may damage utility or customer equipment. Therefore,
operating voltage constraints are employed to preserve operating conditions that meet necessary
voltage requirements. In general, voltage constraints are more typical in areas where
transmission lines are sparse and long, such as in the Western Interconnection (Burgen 1986). It
may be more economical to address voltage constraints by modifying existing lines, such as
adding capacitance, rather than by adding new transmission capacity.
1.3.4 System Operating Constraints
1.3.4.1 Parallel Flows
System operators can estimate the impacts of contract flows (those flows defined as
point-to-point transactions) on parallel paths in the transmission system. These estimates allow
operators to adjust contract schedules to minimize the likelihood of encountering a transfer limit
on system transmission lines caused by loop flows. Therefore, specific operating constraints may
be in place to mitigate the effects of parallel path power flows.
1.3.4.2 Operating Security
To ensure system operating reliability, an industry-derived set of standards and
procedures has been recommended by the North American Electric Reliability Council (NERC).
These recommendations suggest, for example, that the system should be operated so that it
remains reliable in spite of disruption of a single system component (e.g., loss of one generator
or loss of one transmission line). As a result, NERC operating guides tend to limit the maximum
allowable operating capacity of a transmission line to a value less than its actual thermal limit to
ensure available capacity in the event of a nearby transmission line outage. Similarly, NERC
8
guidelines call for a generation margin to assure that sufficient generation remains on-line in the
event of a generator outage. Likewise, operating guides exist to limit system effects caused by
other types of conditions that affect system stability. All of these operating conditions are
recommended as a means to improve overall system reliability while underutilizing specific
system components. In addition, all system operators follow preventive operating guidelines to
assure overall system integrity and reliability.
1.3.4.3 System and Voltage Stability
Because loads constantly change, small variations in frequency occur as the mechanical
power at generator turbines adjusts to variations in electrical power demand. As long as
frequency variations are small (i.e., small-signal stability), the interconnected system remains
synchronized. The system will continue to operate in a stable manner unless the variations
continue to gain in magnitude and oscillate at low frequencies. These oscillations can lead to
more threatening voltage and frequency problems that may lead to instability and potentially to
cascading outages.
Larger oscillations occur when system components are removed from service because a
fault or disruption occurs. For example, frequency variations caused by a generator that goes
off-line tend to be larger in magnitude than small-signal oscillations caused by load variations.
Larger frequency swings provide more potential for uncontrolled swings that could lead to
steady-state instability. Preventative measures are needed to minimize the likelihood of system
instability, which could lead to widespread system outages. A system that lacks transient stability
can produce these operating characteristics if corrective measures are not exercised to eliminate
the condition.
Voltage instability occurs when the transmission system is exposed to large reactive
power flows. As previously described, large reactive power flows on long transmission lines
result in voltage drops at the receiving end of the line. Lower voltage causes increased current,
which causes additional reactive losses. The end result is voltage collapse, which can damage
equipment and cause additional outages, if left unresolved.
In general, long transmission lines are stability limited, not thermally limited
(Burgen 1986). Generally, depending on the system conditions, equipment enhancements to add
more reactive power or additional transmission lines can relieve steady-state and voltage stability
problems.
1.4 ALTERNATIVES TO TRANSMISSION LINE EXPANSION
The addition of a new transmission line is not the only way to relieve power transfer
constraints. There are a variety of approaches that may provide incremental improvements to
transfer capability (with benefits anywhere from a few percent to doubled capability).
Transmission owners are aware of these options and would consider the most cost-effective
9
Technical Limits to Power Transfers
Conductor resistance, temperature rating, and line sag. As a transmission line receives power,
resistance inherent in the line conductor material converts some of the electrical energy into thermal
energy, thereby increasing the line temperature. Line temperature increases as the current flowing
through the line increases. Power transfers above a predetermined safe operating transfer limit can
cause excessive conductor temperature, which causes line conductors to expand in length. Also,
excessive operating temperatures may weaken the conductor, reducing its expected life. For
underground conductors, high operating temperatures can damage insulation. Because aboveground
transmission lines are suspended on fixed-distance tower structures, an expanding conductor
manifests itself as sagging that reduces conductor distance to ground at the midpoint between towers.
Because of line weakness at higher temperatures, this sagging can become permanent.
Voltage drop. The voltage drop increases as transmission line length increases. Similarly, the
terminating voltage at the receiving end may vary above or below the recommended or nominal
operating voltage, depending on the types of loads connected to the receiving end. Voltage constraints
define the criteria needed to maintain receiving-end voltages within specified bounds (usually ± 5%
of the nominal voltage). Customer and utility equipment operates most efficiently when operated near
the nominal voltage level.
Parallel flows. Because the electric power grid provides an interconnected set of transmission lines,
the flows that one might expect to occur over the transmission line that directly connects Area A to
Area B actually occur over all of the interconnected lines in varying amounts. It may be true that the
direct line may transfer most (perhaps 60%) of the power from Area A to Area B, but lines that are
parallel to the direct line will also carry some portion of the power between the areas. Because
electric power does not flow between areas in a simple manner that follows the contract path, the
presence of parallel flows can cause a violation of thermal constraints on other lines in the system.
Synchronization. When two or more generators operate using the same interconnected transmission
system, the generators must be synchronized. In the United States, this frequency is very near
60 hertz. Assuring synchronization maximizes power transfers and minimizes utility and customer
equipment damage. In addition, synchronization helps to avoid transient instability and small-signal
instability.
Source: EIA (2002).
option prior to suggesting the construction of a new transmission line in a new corridor. Below is
a summary of these alternatives (EIA 2002).
1.4.1 Permit Higher Line Operating Temperatures
Although not generally recommended for extended periods of time, higher line operating
temperatures may be permissible as line ratings are increased. However, increased sag and
insulator integrity may be compromised. This alternative should be used with caution and should
not be viewed as a permanent solution to a thermal line limit.
10
1.4.2 Improve Transmission Line Real-Time Monitoring
The actual temperatures occurring on transmission lines depend on the current, as well as
on ambient weather conditions, such as temperature, wind speed, and wind direction. Because
the weather affects the dissipation of heat into the air, an effort to monitor environmental
conditions can result in higher line loading, if ambient conditions permit. When actual monitored
values are used to establish line ratings, generic ratings based on nonspecific environmental
conditions that are often very conservative can be avoided.
1.4.3 Uprate Substation Equipment
Just as thermal limits define maximum current flow values on transmission lines,
equipment located at the terminating ends of a transmission line also have maximum current
limits. In some situations, the limiting capacity may be linked to the equipment capabilities at the
substation and not to the transmission line. If this is the case, the equipment at the substation can
be replaced with larger components to increase the effective transfer limit of the line and its
associated equipment.
1.4.4 Reconductor Existing Transmission Lines
To mitigate underrated transmission lines, the actual line conductors can be replaced with
larger conductors to increase the transfer limit of the transmission line. Sometimes, multiple
conductors are bundled together to obtain this improvement. As long as existing tower structures
are adequate to support the additional weight of the new conductors, this alternative is useful to
increase transfer capability. In some situations, this alternative may be cost-effective even when
tower structures and insulators require modifications.
1.4.5 Install Phase-Shifting Transformers
As previously indicated, loop flows can have a significant effect on designated transfer
limits. One method to reduce loop flows uses phase-shifting transformers to help direct flows to
transmission lines with sufficient transfer capability. As a result, transfers that take place on
transmission lines that are not part of the primary flow path are lessened so that transfer limit
violations are not attained. Although phase-shifting transformers are costly and consume
additional energy, they are widely used in the western United States.
1.4.6 Install Capacitors for Reactive Power Support
In situations where voltage support is problematic, capacitor banks can be used to
increase the reactive power at a system bus to return voltage levels to nominal operating values.
This method of increasing reactive-power support is often used to minimize voltage support
problems and improve system stability.
11
1.4.7 High-Temperature Superconducting Technologies
Although mostly used for underground transmission line applications, more transmission
line applications are using high-temperature superconducting methods. Although upgrades that
use superconductors may be more costly, the method is most useful in areas were new ROWs are
not available and existing conduits must be used.
1.5 TRANSMISSION LINE DESIGN SPECIFICATIONS
The towers and conductors of a transmission line are familiar elements in our landscape.
However, on closer inspection, each transmission line has unique characteristics that have
correspondingly unique implications for the environment. In this section, we list design
specifications (line characteristics) that are commonly required to define a transmission line.
Many of these specifications have implications for the net environmental effects.3 For the
purpose of this report, a range of values is considered for these specifications, with the exception
that a fixed nominal voltage of 500 kV is assumed.
1.5.1 Overall Descriptive Specification
The most basic descriptive specifications include a line name or other identifier, nominal
voltage, length of line, altitude range, and the design load district. The line identifier is
commonly taken from endpoint names, e.g., Inland−Macedonia on the Cleveland Electric
Illuminating Co. system. The endpoint names are generally geographic points, but may be
substation names or major industrial facilities. The nominal voltage is an approximation to actual
line voltage that is convenient for discussion. Actual voltage will vary according to line
resistance, distance, interaction with connected equipment, and electrical performance of the
line. For AC lines, the nominal voltage is close to the RMS (root mean square) voltage.4 The
altitude range is a rough surrogate for weather and terrain. This is important, since nearly all
aspects of line design, construction, and environmental impacts are linked to weather. The design
load district is another surrogate for weather. These districts are defined by the National
Electrical Safety Code (NESC) and by some local jurisdictions. These districts include NESC
Heavy Loading, NESC Medium Loading, NESC Light Loading, California Heavy Loading, and
California Light Loading. The design wind and ice loading on lines and towers is based on the
design load district. This affects insulator specifications as well as tower dimensions, span
lengths, tower design, and conductor mechanical strength and wind dampening.
3 This information is extracted from utility survey results collected for the Electric Power Research Institute, Inc.
(EPRI 1982).
4 Taking the square of the voltage eliminates the sign change present in alternating current. The average of this
positive value is then the square of the average voltage without regard to sign. RMS is the square root of this
average. Thus, it is a good representation of the voltage supplied to a load.
12
1.5.2 Tower Specifications
The towers support the conductors and provide physical and electrical isolation for
energized lines. The minimum set of specifications for towers are the material of construction,
type or geometry, span between towers, weight, number of circuits, and circuit configuration. At
500 kV, the material of construction is generally steel, though aluminum and hybrid
construction, which uses both steel and aluminum, have also been used. The type of tower refers
to basic tower geometry. The options are lattice, pole (or monopole), H-frame, guyed-V, or
guyed-Y. The span is commonly expressed in the average number of towers per mile. This value
ranges from four to six towers per mile. The weight of the tower varies substantially with height,
duty (straight run or corner, river crossing, etc.), material, number of circuits, and geometry. The
average weight of 670 towers for 500-kV lines included in the EPRI survey (EPRI 1982) is
28,000 lb. The range of reported tower weights is 8,500 to 235,000 lb. The type of tower
(specific tower geometry) is very site-dependent, and, for any given conditions, multiple options
are likely to exist. The next section provides some illustrations of specific tower types and
describes their relative impacts. The number of circuits is generally either one or two. The circuit
configuration refers to the relative positioning of conductors for each of the phases. Generally
the options are horizontal, vertical, or triangular. The vertical orientation allows for a more
compact ROW, but it requires a taller tower.
1.5.3 Minimum Clearances
The basic function of the tower is to isolate conductors from their surroundings, including
other conductors and the tower structure. Clearances are specified for phase-to-tower, phase-toground, and phase-to-phase. Phase-to-tower clearance for 500 kV ranges from about 10 to
17 feet, with 13 feet being the most common specification. These distances are maintained by
insulator strings and must take into account possible swaying of the conductors. The typical
phase-to-ground clearance is 30 to 40 feet. This clearance is maintained by setting the tower
height, controlling the line temperature to limit sag, and controlling vegetation and structures in
the ROW. Typical phase-to-phase separation is also 30 to 40 feet and is controlled by tower
geometry and line motion suppression.
1.5.4 Insulators
Insulator design varies according to tower function. For suspension towers (line of
conductors is straight), the insulator assembly is called a suspension string. For deviation towers
(the conductors change direction), the insulator assembly is called a strain string. For 500-kV
lines, the insulator strings are built up from individual porcelain disks typically 5.75 inches thick
and 10 inches in diameter. The full string is composed of 18 to 28 disks, providing a long path
for stray currents to negotiate to reach ground. At this voltage, two to four insulator strings are
commonly used at each conductor connection point, often in a V pattern to limit lateral sway.
13
1.5.5 Lightning Protection
Since the towers are tall, well-grounded metallic structures, they are an easy target for
lightning. This puts the conductors, other energized equipment, and even customer equipment at
high risk. To control the effects of lightning, an extra set of wires is generally strung along the
extreme top points of the towers. These wires are attached directly to the towers (no insulation),
providing a path for the lightning directly to and through the towers to the ground straps at the
base of the towers. The extra wires are called shield wires and are either steel or aluminum-clad
steel with a diameter of approximately ½ inch.
1.5.6 Conductor Motion Suppression
Wind-induced conductor motion, aeolian vibration, can damage the conductors. A variety
of devices have been employed to dampen these oscillatory motions. By far, the most common
damper style on 500 kV lines is called the Stockbridge damper. These devices look like
elongated dumbbells hung close to and below the conductors, a few feet away from the point of
attachment of the conductors to the tower. The weighted ends are connected by a short section of
stiff cable, which is supported by a clamp to the conductor immediately above. Dampers can
prevent the formation of standing waves by absorbing vibrational energy. Typically, a single
damper is located in each span for each conductor.
1.6 TRANSMISSION LINE COMPONENTS
1.6.1 Towers
Transmission towers are the most visible component of the bulk power transmission
system. Their function is to keep the high-voltage conductors separated from their surroundings
and from each other. Higher voltage lines require greater separation. The unintended transfer of
power between a conductor and its surroundings, known as a fault to ground, will occur if an
energized line comes into direct contact with the surroundings or comes close enough that an arc
can jump the remaining separation. A fault can also occur between conductors. Such a fault is
known as a phase-to-phase fault. The first design consideration for transmission towers is to
separate the conductors from each other, from the tower, and from other structures in the
environment in order to prevent faults. This requirement and the electrical potential (voltage)
define the basic physical dimensions of a tower, including its height, conductor spacing, and
length of insulator required to mount the conductor. Given these basic dimensions, the next
design requirement is to provide the structural strength necessary to maintain these distances
under loading from the weight of the conductors, wind loads, ice loading, seismic loads, and
possible impacts. Of course, the structure must meet these requirements in the most economical
possible manner. This has lead to the extensive use of variants on a space frame or truss design,
which can provide high strength with minimal material requirements. The result is the ubiquitous
lattice work towers seen in all regions of the country. The last design requirement is to provide a
foundation adequate to support the needed tower under the design loads.
14
Some of the environmental implications of a transmission line result directly from these
transmission tower design requirements. First, the physical dimensions of the towers and the
resulting line arrangements and line spacing establish the necessary minimum dimensions of the
ROW, including clearances to natural and man-made structures. To create and maintain these
clearances, it is often necessary to remove or trim vegetation during construction and operation.
In addition, excavation, concrete pouring, and pile driving are required to establish foundations.
All of these tasks require access roads and service facilities with dimensions and strength
sufficient to handle large, heavy tower components, earthmoving equipment, and maintenance
equipment.
Figure 1.6-1 shows a lattice-type tower with a single-circuit 765-kV line. A close look at
the figure reveals twelve conductors strung from insulators suspended on the crossbar, but this is
a single-circuit line. A single-circuit AC line transfers power in three phases. The voltage in each
phase varies sinusoidally with a period of 1/60 second, and each of the phases is separated from
the others by 120 degrees. Thus, there are three isolated conductors for a single AC transmission
circuit. In addition, some high-capacity circuits at up to 345 kV use multiple (bundled)
conductors for each phase rather than a single larger conductor. The lattice tower in Figure 1.6-1
uses groups of four conductors to carry each of the three phases. Above 345 kV, bundled
conductors are normally used to reduce corona discharge.
There are several other features to note in Figure 1.6-1. The conductors are supported in a
horizontal configuration. This configuration requires broad towers to achieve adequate line
separation, which is about 45 feet between conductors for 765 kV. The horizontal configuration
requires a correspondingly greater cleared width for the ROW than a vertical configuration,
FIGURE 1.6-1 Lattice (left) and Monopole (right) Towers
(Source: Argonne Staff Photo)
15
which stacks the conductors in a vertical plane. The vertical configuration results in higher,
narrower towers. An alternative to the lattice tower, the monopole tower, is also used in this
power corridor. In this case, the monopole supports much lower-voltage conductors for
distribution to industrial customers and substations. Thus, the size comparison suggested in the
figure is not valid. Still, monopole towers can be used for transmission-level voltages and do
reduce the apparent footprint of the towers.5 The monopole structures shown here actually
support two circuits of three conductors each, for a total of six isolated conductors. Just barely
visible at the top outer edges of these towers are grounding lines that are connected directly to
the towers and that serve as lightning protection. Finally, it is important to recognize that
Figure 1.6-1 represents an important type of shared energy corridor, a power corridor with
multiple circuits supported on separate towers. Because of spacing requirements to avoid faults,
substantial width is required to separate the tower lines. This is discussed further in
Section 1.6.4. Figure 1.6-2 shows another example of a shared corridor. Here, a high-voltage
distribution line is flanked by much higher-voltage transmission lines. Note that the lattice
towers each carry two (three-phase) circuits in a vertical configuration and that single rather than
bundled conductors are used. The point of view of the photograph obscures the fact that the
lattice towers are twice the height of the wood pole structures.
FIGURE 1.6-2 Multiple Lines in a Power Corridor (Source: Argonne
Staff Photo)
5 Monopole construction requires deeper foundations with greater mass than the lattice towers, which generally
rest on smaller foundations set only at each corner. Thus, for a smaller visual footprint, more excavation and
concrete work may be required.